Market Overview
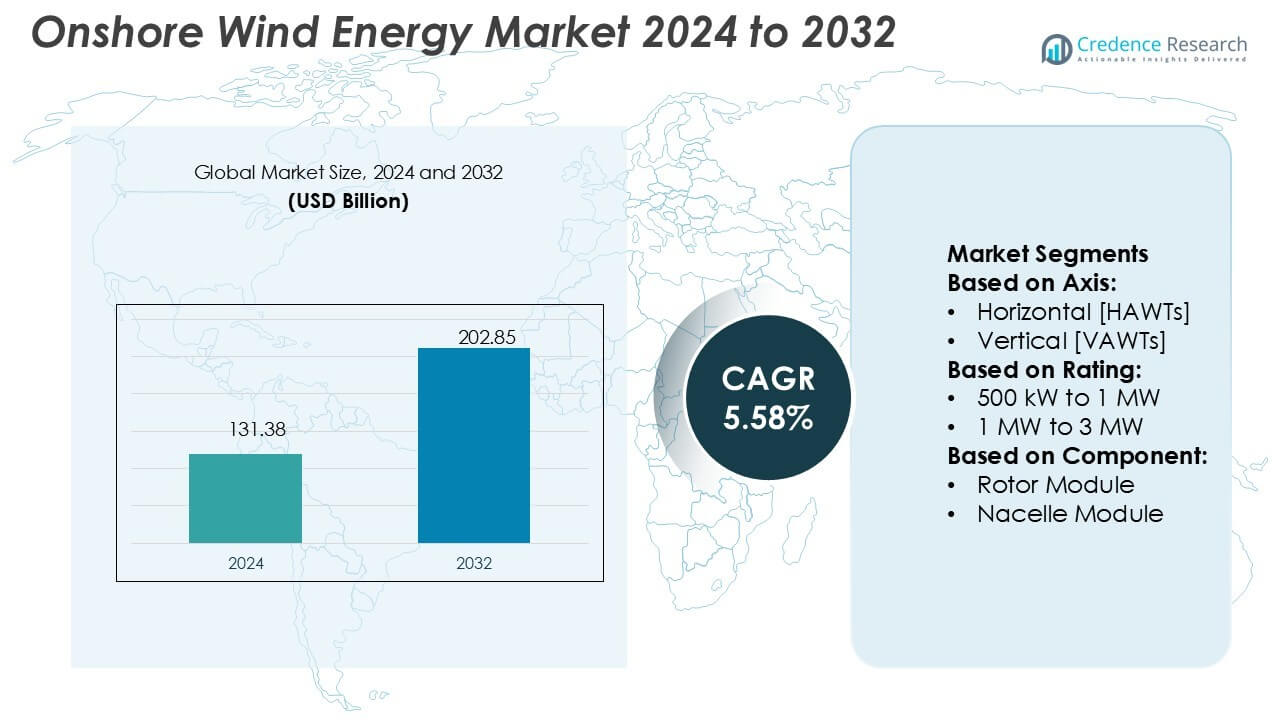
Onshore Wind Energy Market size was valued USD 131.38 billion in 2024 and is anticipated to reach USD 202.85 billion by 2032, at a CAGR of 5.58% during the forecast period.
| REPORT ATTRIBUTE |
DETAILS |
| Historical Period |
2020-2023 |
| Base Year |
2024 |
| Forecast Period |
2025-2032 |
| Onshore Wind Energy Market Size 2024 |
USD 131.38 Billion |
| Onshore Wind Energy Market, CAGR |
5.58% |
| Onshore Wind Energy Market Size 2032 |
USD 202.85 Billion |
The onshore wind energy market features strong competition among leading players such as Vestas, Siemens Gamesa Renewable Energy, GE Vernova, Goldwind, Nordex Group, Mingyang Smart Energy, Envision Energy, Hitachi Energy, Shanghai Electric, and Senvion. These companies focus on advanced turbine technologies, sustainable manufacturing, and expanding global project pipelines to secure market leadership. Asia-Pacific dominates the market with a 34% share, supported by large-scale installations in China, India, and Australia, alongside favorable government policies and strong local supply chains. This regional leadership highlights Asia-Pacific’s critical role in shaping global onshore wind energy growth and investment trends.
 Market Insights
- The Onshore Wind Energy Market was valued at USD 131.38 billion in 2024 and is projected to reach USD 202.85 billion by 2032, growing at a CAGR of 5.58%.
- Rising demand for renewable energy, supportive government policies, and advancements in turbine technology act as key drivers, strengthening adoption across both developed and emerging economies.
- Increasing use of larger capacity turbines, integration with digital monitoring, and hybrid projects combining storage reflect major market trends shaping future deployment strategies.
- Intense competition among leading players such as Vestas, Siemens Gamesa, GE Vernova, and Goldwind pushes innovation, while challenges such as land acquisition issues and grid integration constraints restrain growth.
- Asia-Pacific leads with 34% share, followed by Europe with 32% and North America with 28%, while the 1 MW to 3 MW segment dominates with over 45% share, highlighting strong regional demand patterns and segment concentration in global market growth.
Access crucial information at unmatched prices!
Request your sample report today & start making informed decisions powered by Credence Research Inc.!
Download Sample
Market Segmentation Analysis:
By Axis
Horizontal axis wind turbines (HAWTs) dominate the onshore wind energy market with over 80% share. Their strong position stems from higher efficiency, advanced aerodynamic blade designs, and proven scalability in utility-scale projects. HAWTs generate higher output per unit and integrate easily with existing grid infrastructure, making them preferred for large-scale wind farms. Vertical axis wind turbines (VAWTs), while suitable for niche urban and low-wind applications, face limited adoption due to lower efficiency and higher maintenance costs. Continued innovation in HAWTs ensures their dominance in global onshore deployments.
- For instance, Goldwind manufactures a GWH171-6.25 is confirmed as a product offered by Goldwind. The rated power is 6,250 kW, which is equivalent to 6.25 MW. The rotor diameter for this model is 171 meters.
By Rating
The 1 MW to 3 MW segment leads the onshore wind energy market with over 45% share. This dominance is supported by widespread adoption in both developed and emerging markets, where turbines balance cost-effectiveness with strong power output. Developers favor this range as it offers high capacity factors, reduced levelized cost of energy, and compatibility with grid requirements. Turbines above 3 MW are gaining momentum in large-scale farms, while smaller ratings under 1 MW are mostly limited to distributed generation and rural electrification projects.
- For instance, Siemens Gamesa’s SG 3.2-129 onshore turbine delivers 3.2 MW rated power with a 129 m rotor diameter and a swept area of 13,070 m², offering a 10.3 % gain in annual energy production compared to its 2.3 MW predecessor.
By Component
The tower module holds the largest market share, exceeding 40%, in the onshore wind energy sector. Its dominance is driven by the critical role in turbine height, which directly impacts wind capture and energy efficiency. Advances in high-strength steel and hybrid concrete-steel designs have improved tower stability and reduced lifecycle costs. Taller towers enable access to stronger wind resources, making them essential for maximizing generation. While rotor and nacelle modules remain vital, the tower module’s cost contribution and technological importance secure its leadership in the component segment.
Key Growth Drivers
Rising Demand for Renewable Power
The global shift toward clean energy significantly drives onshore wind adoption. Governments are implementing strict emission reduction targets and phasing out fossil fuels, creating favorable policy frameworks. Incentives such as tax credits, feed-in tariffs, and renewable portfolio standards further accelerate deployment. Rising energy consumption in developing economies strengthens the demand for cost-efficient and sustainable power sources. Onshore wind, with its scalability and declining levelized cost of energy, emerges as a reliable solution to meet growing electricity needs while supporting decarbonization goals worldwide.
- For instance, Nordex has developed the N169/5.X turbine with a 169 m rotor diameter and a power rating up to 5.5 MW, designed for grid-constrained sites (company press).
Technological Advancements in Turbine Design
Continuous innovation in wind turbine technology boosts the efficiency and competitiveness of onshore wind farms. Larger rotor diameters, taller towers, and advanced blade aerodynamics allow turbines to capture more wind energy at lower speeds. Improved materials reduce maintenance needs and extend operational lifespans, lowering overall project costs. Digitalization, including AI-driven predictive maintenance and smart sensors, enhances asset performance. These advancements make onshore wind projects more viable in diverse geographies, improving investor confidence and driving sustained market growth across both developed and emerging regions.
- For instance, Envision’s two-blade onshore turbine prototype (Model X platform) has operated stably for over 500 days, achieving 99.3 % availability, a mean time between failures of 2,444 hours, and equivalent full-load hours of 3,048 per year.
Cost Competitiveness of Onshore Wind
Onshore wind energy has achieved strong cost competitiveness compared to fossil fuels and other renewables. Declining turbine prices, streamlined installation techniques, and economies of scale reduce capital and operating expenditures. Many countries report onshore wind as the cheapest form of new electricity generation, creating strong market appeal. Power purchase agreements (PPAs) from utilities and corporates further support demand by locking in long-term affordable electricity prices. This economic advantage positions onshore wind as a preferred choice for large-scale and decentralized energy projects globally.
Key Trends & Opportunities
Integration with Energy Storage Systems
The combination of onshore wind farms with advanced battery storage systems presents a key trend shaping the sector. Energy storage solutions help address intermittency challenges by balancing supply during fluctuating wind conditions. Developers are increasingly pairing wind projects with lithium-ion and flow batteries to enhance grid reliability. This trend creates opportunities for hybrid renewable energy plants, offering flexible and stable electricity supply. Governments promoting grid modernization further encourage investment in wind-plus-storage projects, reinforcing the role of onshore wind in supporting resilient energy systems.
- For instance, GE’s Reservoir energy storage solution includes battery modules that extend usable battery life by up to 15 % using its Blade Protection Unit.
Emerging Markets Expansion
Rapid expansion in emerging economies offers a major opportunity for the onshore wind market. Nations in Asia, Africa, and Latin America are investing heavily in renewable infrastructure to reduce dependence on imported fossil fuels. Abundant wind resources in rural and coastal areas, combined with falling turbine costs, make these regions attractive for large-scale projects. International investors and developers are entering partnerships to build capacity, supported by favorable government policies. This expansion unlocks long-term growth prospects and diversifies the global onshore wind energy landscape.
- For instance, the EW8.X-230 offshore turbine features a 230 m rotor diameter, uses carbon-fiber 100 m blades, and can generate 28 million kWh annually under 7.5 m/s average wind speed.
Key Challenges
Land Use and Environmental Concerns
Onshore wind projects often face challenges related to land acquisition and environmental impacts. Large-scale farms require significant land, leading to conflicts with agriculture, forestry, or conservation areas. Noise, visual impacts, and potential effects on local wildlife create resistance among communities. Delays in permitting and legal disputes increase project timelines and costs. Balancing renewable energy development with environmental sustainability and social acceptance remains a critical challenge for developers and policymakers in advancing onshore wind deployment.
Grid Integration and Infrastructure Limitations
Integrating large-scale onshore wind power into existing grids presents technical and economic challenges. Many transmission networks lack the capacity to handle variable wind output, leading to curtailment issues. Building new grid infrastructure is capital-intensive and often delayed by regulatory or land-rights barriers. In regions with weak or outdated grids, renewable integration becomes even more complex. Without significant investments in grid modernization, digital monitoring, and flexible backup systems, the full potential of onshore wind energy cannot be realized.
Regional Analysis
North America
North America holds a 28% share of the onshore wind energy market, driven by strong government incentives and rising corporate power purchase agreements. The United States leads the region, supported by production tax credits, favorable state policies, and large-scale capacity additions across Texas, Iowa, and Oklahoma. Canada also contributes with projects expanding in Alberta and Saskatchewan. Grid modernization initiatives and investments in repowering aging wind farms further enhance efficiency and output. The region’s established manufacturing base, technological innovations, and strong investor confidence position North America as a key growth hub for the onshore wind energy sector.
Europe
Europe accounts for 32% of the onshore wind energy market, maintaining its lead through ambitious renewable energy targets. Germany, Spain, and the United Kingdom represent the largest contributors, supported by well-developed grid infrastructure and consistent regulatory frameworks. The European Union’s commitment to carbon neutrality by 2050 drives continuous investment in wind energy projects. Repowering initiatives and adoption of advanced turbine technologies improve capacity factors. However, challenges like permitting delays and land availability create constraints. Despite this, Europe remains a leader in technology innovation, policy support, and cross-border energy integration, ensuring sustained dominance in the global wind energy landscape.
Asia-Pacific
Asia-Pacific commands a 34% share of the onshore wind energy market, emerging as the largest regional contributor. China dominates with significant capacity additions and large-scale manufacturing capabilities, while India and Australia follow with strong government-backed renewable programs. Rapid urbanization and rising electricity demand push nations toward sustainable energy options, making wind a key priority. Lower turbine costs and local supply chain development further strengthen adoption. Supportive policies, coupled with strong investment flows, accelerate deployment across rural and coastal areas. Asia-Pacific’s vast wind resource potential ensures it remains the fastest-growing region in global onshore wind energy deployment.
Latin America
Latin America captures an 8% share of the onshore wind energy market, led by Brazil, Mexico, and Chile. Brazil dominates with its abundant wind resources in the northeast and supportive auction-based procurement policies. Mexico and Chile are expanding renewable portfolios, aided by strong international investments and declining turbine costs. The region benefits from rising energy demand, favorable wind conditions, and growing interest in diversifying energy mixes. However, regulatory uncertainties and political instability in certain markets create risks. Despite these challenges, Latin America continues to attract investors, positioning itself as an emerging hotspot for onshore wind projects.
Middle East & Africa
The Middle East & Africa region holds a 6% share of the onshore wind energy market, supported by growing diversification efforts away from fossil fuel dependency. South Africa leads with strong renewable programs, while countries like Morocco, Egypt, and Saudi Arabia are scaling up investments in large-scale wind farms. Abundant wind potential across coastal and desert areas strengthens project viability. Government-backed initiatives and partnerships with international developers encourage deployment. However, limited grid infrastructure and financing challenges slow progress. As nations prioritize sustainable energy security, the region is expected to witness steady growth in onshore wind adoption.
Market Segmentations:
By Axis:
- Horizontal [HAWTs]
- Vertical [VAWTs]
By Rating:
- 500 kW to 1 MW
- 1 MW to 3 MW
By Component:
- Rotor Module
- Nacelle Module
By Geography
- North America
- Europe
- UK
- France
- Germany
- Italy
- Spain
- Russia
- Belgium
- Netherlands
- Austria
- Sweden
- Poland
- Denmark
- Switzerland
- Rest of Europe
- Asia Pacific
- China
- Japan
- South Korea
- India
- Australia
- Thailand
- Indonesia
- Vietnam
- Malaysia
- Philippines
- Taiwan
- Rest of Asia Pacific
- Latin America
- Brazil
- Argentina
- Peru
- Chile
- Colombia
- Rest of Latin America
- Middle East
- UAE
- KSA
- Israel
- Turkey
- Iran
- Rest of Middle East
- Africa
- Egypt
- Nigeria
- Algeria
- Morocco
- Rest of Africa
Competitive Landscape
The onshore wind energy market is highly competitive, with key players including Goldwind, Siemens Gamesa Renewable Energy, Nordex Group, Envision Energy, GE Vernova, Senvion, Mingyang Smart Energy, Vestas, Shanghai Electric, and Hitachi Energy. The onshore wind energy market is marked by strong competition, driven by rapid technological innovation, cost optimization, and global project expansion. Companies in the sector focus on developing larger, more efficient turbines with advanced rotor designs, taller towers, and digitalized monitoring systems to enhance performance. Strategic partnerships and cross-border collaborations are increasingly shaping market dynamics, particularly in emerging regions with high wind resource potential. Supply chain optimization, sustainability in manufacturing, and integration with grid infrastructure remain central priorities. Intense competition pushes stakeholders to differentiate through innovation, reliability, and long-term service capabilities, ensuring continued growth in the global market.
Shape Your Report to Specific Countries or Regions & Enjoy 30% Off!
Key Player Analysis
- Goldwind
- Siemens Gamesa Renewable Energy
- Nordex Group
- Envision Energy
- GE Vernova
- Senvion
- Mingyang Smart Energy
- Vestas
- Shanghai Electric
- Hitachi Energy
Recent Developments
- In July 2025, Britain launched its first-ever onshore wind strategy to enhance renewable power capacity and jobs in the sector. Britain has announced its commitment to largely decarbonise its electricity sector by 2030 under the efforts to meet its climate goals and enhance energy security, and reduce the cost of power.
- In July 2025, Germany announced the launch of its third onshore wind power auction of 2025, to secure 3.44 GW of new capacity. The Federal Network Agency (BNetzA) announced that developers must submit their bids by August 1, 2025.
- In January 2025, Vestas received a 384 MW order for the second phase of DTEK’s Tyligulska project in Ukraine. This adds to the 114 MW Tyligulska I order which the company successfully commissioned in the spring of 2023. The company will supply 64 wind turbines and is responsible for the supply, delivery, and commissioning of the turbines.
- In July 2024, Iberdrola began with initial construction work on a wind farm in the northern Spain. The El Escudo wind farm will have a capacity of 101 MW and will generate energy equivalent to the annual consumption of 95,300 homes, thereby avoiding emission of 45,000 tonnes of CO2 per year.
Report Coverage
The research report offers an in-depth analysis based on Axis, Component, Rating and Geography. It details leading market players, providing an overview of their business, product offerings, investments, revenue streams, and key applications. Additionally, the report includes insights into the competitive environment, SWOT analysis, current market trends, as well as the primary drivers and constraints. Furthermore, it discusses various factors that have driven market expansion in recent years. The report also explores market dynamics, regulatory scenarios, and technological advancements that are shaping the industry. It assesses the impact of external factors and global economic changes on market growth. Lastly, it provides strategic recommendations for new entrants and established companies to navigate the complexities of the market.
Future Outlook
- Onshore wind capacity will expand as nations accelerate renewable energy transitions.
- Larger turbines with taller towers will boost efficiency and reduce costs.
- Digital technologies will enhance predictive maintenance and asset performance.
- Hybrid projects combining wind with solar and storage will gain momentum.
- Emerging markets will drive significant demand with new large-scale installations.
- Repowering of aging wind farms will create fresh investment opportunities.
- Grid modernization will improve integration and reduce curtailment risks.
- Corporate power purchase agreements will strengthen demand for clean electricity.
- Sustainable manufacturing practices will shape future turbine supply chains.
- Supportive policies and carbon neutrality targets will sustain long-term growth.


