
Market Overview
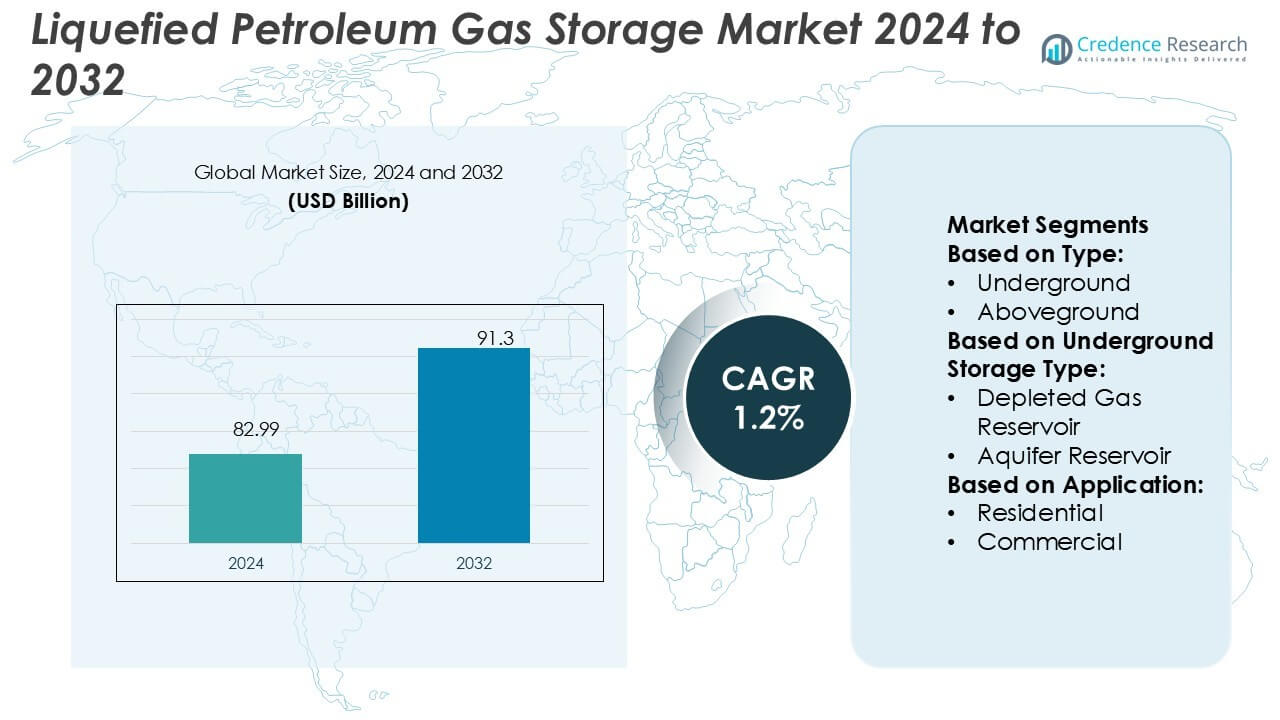
Liquefied Petroleum Gas Storage Market size was valued USD 82.99 billion in 2024 and is anticipated to reach USD 91.3 billion by 2032, at a CAGR of 1.2% during the forecast period.
| REPORT ATTRIBUTE | DETAILS |
|---|---|
| Historical Period | 2020-2023 |
| Base Year | 2024 |
| Forecast Period | 2025-2032 |
| Liquefied Petroleum Gas Storage Market Size 2024 | USD 82.99 Billion |
| Liquefied Petroleum Gas Storage Market, CAGR | 1.2% |
| Liquefied Petroleum Gas Storage Market Size 2032 | USD 91.3 Billion |
The Liquefied Petroleum Gas Storage Market is driven by leading players such as Emirates Gas, AmeriGas, Flogas, Pertamina, Modern Welding, Energy Transfer, China Petroleum, CLW Group, Omera, and CIMC ENRIC. These companies focus on expanding underground storage capacity, advancing salt cavern solutions, and integrating digital monitoring systems to ensure safety and efficiency. Strategic initiatives include strengthening supply chains, investing in modular storage, and enhancing regional distribution networks. Asia-Pacific emerges as the leading region, commanding 34% market share, supported by strong residential consumption in China and India, government-backed clean energy initiatives, and large-scale investments in underground facilities.
 Market Insights
- The Liquefied Petroleum Gas Storage Market size was USD 82.99 billion in 2024 and will reach USD 91.3 billion by 2032, registering a CAGR of 1.2%.
- Rising residential consumption, government subsidies, and clean energy transition programs drive steady demand, with underground storage accounting for over 55% of the market share.
- Key players focus on expanding salt cavern capacity, integrating digital monitoring systems, and strengthening supply chains to enhance operational efficiency and competitiveness.
- High infrastructure investment costs and stringent safety regulations act as restraints, limiting rapid adoption in some developing markets.
- Asia-Pacific leads with 34% market share, driven by strong household consumption in China and India, followed by North America at 27% and Europe at 22%, supported by large-scale underground reserves and modernization initiatives.
Market Segmentation Analysis:
By Type In the Liquefied Petroleum Gas Storage Market, underground storage dominates with a market share exceeding 55%. Underground facilities offer higher safety levels, better temperature stability, and larger storage capacity compared to aboveground and floating options. Salt caverns and depleted reservoirs enhance efficiency, enabling operators to manage seasonal demand shifts. Aboveground storage continues to serve smaller-scale commercial users due to lower construction costs, while floating storage finds niche applications in maritime trade. Rising energy demand, coupled with urbanization and industrial expansion, strengthens the preference for underground storage as the most secure and scalable option.
- For instance, AmeriGas a part of UGI Corporation, AmeriGas indeed operates a vast network. Recent UGI financial filings confirm a network of approximately 1,380 propane distribution locations serving customers across the United States.
By Underground Storage Type
Salt caverns hold the largest share of the underground storage segment, accounting for more than 40% of installations. Their natural sealing capacity, high withdrawal rates, and low operating costs make them attractive for long-term storage. Depleted gas reservoirs follow closely, leveraging existing infrastructure to reduce investment costs. Aquifer reservoirs are used selectively due to higher maintenance needs. The demand for salt caverns is driven by their ability to handle pressure variations efficiently, ensuring reliability in high-demand markets. Energy companies prioritize salt caverns for strategic reserves and peak-shaving purposes.
- For instance, Flogas expanded its Avonmouth facility with a 34,564-tonne LPG storage capacity, equipped with automated level gauging and advanced over-pressure protection systems, enabling secure supply management during seasonal peaks.
By Application
The residential sector leads with over 50% market share in the LPG storage market, fueled by growing consumption for cooking and heating. Expanding rural electrification and clean energy adoption programs in emerging economies accelerate demand. Commercial applications, including hospitality, restaurants, and small industries, form the second-largest segment, relying on consistent LPG supply for operations. The "Others" category, which includes agriculture and small-scale manufacturing, contributes modestly but is expanding steadily. Residential demand dominance is sustained by government subsidies, increasing household adoption, and the role of LPG as a reliable alternative to traditional fuels.
Key Growth Drivers
Rising Global Energy Demand and Residential Consumption
The Liquefied Petroleum Gas Storage Market is primarily driven by increasing residential demand for cooking and heating. Growing urbanization and rural electrification programs boost LPG adoption as a clean fuel alternative to coal and biomass. Government subsidies and distribution initiatives further support this expansion. Emerging economies, particularly in Asia-Pacific, are witnessing strong household penetration, creating consistent demand for storage infrastructure. The residential sector’s dominance, accounting for over 50% of LPG usage, positions it as a core growth driver shaping long-term market stability.
- For instance, Pertamina constructed two refrigerated LPG storage tanks of 44,000 metric tons each to support its Tuban terminal, along with two spherical tanks each of 2,500 metric tons capacity for mixed LPG.
Technological Advancements in Storage Infrastructure
The development of advanced underground storage solutions, particularly salt caverns, enhances capacity, safety, and efficiency. Salt caverns dominate due to their high sealing ability and pressure management, making them ideal for peak demand storage. Modern monitoring systems and digital automation also improve operational safety and reduce leakage risks. Infrastructure innovations lower operational costs and optimize inventory management, strengthening adoption by energy providers. These advancements not only support scalability but also position LPG storage as a critical enabler of energy security strategies across developed and developing economies.
- For instance, Modern Welding manufactures pressure vessels, including LPG tanks, for industrial use. While LPG vessels up to 120,000 gallons are available from various fabricators for large-scale industrial and wholesale purposes.
Government Policies and Strategic Reserves Expansion
Government initiatives to reduce reliance on traditional fuels and improve energy security significantly drive storage investments. Several countries mandate strategic petroleum reserves, including LPG, to ensure stability during supply disruptions. Subsidy frameworks, rural energy transition programs, and favorable licensing policies also encourage infrastructure growth. National oil companies and private players are investing in large-scale underground facilities for long-term resilience. This policy-driven expansion positions LPG storage as an essential component of national energy frameworks, further strengthening market outlook and attracting global investments in capacity development.
Key Trends & Opportunities
Shift Toward Underground Storage Dominance
Underground LPG storage, particularly in salt caverns, continues to gain share due to safety, scalability, and long-term reliability. Operators prefer these facilities for high withdrawal rates and lower maintenance costs compared to aboveground tanks. The shift is supported by rising urban energy demand and the need for stable supply management. This trend creates opportunities for infrastructure developers and technology providers specializing in advanced cavern engineering. Regional governments also promote underground reserves, reinforcing this transition and enabling sustainable growth in the global LPG storage market.
- For instance, CNPC’s pipeline & storage division reports it can design tanks of 150,000 m³ (cubic meters) and spherical tanks of 10,000 m³, with an annual construction capacity of 26 million m³ of tank volume.
Integration of Digital Monitoring and Automation
Digitalization is reshaping LPG storage operations, with advanced monitoring systems ensuring real-time safety, leakage detection, and inventory control. Automation reduces human error, increases operational efficiency, and enhances compliance with global safety standards. Remote monitoring capabilities enable predictive maintenance, lowering downtime and costs. This trend opens opportunities for technology providers offering IoT-enabled solutions and cloud-based management platforms. Energy companies adopting these digital innovations are well-positioned to meet stricter regulatory requirements and improve resilience, driving wider adoption across industrial and residential supply chains.
- For instance, Omera Petroleum's terminal at Mongla, Bangladesh, includes four LPG storage spheres of 4,000 m³ each, along with two propane spheres of 3,000 m³ each. Smaller bullet tanks are deployed across sites for distribution, and the entire system is managed via a SCADA platform for real-time monitoring and automated safety controls.
Key Challenges
High Initial Investment and Infrastructure Costs
Building LPG storage facilities, particularly underground salt caverns and large-scale aboveground tanks, requires significant capital investment. The costs include geological surveys, advanced engineering, and long construction timelines, making entry difficult for smaller operators. Developing economies often face financial constraints, slowing infrastructure expansion despite strong demand. High investment requirements can also delay project approvals and discourage private-sector participation. This challenge limits rapid capacity growth and creates regional disparities in storage availability, particularly in emerging markets where government funding may not fully bridge the gap.
Safety Concerns and Stringent Regulatory Compliance
LPG storage involves inherent risks, including fire hazards, leakage, and environmental damage, requiring strict adherence to safety standards. Governments impose rigorous regulations on design, construction, and operations, which raise compliance costs for operators. Any failure to meet safety norms can lead to operational shutdowns, penalties, or reputational damage. Frequent inspections and monitoring requirements further increase operational expenses. While essential for public safety, these regulations present operational challenges, particularly for smaller players lacking advanced monitoring systems. Safety concerns remain a major barrier to seamless expansion of LPG storage infrastructure.
Regional Analysis
North America
North America accounts for 27% share of the Liquefied Petroleum Gas Storage Market, supported by strong residential and industrial demand. The United States leads with extensive underground storage infrastructure, particularly salt caverns used for strategic reserves. Rising shale gas production and government initiatives for energy security further drive capacity expansion. Canada also contributes with investments in aboveground tanks catering to commercial and industrial sectors. The region benefits from advanced monitoring systems and favorable regulatory frameworks. Strong demand stability, coupled with infrastructure modernization, ensures North America’s position as a key market for LPG storage growth.
Europe
Europe holds 22% market share, driven by rising residential heating needs and clean energy adoption. Germany, France, and the UK lead in storage infrastructure, with underground facilities favored for safety and reliability. The European Union’s energy diversification policies and emphasis on reducing coal dependency boost LPG adoption. Seasonal demand fluctuations, particularly during winters, increase reliance on large-scale reserves. Infrastructure modernization with digital monitoring systems enhances safety compliance across member states. Strategic investments in salt caverns and cross-border pipeline connectivity further support Europe’s growth, reinforcing its role as a vital regional market for LPG storage expansion.
Asia-Pacific
Asia-Pacific dominates the global LPG storage market with 34% share, driven by high population growth and rapid urbanization. China and India lead the region with strong residential consumption supported by government subsidies and rural electrification programs. Japan and South Korea emphasize underground storage for energy security, investing in salt cavern facilities. Expanding industrial and commercial applications also fuel demand. Favorable policies promoting clean fuel alternatives boost adoption across emerging economies. With growing demand for strategic reserves, Asia-Pacific continues to attract large-scale investments in underground and aboveground storage, strengthening its leadership in the global LPG storage market.
Latin America
Latin America captures 10% share of the LPG storage market, primarily driven by increasing household adoption in Brazil and Mexico. Rising urbanization and government initiatives promoting clean cooking fuel contribute significantly to growth. Aboveground storage dominates in several countries due to lower setup costs, though underground facilities are gradually expanding. Industrial and commercial usage in the hospitality and agriculture sectors also adds to demand. Infrastructure investments remain concentrated in major urban centers, creating opportunities for regional developers. Supportive energy transition policies and improving supply chains reinforce Latin America’s growth potential in the LPG storage market.
Middle East & Africa
The Middle East & Africa region holds a 7% share of the LPG storage market, supported by abundant hydrocarbon reserves and rising domestic consumption. The Middle East dominates with large-scale underground and aboveground facilities, primarily serving both domestic use and export logistics. Africa shows steady growth, led by Nigeria and South Africa, where LPG adoption is expanding in residential and commercial sectors. Investments in floating storage also support maritime trade in the region. Despite infrastructure gaps in rural areas, supportive government programs and rising energy demand continue to enhance the role of this region in global LPG storage.
Market Segmentations:
By Type:
- Underground
- Aboveground
By Underground Storage Type:
- Depleted Gas Reservoir
- Aquifer Reservoir
By Application:
- Residential
- Commercial
By Geography
- North America
- Europe
- Asia Pacific
- Latin America
- Middle East
- Africa
Competitive Landscape
The competitive landscape of the Liquefied Petroleum Gas Storage Market players such as Emirates Gas, AmeriGas, Flogas, Pertamina, Modern Welding, Energy Transfer, China Petroleum, CLW Group, Omera, and CIMC ENRIC. The Liquefied Petroleum Gas Storage Market is defined by continuous investments in capacity expansion, technological innovation, and regulatory compliance. Companies focus on developing underground storage solutions, particularly salt caverns, due to their efficiency, scalability, and safety advantages. Advancements in digital monitoring, automation, and predictive maintenance systems enhance operational reliability while reducing risks associated with leakage and fire hazards. Market participants also prioritize sustainable solutions, such as energy-efficient equipment and eco-friendly construction materials, to align with global environmental standards. Strategic collaborations, mergers, and government-backed projects further strengthen competitiveness, enabling operators to meet rising global demand for secure and reliable LPG storage infrastructure.
Key Player Analysis
- Emirates Gas
- AmeriGas
- Flogas
- Pertamina
- Modern Welding
- Energy Transfer
- China Petroleum
- CLW Group
- Omera
- CIMC ENRIC
Recent Developments
- In April 2025, Pune Gas launched the Pune Gas Experience Centre in Hyderabad which is Telangana’s first experience centre dedicated for commercial and industrial LPG and Natural Gas systems and solutions.
- In March 2025, Hero Future Energies (HFE), a developer of renewable energy and a subsidiary of the Hero Group, launched a green hydrogen plant in Tirupati, Andhra Pradesh which cater to Rockman Industries, a Hero Group company.
- In December 2024, World Liquid Gas Association (WLGA) launched a new roadmap, LPG Roadmap for Africa to increase availability of liquefied petroleum gas (LPG) across Africa providing expanded access to clean cooking solutions.
- In January 2024, Williams completed the acquisition of natural gas storage assets by from Hartree Partners LP's affiliate. The purchased assets comprise six underground storage facilities across Louisiana and Mississippi, offering 115 billion cubic feet of storage capacity.
Report Coverage
The research report offers an in-depth analysis based on Type, Underground Storage Type, Application and Geography. It details leading market players, providing an overview of their business, product offerings, investments, revenue streams, and key applications. Additionally, the report includes insights into the competitive environment, SWOT analysis, current market trends, as well as the primary drivers and constraints. Furthermore, it discusses various factors that have driven market expansion in recent years. The report also explores market dynamics, regulatory scenarios, and technological advancements that are shaping the industry. It assesses the impact of external factors and global economic changes on market growth. Lastly, it provides strategic recommendations for new entrants and established companies to navigate the complexities of the market.
Future Outlook
- The market will witness growing adoption of underground storage for safety and scalability.
- Salt caverns will remain the preferred choice due to efficiency and cost advantages.
- Digital monitoring and automation will enhance operational reliability and reduce risks.
- Residential demand will continue to dominate with strong government subsidy support.
- Strategic reserves will expand as countries strengthen energy security frameworks.
- Emerging economies will drive storage infrastructure growth with rapid urbanization.
- Aboveground tanks will serve small-scale commercial and industrial applications.
- Investments in modular and mobile storage solutions will increase in developing markets.
- Regulatory compliance and safety standards will shape technology adoption across regions.
- Global players will pursue partnerships and regional expansions to strengthen competitiveness.

Request a Free Sample
Fill in your details and we'll send you a free sample report.
- Sample data tables & charts
- Research methodology
Need a Custom Version of This Report?
Tailor the scope, geography, or segments to your exact requirements.
- Custom geography or segment scope
- Direct access to our analyst team
Frequently Asked Questions
What is the current market size for Liquefied Petroleum Gas Storage Market, and what is its projected size in 2032?
At what Compound Annual Growth Rate is the Liquefied Petroleum Gas Storage Market projected to grow between 2025 and 2032?
Which Liquefied Petroleum Gas Storage Market segment held the largest share in 2024?
What are the primary factors fueling the growth of the Liquefied Petroleum Gas Storage Market?
Who are the leading companies in the Liquefied Petroleum Gas Storage Market?
Which region commanded the largest share of the Liquefied Petroleum Gas Storage Market in 2024?
Table of Content
Chapter 1. Report Introduction
- 1.1 Report Description & Purpose
- 1.1.1 Report Title & Market Definition
- 1.1.2 Unique Selling Propositions (USP) & Key Differentiators
- 1.1.3 Value Proposition for Stakeholders
- 1.2 Research Objectives
- 1.2.1 Market Sizing Objectives (Volume & Revenue) (Volume Where Applicable)
- 1.2.2 Segmentation Objectives
- 1.2.3 Competitive Intelligence Objectives
- 1.2.4 Forecast & Scenario Objectives
- 1.3 Report Scope
- 1.3.1 Liquefied Petroleum Gas Storage Scope – Segments & Subsegments Covered
- 1.3.2 Geographic Scope – Regions & Countries Covered
- 1.3.3 Historical Period, Base Year & Forecast Period (2024; forecast to 2032)
- 1.3.4 Inclusions & Exclusions
- 1.4 Industry Classification & Applicable Codes
- 1.5 Currency, Measurement Units & Valuation Basis
- 1.6 Target Stakeholders
- 1.7 Limitations & Assumptions
Chapter 2. Executive Summary
- 2.1 Global Liquefied Petroleum Gas Storage Market Snapshot
- 2.1.1 Market Size – Historical (2024) & Forecast (2024-2032) (2024: USD 82.99 billion → 2032: USD 91.3 billion)
- 2.1.2 Volume & Revenue – Global Totals (Volume Where Applicable)
- 2.1.3 Key Market Highlights – Top Five Facts
- 2.2 Liquefied Petroleum Gas Storage Market Segmentation Snapshot
- 2.2.1 Market Split by Region – 2024 vs. 2032
- 2.3 Competitive Snapshot
- 2.3.1 Top 10 Players by Revenue Share – 2024
- 2.3.2 Top 10 Players by Volume Share – 2024 (Volume Where Applicable)
- 2.3.3 Recent Strategic Developments (18-Month Summary)
- 2.4 Key Investment Highlights & Strategic Conclusions
Chapter 3. Liquefied Petroleum Gas Storage Market Dynamics & Industry Analysis
- 3.1 Market Overview & Context
- 3.1.1 Liquefied Petroleum Gas Storage Market Position in the Broader Industry Value Chain
- 3.1.2 Demand Structure & Purchasing Dynamics
- 3.1.3 Market Maturity & Development Stage by Region
- 3.2 Liquefied Petroleum Gas Storage Market Drivers
- 3.3 Liquefied Petroleum Gas Storage Market Restraints & Challenges
- 3.4 Liquefied Petroleum Gas Storage Market Opportunities
- 3.5 Porter's Five Forces Analysis
- 3.5.1 Threat of New Entrants
- 3.5.2 Bargaining Power of Suppliers
- 3.5.3 Bargaining Power of Buyers
- 3.5.4 Threat of Substitutes
- 3.5.5 Competitive Rivalry – Intensity Assessment
- 3.6 Liquefied Petroleum Gas Storage Value Chain Analysis
- 3.6.1 Upstream – Key Inputs, Resources & Suppliers
- 3.6.1.1 Key Input/Resource 1
- 3.6.1.2 Key Input/Resource 2
- 3.6.1.3 Key Input/Resource 3
- 3.6.2 Midstream – Core Operations & Value Creation
- 3.6.2.1 Operating Model & Process Overview
- 3.6.2.2 Key Operating Locations & Capabilities by Company
- 3.6.3 Downstream – Market Channels & End Users
- 3.6.3.1 Direct Sales & Customer Engagement Channels
- 3.6.3.2 Indirect Sales, Intermediaries & Partner Channels
- 3.6.4 Value Chain Profitability Analysis
- 3.6.1 Upstream – Key Inputs, Resources & Suppliers
- 3.7 PESTEL Analysis
- 3.7.1 Political Factors
- 3.7.2 Economic Factors
- 3.7.3 Social Factors
- 3.7.4 Technological Factors
- 3.7.5 Environmental Factors
- 3.7.6 Legal Factors
- 3.8 Liquefied Petroleum Gas Storage Supply Chain Analysis
- 3.8.1 Critical Input & Resource Availability Risk Assessment
- 3.8.2 Supplier & Operational Concentration Risk (Geographic Exposure)
- 3.8.3 Supply & Service Disruption Impact Analysis
- 3.9 Regulatory & Policy Landscape
Note: The regulatory and policy landscape section covers regulations based on their applicability to the market, Liquefied Petroleum Gas Storage category, geography, and scope of the study. Only regulatory frameworks with a material impact on operations, compliance, trade, sustainability, or market access are analyzed in detail.
Chapter 4. Key Investment Pockets & Opportunity Analysis
- 4.1 Liquefied Petroleum Gas Storage Market Attractiveness Analysis
- 4.1.1 By Region – Investment Attractiveness Matrix (Market Size × CAGR)
- 4.2 Absolute Revenue Growth Opportunity
- 4.2.1 By Region – Absolute Revenue Growth Through 2032
- 4.3 Incremental Demand Opportunity
- 4.3.1 By Region – Incremental Demand Through 2032
- 4.3.2 Segment – Incremental Demand
- 4.4 Emerging Submarket Opportunity Deep Dive (Subject to Applicability)
- 4.5 Priority Market Opportunity Scorecards
- 4.5.1 United States
- 4.5.2 Europe
- 4.5.3 Asia
- 4.5.4 Middle East & Africa
Note: Priority market opportunity scorecards reflect the geographic scope and strategic relevance of the study. Listed markets are indicative and may be adapted to the industry.
Chapter 5. Liquefied Petroleum Gas Storage Cross-Border Trade & Market Access Analysis
- 5.1 International Trade & Cross-Border Activity Overview
- 5.1.1 Global Export Value by Country (2024)
- 5.1.2 Global Export Volume by Country (2024) (Volume Where Applicable)
- 5.1.3 Global Import Value by Country (2024)
- 5.1.4 Global Import Volume by Country (2024) (Volume Where Applicable)
- 5.1.5 Net Trade Balance by Country (2024)
- 5.2 Export Analysis – Segment
- 5.2.1 Category 1 (Applicable Classification Code)
- 5.2.2 Category 2 (Applicable Classification Code)
- 5.2.3 Category 3 (Applicable Classification Code)
- 5.2.4 Category 4 (Applicable Classification Code)
- 5.2.5 Category 5 (Applicable Classification Code)
- 5.3 Import Analysis – Segment
- 5.3.1 Category 1 (Applicable Classification Code)
- 5.3.2 Category 2 (Applicable Classification Code)
- 5.3.3 Category 3 (Applicable Classification Code)
- 5.3.4 Category 4 (Applicable Classification Code)
- 5.3.5 Category 5 (Applicable Classification Code)
- 5.4 Cross-Border Pricing & Transaction Benchmarks
- 5.4.1 Export Pricing – Segment & Country
- 5.4.2 Import Pricing – Segment & Source Country
- 5.4.3 Price Trends (2024)
- 5.5 Key Cross-Border Trade & Delivery Routes
- 5.5.1 Cross-Border Trade/Delivery Route 1
- 5.5.2 Cross-Border Trade/Delivery Route 2
- 5.5.3 Cross-Border Trade/Delivery Route 3
- 5.5.4 Cross-Border Trade/Delivery Route 4
- 5.5.5 Cross-Border Trade/Delivery Route 5
- 5.6 Trade Policy & Market Access Impact Assessment
- 5.6.1 Tariff & Non-Tariff Barriers
- 5.6.2 Regional Trade & Economic Integration Frameworks
- 5.6.3 Bilateral & Multilateral Trade Agreements
- 5.6.4 Cross-Border Operating, Licensing & Localization Requirements
Note: This chapter applies where cross-border trade or delivery is relevant to Liquefied Petroleum Gas Storage. Goods, services, and digital offerings are assessed using applicable classifications and transaction measures. Import-export volumes, trade balances, and route analyses are included only where meaningful to the market.
Chapter 6. Competitive Landscape & Company Benchmarking
- 6.1 Liquefied Petroleum Gas Storage Market Concentration & Structure
- 6.1.1 Herfindahl-Hirschman Index (HHI) – vs. 2024
- 6.1.2 Leading, Mid-Sized & Emerging Player Structure
- 6.1.3 Global, Regional & Local Player Dynamics
- 6.2 Liquefied Petroleum Gas Storage Market Share Analysis – 2024
- 6.2.1 Global Revenue Share by Company
- 6.2.2 Global Volume Share by Company (Volume Where Applicable)
- 6.2.3 Regional Revenue Share
- 6.2.4 Market Share Evolution ( vs. 2024)
- 6.2.5 Company Market Share by Key Segment
- 6.2.6 Company Market Share by Customer Group
- 6.3 Operating Scale, Capacity & Infrastructure Analysis
- 6.3.1 Global Operating Scale & Supply Capacity
- 6.3.2 Resource Utilization & Operating Efficiency
- 6.3.3 Output, Service Delivery & Activity Metrics
- 6.3.4 Operating Footprint & Infrastructure Map
- 6.3.5 Planned Operational & Capacity Expansion
- 6.4 Liquefied Petroleum Gas Storage Competitive Benchmarking Matrix
- 6.4.1 Revenue, Growth, Profitability & Operating Metric Comparison
- 6.4.2 Channel Revenue Mix
- 6.4.3 Geographic Revenue Exposure
- 6.4.4 R&D Intensity
- 6.4.5 Sustainability Maturity
- 6.5 Strategic Developments in Liquefied Petroleum Gas Storage (Last 24 Months)
- 6.5.1 Mergers, Acquisitions & Divestments
- 6.5.2 New Products, Services & Solutions in Liquefied Petroleum Gas Storage
- 6.5.3 Operational & Infrastructure Expansions
- 6.5.4 Strategic Alliances, Joint Ventures & Partnerships
- 6.5.5 Distribution Expansion & Market Entry
- 6.5.6 Sustainability & ESG Initiatives
- 6.6 Competitive Strategy Mapping
- 6.6.1 Leader, Challenger, Follower & Niche Classification
- 6.6.2 Pricing Strategy Comparison
- 6.6.3 Channel Strategy Matrix
Note: Strategic developments are included based on their materiality and the availability of reliable information.
Chapter 7. Global Liquefied Petroleum Gas Storage Market – By Sales & Delivery Channel
- 7.1 Segment Overview
- 7.1.1 Volume & Revenue Split by Channel (2024 & 2032) (Volume Where Applicable)
- 7.1.2 Channel Mix Evolution (2024-2032)
Chapter 8. Regional Market Analysis – Global Overview
- 8.1 Global Regional Overview
- 8.1.1 Regional Volume Share (Volume Where Applicable)
- 8.1.2 Regional Revenue Share
- 8.1.3 Regional Volume by Region (Volume Where Applicable)
- 8.1.4 Regional Revenue by Region
- 8.1.5 Regional Forecast Through 2032
- 8.2 Cross-Regional Segment Analysis
- 8.2.1 By Sales & Delivery Channel
- 8.2.2 By Competitive Positioning & Price Tier
Chapter 9. North America Liquefied Petroleum Gas Storage Market
- 9.1 United States
- 9.2 Canada
- 9.3 Mexico
Chapter 10. Europe Liquefied Petroleum Gas Storage Market
- 10.1 Germany
- 10.2 France
- 10.3 Italy
- 10.4 United Kingdom
- 10.5 Spain
- 10.6 Poland
- 10.7 Russia
- 10.8 Netherlands
- 10.9 Belgium
- 10.10 Sweden
- 10.11 Denmark
- 10.12 Norway
- 10.13 Rest of Europe
Chapter 11. Asia Pacific Liquefied Petroleum Gas Storage Market
- 11.1 China
- 11.2 India
- 11.3 Japan
- 11.4 South Korea
- 11.5 Thailand
- 11.6 Indonesia
- 11.7 Vietnam
- 11.8 Malaysia
- 11.9 Australia
- 11.10 Rest of Asia Pacific
Chapter 12. Latin America Liquefied Petroleum Gas Storage Market
- 12.1 Brazil
- 12.2 Argentina
- 12.3 Colombia
- 12.4 Chile
- 12.5 Rest of Latin America
Chapter 13. Middle East Liquefied Petroleum Gas Storage Market
- 13.1 Saudi Arabia
- 13.2 United Arab Emirates
- 13.3 Turkey
- 13.4 Israel
- 13.5 Iran
- 13.6 Rest of the Middle East
Chapter 14. Africa Liquefied Petroleum Gas Storage Market
- 14.1 South Africa
- 14.2 Egypt
- 14.3 Nigeria
- 14.4 Morocco
- 14.5 Rest of Africa
Chapter 15. Liquefied Petroleum Gas Storage Company Profiles
- 15.1 [Company 01]
- 15.1.1 Company Overview
- 15.1.2 Key Management Personnel
- 15.1.3 Products & Services Portfolio
- 15.1.4 Financial Performance
- 15.1.5 Key Market Focus & Geographic Presence
- 15.1.6 Recent Developments & Strategic Initiatives
Note: The company profile list is preliminary and may change based on research findings, market developments, data availability, and client requirements.
Chapter 16. Appendices
- Appendix A – List of Abbreviations & Acronyms
- Appendix B – Industry Classification Code Reference – Full Series
- Appendix C – Supply, Output & Operating Capacity Data Tables
- Appendix D – End-Use & Demand Base Tables
- Appendix E – Demand, Adoption & Usage Assumptions
- Appendix F – Pricing & Revenue Metric Reference Tables
- Appendix G – Company Operations & Infrastructure Database
- Appendix H – Cross-Border Trade & Activity Data Tables (Where Applicable)
- Appendix I – Regulatory Summary Tables
- Appendix J – Primary Research Participant List (Anonymized)
- Appendix K – Primary Research Questionnaire Framework
- Appendix L – Data Sources & Bibliography
- Appendix M – Market Size Divergence & Source Comparison
Chapter 17. Research Methodology
- 17.1 Research Framework & Philosophy
- 17.2 Secondary Research – Sources, Hierarchy & Data Extraction
- 17.3 Data Modeling – Bottom-Up & Top-Down Market Sizing
- 17.4 Primary Research – Stakeholder Framework, LOI & Sample Sizes
- 17.5 Forecast Methodology – Regression, Scenario & Sensitivity Analysis
- 17.6 Quality Control – Four-Layer Validation Framework
- 17.7 Limitations & Standard Assumptions
- 17.8 Disclaimer
