Market Overview
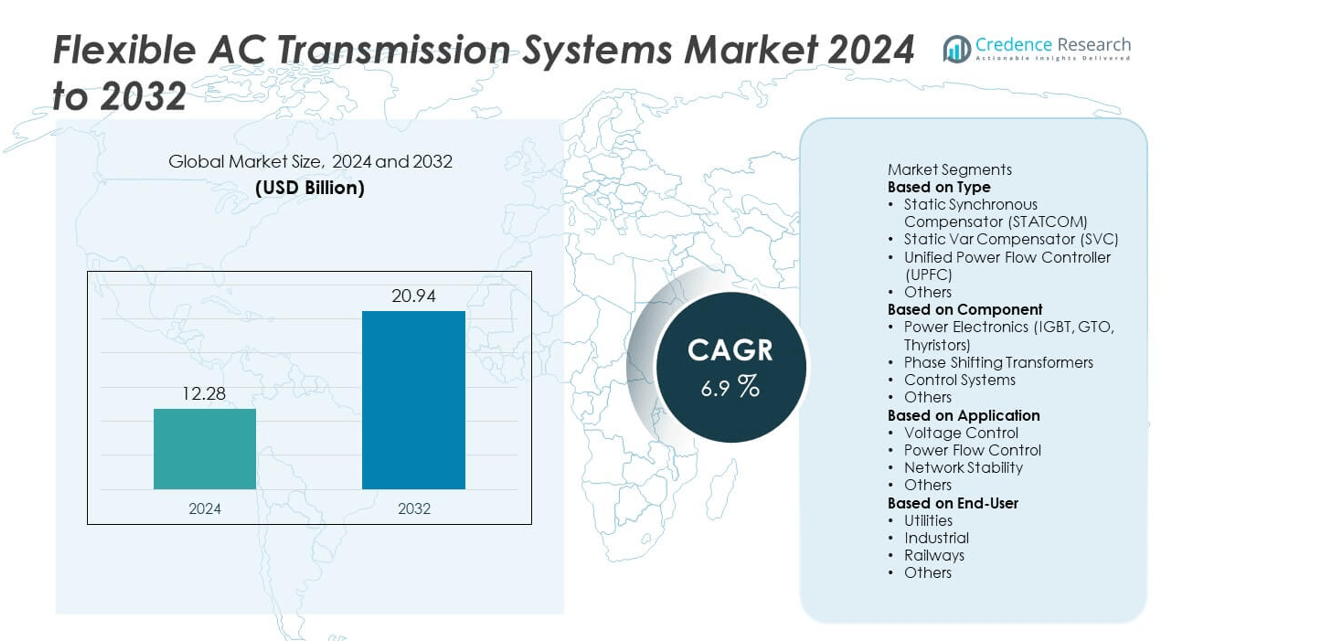
The global flexible AC transmission systems market was valued at USD 12.28 billion in 2024 and is projected to reach USD 20.94 billion by 2032, growing at a CAGR of 6.9% during the forecast period.
| REPORT ATTRIBUTE |
DETAILS |
| Historical Period |
2020-2023 |
| Base Year |
2024 |
| Forecast Period |
2025-2032 |
| Flexible AC Transmission Systems Market Size 2024 |
USD 12.28 billion |
| Flexible AC Transmission Systems Market, CAGR |
6.9% |
| Flexible AC Transmission Systems Market Size 2032 |
USD 20.94 billion |
The flexible AC transmission systems market is led by top players including Ingeteam, NR Electric, Siemens, General Electric, Infineon, Hyosung, Mitsubishi, ABB, Rongxin, and BHEL. These companies drive growth through advanced FACTS technologies such as STATCOM and SVC, strong regional partnerships, and continuous innovation in power electronics. Regionally, North America held the largest share at 33% in 2024, supported by modern grid infrastructure and renewable integration projects. Europe followed with 28% share, driven by cross-border interconnections and regulatory support for renewable energy. Asia-Pacific accounted for 26% share, emerging as the fastest-growing region due to large-scale investments in transmission upgrades and expanding renewable capacity in China and India.
Market Insights
- The global flexible AC transmission systems market was valued at USD 12.28 billion in 2024 and is projected to reach USD 20.94 billion by 2032, growing at a CAGR of 6.9% during the forecast period.
- Rising demand for grid reliability and renewable energy integration drives market expansion, with STATCOM leading the type segment at 38% share due to its superior efficiency and dynamic voltage regulation.
- Key trends include advancements in power electronics, digital integration with smart grids, and growing deployment of FACTS devices to stabilize renewable-heavy networks.
- Leading companies such as Siemens, ABB, General Electric, Mitsubishi, and NR Electric focus on technology innovation, partnerships, and large-scale infrastructure projects, while high installation costs and integration challenges remain major restraints.
- Regionally, North America leads with 33% share, Europe follows with 28%, and Asia-Pacific holds 26% driven by rapid renewable integration, while Latin America (7%) and Middle East & Africa (6%) show steady adoption.
Access crucial information at unmatched prices!
Request your sample report today & start making informed decisions powered by Credence Research Inc.!
Download Sample
Market Segmentation Analysis:
By Type
In 2024, Static Synchronous Compensator (STATCOM) accounted for 38% share, making it the dominant segment in the market. Its leadership is driven by superior dynamic voltage regulation, rapid response time, and higher efficiency compared to traditional systems. STATCOMs are widely deployed in renewable energy integration projects and industrial applications where stability and power quality are critical. Static Var Compensators (SVCs) follow with significant adoption, particularly in transmission networks requiring cost-effective reactive power compensation. However, STATCOM remains the preferred choice due to its advanced performance and ability to support modern grid requirements.
- For instance, NR Electric has commissioned large-capacity STATCOMs, including a ±200 Mvar system in China’s Southern Power Grid. These installations and others like them play a vital role in stabilizing grid voltage and improving fault ride-through performance, which is essential for integrating large-scale renewable energy projects.
By Component
Power electronics dominated the market with 42% share in 2024, driven by growing reliance on advanced semiconductor devices such as IGBTs, GTOs, and thyristors. These components are vital for ensuring efficient voltage regulation, fast switching, and enhanced controllability in FACTS systems. Their integration enhances the operational flexibility of grid infrastructure, enabling utilities to manage rising loads and variable renewable inputs. Phase-shifting transformers and control systems hold notable shares but remain secondary to power electronics. Continuous advancements in semiconductor technology strengthen the dominance of this segment in global FACTS adoption.
- For instance, Infineon’s high-power IGBT modules have been widely used in STATCOM and SVC installations across Europe and Asia and are acknowledged for their fast-switching capabilities, which are beneficial for grid stability.
By Application
The voltage control segment led the market in 2024 with 40% share, reflecting its critical role in ensuring stable transmission and distribution networks. FACTS devices for voltage control are increasingly deployed to handle fluctuating demand, renewable energy integration, and grid congestion. Power flow control and network stability applications also show strong adoption, especially in cross-border interconnections and high-load industrial regions. However, voltage control remains the largest contributor due to its essential function in maintaining grid reliability, improving efficiency, and minimizing transmission losses across both developed and emerging economies.
Key Growth Drivers
Rising Demand for Grid Reliability
The growing demand for stable and reliable electricity transmission is a major driver of the FACTS market. Increasing urbanization and industrialization put pressure on existing grid infrastructure, creating the need for technologies that enhance voltage stability and reduce transmission losses. FACTS devices like STATCOM and SVC provide dynamic reactive power support, helping maintain system reliability during peak demand. With rising energy consumption globally, utilities are investing in advanced transmission technologies, positioning FACTS as a vital solution for ensuring uninterrupted and efficient power delivery.
- For instance, Siemens deployed a ±300 Mvar STATCOM at the Powergrid India Ranchi substation, providing dynamic voltage control and reactive power compensation to improve grid stability.
Integration of Renewable Energy Sources
Rapid integration of renewable energy, particularly wind and solar, drives adoption of FACTS solutions. These intermittent sources create challenges in voltage fluctuations and grid instability, requiring advanced compensation systems to ensure smooth power flow. STATCOMs and UPFCs are increasingly deployed in renewable-rich regions to stabilize supply and optimize transmission capacity. Government policies supporting clean energy transitions further accelerate FACTS demand. As renewable capacity expands, FACTS systems will play a key role in grid balancing, enhancing flexibility, and enabling higher renewable penetration.
- For instance, Siemens Energy commissioned a ±200 Mvar STATCOM in Germany to stabilize grid operations for more than 2.5 GW of wind capacity connected in the North Sea region.
Investment in Transmission Infrastructure
Ongoing investments in upgrading and expanding transmission infrastructure significantly boost the FACTS market. Many countries are modernizing outdated grids to handle higher loads, reduce congestion, and support long-distance power transfer. FACTS technologies allow utilities to maximize the efficiency of existing assets without large-scale construction, offering a cost-effective alternative. Emerging economies in Asia-Pacific and Africa are witnessing substantial investments in transmission projects, directly driving FACTS adoption. These infrastructure upgrades ensure enhanced power quality, improve interconnection reliability, and facilitate cross-border electricity trading.
Key Trends & Opportunities
Technological Advancements in Power Electronics
Advancements in semiconductor devices, such as IGBTs and thyristors, are enabling more efficient and compact FACTS solutions. Improved switching capabilities and energy efficiency make these systems suitable for high-voltage, high-capacity applications. This technological evolution reduces operational costs and enhances the reliability of FACTS devices. The development of hybrid solutions combining multiple FACTS functions also creates opportunities for utilities to adopt versatile systems. These innovations align with rising demand for efficient, digitally integrated, and smart grid-compatible transmission technologies.
- For instance, Mitsubishi Electric developed a 4.5 kV IGBT module series for grid applications, with many units supplied for STATCOM and HVDC projects to improve transmission stability.
Expansion of Smart Grids and Digitalization
The global shift toward smart grids presents significant opportunities for FACTS adoption. Digital monitoring, automation, and IoT-based systems allow real-time control of transmission networks, where FACTS devices provide critical reactive power compensation and grid stability. Utilities are increasingly integrating FACTS into smart grid projects to manage demand fluctuations and distributed energy resources. With rising investments in grid modernization, FACTS adoption is expected to grow further, offering utilities the flexibility to manage complex, dynamic power networks.
- For instance, GE (now GE Vernova’s Grid Solutions business) has implemented Flexible AC Transmission Systems (FACTS) in the United States to enhance grid capabilities. These projects, which involve technologies like Fixed Series Compensation (FSC) and Static Synchronous Compensators (STATCOM), help with real-time reactive power support and improve the efficiency and operational performance of transmission networks.
Key Challenges
High Installation and Maintenance Costs
FACTS systems involve high capital expenditure due to complex designs and advanced components such as power electronics and control systems. Installation requires significant technical expertise, while ongoing maintenance adds to lifecycle costs. For utilities in cost-sensitive markets, these expenses often act as a barrier to adoption, despite the long-term benefits of improved grid stability and efficiency. Balancing cost-effectiveness with advanced functionality remains a critical challenge in the widespread deployment of FACTS.
Complex Integration with Existing Grids
Integrating FACTS devices into aging or conventional grid infrastructure poses significant technical challenges. Compatibility issues with legacy systems, limited skilled workforce, and lengthy regulatory approvals can delay deployments. Additionally, the complexity of coordinating FACTS with multiple grid components increases operational risks during implementation. These barriers often discourage smaller utilities from adopting FACTS solutions. Addressing integration challenges through modular designs, standardized solutions, and training programs is essential to unlock the full potential of FACTS in global power networks.
Regional Analysis
North America
North America held the largest share of the flexible AC transmission systems market in 2024, accounting for 33%. Growth is driven by modernized grid infrastructure, rising renewable integration, and strong investments in transmission upgrades. The U.S. leads the region with large-scale deployment of STATCOM and SVC solutions to ensure grid stability and manage increasing power demand. Supportive regulatory frameworks and government programs promoting smart grid development further strengthen adoption. High electricity consumption, combined with continuous expansion of renewable energy projects, positions North America as the leading contributor to FACTS deployment globally.
Europe
Europe captured 28% share of the FACTS market in 2024, supported by strong emphasis on renewable energy integration and cross-border electricity trade. Countries such as Germany, the U.K., and France are leading adopters, focusing on advanced FACTS solutions to stabilize fluctuating wind and solar generation. The European Union’s regulatory push for sustainable energy and smart grid investments also supports market expansion. Ongoing interconnection projects across the region require FACTS systems for efficient power flow management and grid stability. Europe’s commitment to carbon neutrality continues to accelerate demand for advanced transmission technologies.
Asia-Pacific
Asia-Pacific accounted for 26% share of the FACTS market in 2024, emerging as the fastest-growing region. China and India drive demand with large-scale renewable projects, urbanization, and significant investments in transmission capacity expansion. Growing electricity demand and the need for efficient long-distance power transfer further fuel adoption. Japan and South Korea also contribute through smart grid and high-voltage transmission projects. Regional governments are prioritizing infrastructure upgrades to support industrial growth and renewable integration. With rapid economic expansion and increasing reliance on electricity, Asia-Pacific presents strong growth potential for FACTS solutions.
Latin America
Latin America held 7% share of the FACTS market in 2024, with Brazil and Mexico leading adoption. Growth is supported by investments in renewable projects, particularly wind and solar, which require grid stabilization technologies. Rising urbanization and industrialization are increasing electricity demand, encouraging utilities to modernize transmission systems. However, high installation costs and limited regional expertise pose barriers to wider adoption. Government initiatives promoting reliable power supply and foreign investments in infrastructure projects provide steady opportunities. Despite challenges, Latin America is gradually adopting FACTS technologies to enhance energy security and support expanding renewable capacity.
Middle East & Africa
The Middle East & Africa represented 6% share of the FACTS market in 2024, reflecting steady but limited adoption compared to other regions. GCC countries, particularly Saudi Arabia and the UAE, are investing in FACTS to support large-scale grid projects and renewable integration. Africa’s demand is growing due to electrification initiatives, though constrained by affordability and limited infrastructure. FACTS systems are increasingly deployed in utility-scale projects to improve voltage stability and reduce power losses. Rising energy consumption, coupled with renewable development targets, offers long-term opportunities for market growth across both subregions.
Market Segmentations:
By Type
- Static Synchronous Compensator (STATCOM)
- Static Var Compensator (SVC)
- Unified Power Flow Controller (UPFC)
- Others
By Component
- Power Electronics (IGBT, GTO, Thyristors)
- Phase Shifting Transformers
- Control Systems
- Others
By Application
- Voltage Control
- Power Flow Control
- Network Stability
- Others
By End-User
- Utilities
- Industrial
- Railways
- Others
By Geography
- North America
- Europe
- Germany
- France
- U.K.
- Italy
- Spain
- Rest of Europe
- Asia Pacific
- China
- Japan
- India
- South Korea
- South-east Asia
- Rest of Asia Pacific
- Latin America
- Brazil
- Argentina
- Rest of Latin America
- Middle East & Africa
- GCC Countries
- South Africa
- Rest of the Middle East and Africa
Competitive Landscape
The competitive landscape of the flexible AC transmission systems (FACTS) market is shaped by leading players such as Ingeteam, NR Electric, Siemens, General Electric, Infineon, Hyosung, Mitsubishi, ABB, Rongxin, and BHEL. These companies strengthen their positions through advanced technology portfolios, strong project execution capabilities, and global partnerships with utilities and grid operators. Continuous investments in R&D allow them to develop high-efficiency solutions such as STATCOM, SVC, and UPFC systems that meet modern grid requirements. Expansion into renewable energy integration projects further enhances their market presence, particularly in regions undergoing rapid grid modernization. Many players also focus on digitalization and smart grid compatibility, ensuring seamless control, monitoring, and stability of transmission networks. Strategic mergers, acquisitions, and collaborations are used to expand geographical reach and diversify offerings. With increasing emphasis on clean energy and reliable transmission infrastructure, competition among these players is expected to intensify, driving innovation and efficiency improvements.
Shape Your Report to Specific Countries or Regions & Enjoy 30% Off!
Key Player Analysis
Recent Developments
- In May 2025, Mitsubishi Electric disclosed increased investment (≈ 16 billion yen) in its Transmission & Distribution Systems business (including power system stabilization equipment) to scale production and address growing global demand.
- In 2025, Siemens Energy expanded its FACTS service portfolio with cyber security offerings, including patch management and penetration testing across three tiers.
- In 2025, Siemens Energy promoted its SVC PLUS FS technology, enabling grid-forming functions and synthetic inertia support for renewable-heavy grids.
- In December 2024, ABB announced the acquisition of the power electronics business unit of Siemens Gamesa (Spain), adding over 100 engineers and two converter factories, to strengthen its renewable power and grid conversion capabilities.
Report Coverage
The research report offers an in-depth analysis based on Type, Component, Application, End-User and Geography. It details leading market players, providing an overview of their business, product offerings, investments, revenue streams, and key applications. Additionally, the report includes insights into the competitive environment, SWOT analysis, current market trends, as well as the primary drivers and constraints. Furthermore, it discusses various factors that have driven market expansion in recent years. The report also explores market dynamics, regulatory scenarios, and technological advancements that are shaping the industry. It assesses the impact of external factors and global economic changes on market growth. Lastly, it provides strategic recommendations for new entrants and established companies to navigate the complexities of the market.
Future Outlook
- The market will expand steadily with increasing investments in transmission infrastructure upgrades.
- STATCOM will remain the leading segment due to its efficiency and fast response capabilities.
- SVC and UPFC technologies will see wider adoption in renewable integration projects.
- Power electronics will continue driving innovation with advanced IGBTs and thyristors.
- Smart grid development will create strong opportunities for FACTS deployment.
- Asia-Pacific will emerge as the fastest-growing region supported by large-scale renewable projects.
- North America and Europe will maintain dominance with strong regulatory and policy support.
- Rising electricity demand in developing economies will accelerate FACTS adoption.
- Digitalization and IoT-enabled monitoring will enhance operational efficiency of FACTS systems.
- High focus on sustainability and reliable grid management will drive future investments.


