Market Overview
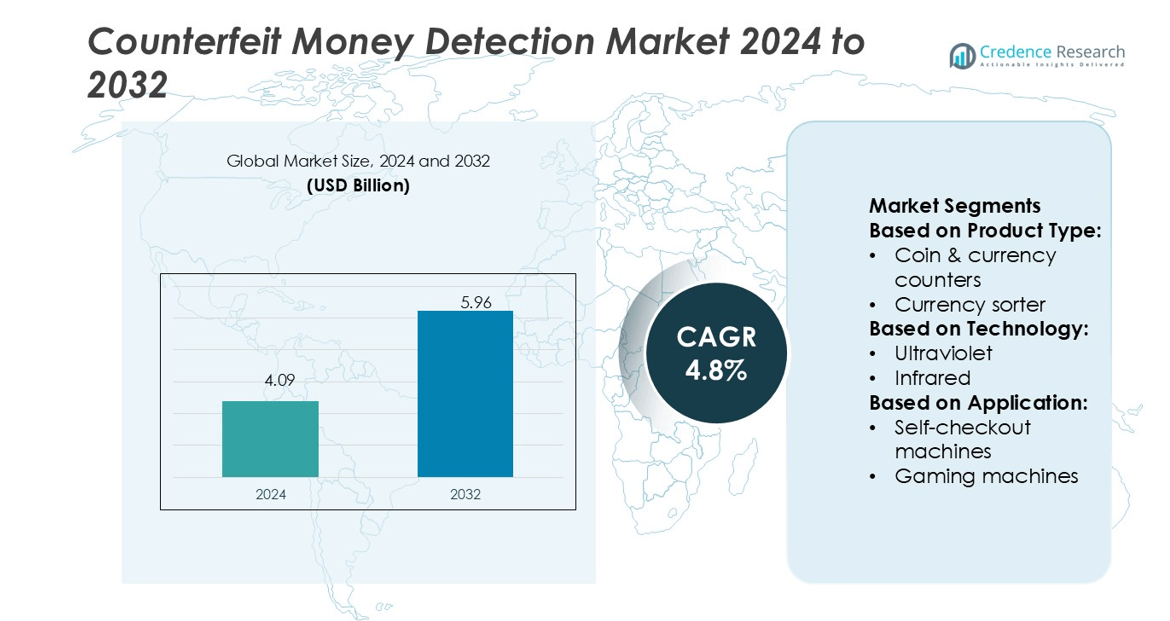
Counterfeit Money Detection Market size was valued USD 4.09 billion in 2024 and is anticipated to reach USD 5.96 billion by 2032, at a CAGR of 4.8% during the forecast period.
| REPORT ATTRIBUTE |
DETAILS |
| Historical Period |
2020-2023 |
| Base Year |
2024 |
| Forecast Period |
2025-2032 |
| Counterfeit Money Detection Market Size 2024 |
USD 4.09 billion |
| Counterfeit Money Detection Market , CAGR |
4.8% |
| Counterfeit Money Detection Market Size 2032 |
USD 5.96 billion |
The counterfeit money detection market is dominated by key players including Renishaw Plc., JASCO, Thermo Fisher Scientific Inc., JEOL Ltd., Shimadzu Corporation, Oxford Instruments, TESCAN GROUP, Bruker, Agilent Technologies, Inc., and Danaher Corporation. These companies focus on developing advanced UV, infrared, magnetic, and AI-integrated detection systems to enhance currency authentication accuracy. Strategic collaborations with financial institutions and retailers support their global expansion and strengthen product accessibility. North America leads the global market with a 31% share, driven by strong regulatory frameworks, high currency circulation, and rapid adoption of intelligent detection technologies. The region’s well-established financial infrastructure and continuous system upgrades enable these players to maintain strong market positions. This leadership is expected to continue as technological innovation and security standards advance further.
Market Insights
- The Counterfeit Money Detection Market was valued at USD 4.09 billion in 2024 and is projected to reach USD 5.96 billion by 2032, growing at a CAGR of 4.8%.
- Rising counterfeit currency incidents and stricter security regulations are driving demand for advanced detection technologies.
- AI-powered and UV-IR integrated solutions are emerging as key trends, improving speed and accuracy in fraud detection.
- Strong competition among global players is pushing continuous product innovation, while cost and maintenance challenges restrain adoption in smaller businesses.
- North America holds a 31% market share, leading due to strong regulations and high cash circulation, while UV technology accounts for the largest segment share, supported by its wide application in retail, banking, and transportation sectors.
Access crucial information at unmatched prices!
Request your sample report today & start making informed decisions powered by Credence Research Inc.!
Download Sample
Market Segmentation Analysis:
By Product Type
Coin and currency counters hold the largest market share in the Counterfeit Money Detection Market. Their high adoption stems from rapid transaction processing in retail, banking, and cash-intensive businesses. These systems can count and detect counterfeit notes simultaneously, improving operational efficiency. For example, several financial institutions deploy high-speed counters capable of processing up to 1,200 notes per minute, reducing manual error and time. Currency sorters and detectors also show steady growth as automated cash handling expands in commercial spaces, while pens and other tools remain dominant in small-scale retail use.
- For instance, JEOL’s Cross Section Polisher™ (CP/CCP) is a laboratory instrument used to prepare microscopic cross-sections of materials for high-resolution analysis. The tool achieves milling speeds of up to 1.2 mm per hour using an ion beam to create pristine, artifact-free surfaces.
By Technology
Ultraviolet technology leads the market with the highest share due to its broad use across banks, retail stores, and transportation hubs. UV detection offers quick and cost-effective verification of security threads and watermarks, making it a preferred choice. Many machines integrate UV with other methods to boost accuracy. Infrared and magnetic technologies are gaining traction with advanced note authentication in high-security zones. Microprint and watermark technologies serve specialized applications, while hybrid systems combining multiple methods are increasing their presence in premium devices.
- For instance, SPD-20A / SPD-20AV UV-Vis detector achieves a noise floor of 0.5 × 10⁻⁵ AU and a linearity range up to 2.5 AU over 190–700 nm (and up to 900 nm with the AV version).
By Application
Kiosks dominate the application segment, holding the largest share in the Counterfeit Money Detection Market. Their use in retail chains, airports, and transport terminals drives this growth. Kiosks equipped with currency counters and UV detectors enable secure and fast cash transactions. Self-checkout machines and vending machines also show rising adoption, driven by automation and customer convenience. Gaming machines and fare collection systems increasingly use integrated counterfeit detectors to minimize fraud. This broader integration across multiple automated payment points strengthens the market’s overall expansion.
Key Growth Drivers
Rising Cash Circulation in Emerging Economies
Growing cash usage in emerging economies boosts demand for counterfeit money detectors. Retail, banking, and transportation sectors rely heavily on cash transactions, increasing the risk of counterfeit notes. Governments are enforcing stricter anti-counterfeiting laws, pushing businesses to adopt advanced detection solutions. Cassida Corporation reported a rise in sales of its 3300 Series detectors due to stronger retail cash handling compliance. The need for reliable verification systems drives market growth across developing regions.
- For instance, Xplore EDS detector supports routine elemental microanalysis in SEMs. It is available with sensor sizes up to 65 mm² and delivers guaranteed Mn Kα resolution of 129 eV even at 100 kcps count rate.
Increasing Adoption of Advanced Detection Technologies
Financial institutions and commercial users are adopting advanced technologies such as UV, IR, and magnetic sensors. These technologies enhance detection accuracy, reduce manual errors, and improve transaction speed. Companies are integrating AI algorithms for real-time authentication. For example, Glory Global Solutions enhanced its UW-700 series with multi-spectral imaging to identify microprint and magnetic ink features precisely. This technological shift fuels market expansion by improving security standards.
- For instance, Glory Global Solutions’ UW-700 series, designed for high-volume sorting in cash centers, uses advanced recognition and authentication sensors. The UW-700’s primary benefit is its high throughput and increased sorting flexibility with 12 output pockets.
Growing Threat of Sophisticated Counterfeiting
Counterfeiters are using advanced printing methods, increasing risks for businesses and governments. This trend compels organizations to upgrade detection systems with layered verification methods. High-risk environments like casinos, transport hubs, and retail stores require instant validation solutions. For instance, Cummins Allison’s JetScan iFX® series detects micro-security features with 99.95% accuracy. Rising complexity in counterfeit techniques directly drives demand for reliable detection equipment.
Key Trends & Opportunities
Integration of AI and IoT Technologies
AI-enabled counterfeit detection improves accuracy through pattern recognition and data learning. IoT integration allows real-time monitoring and centralized reporting. This trend creates opportunities for networked detection solutions across large retail and banking chains. For example, AccuBANKER launched IoT-enabled detectors with cloud dashboards to track multiple sites. Such connected systems enable rapid updates and stronger fraud prevention strategies.
- For instance, TESCAN is weaving AI and ML into the data side as well. The group’s subsidiary Tescan 3DIM offers 3D data processing with machine learning, applying AI for volumetric segmentation, denoising, slice alignment, and multi-modal fusion.
Expansion of Self-Service and Automated Payment Systems
Self-service kiosks and automated checkout machines are growing rapidly in retail, transport, and gaming. These systems need embedded counterfeit detection tools to ensure secure cash handling. Manufacturers are developing compact, high-speed sensors to fit these applications. For instance, GLORY’s compact sensors are widely used in gaming kiosks in Asia. Rising demand for unattended payment points fuels new product integration opportunities.
- For instance, Fourier 80 benchtop NMR with synTQ for Process Analytical Technology (PAT) synTQ™ software platform, developed by Optimal Industrial Technologies, is explicitly integrated with the Fourier 80.
Regulatory Push for Secure Cash Handling
Stricter currency authentication standards from central banks and financial regulators are shaping the market. Countries are mandating counterfeit detection tools in high-volume cash handling sectors. This creates stable demand for certified and compliant solutions. For example, the European Central Bank enforces authentication protocols for all ATMs and banknote handlers. Regulatory alignment drives market maturity and product standardization.
Key Challenges
Rising Digital Payment Adoption
Digital payment platforms are reducing cash transaction volumes in many economies. This trend slows demand growth for counterfeit detection devices in developed markets. Retailers are shifting to contactless payment systems, limiting investment in new detectors. For example, Sweden’s near-cashless ecosystem has reduced demand for banknote verification systems. This shift challenges market expansion in cash-light economies.
High Product and Maintenance Costs
Advanced counterfeit detection systems require costly hardware and regular calibration. Small and medium businesses may delay adoption due to budget constraints. Complex sensor technologies also increase maintenance expenses. For instance, multi-spectral and magnetic detectors have higher upkeep costs than UV-only systems. This cost factor remains a key barrier, especially in low-margin sectors like small retail and transportation.
Regional Analysis
North America
North America holds a 31% share of the counterfeit money detection market. The U.S. leads this growth due to strict anti-counterfeiting regulations and a well-established financial ecosystem. Retailers, banks, and transport operators deploy UV, infrared, and magnetic detection technologies to minimize fraud. High currency circulation further increases the need for accurate systems. Advanced digital solutions and the rapid adoption of AI-based detection tools support growth. The presence of key technology providers and continuous regulatory pressure keeps North America in the leading position globally.
Europe
Europe accounts for 27% of the counterfeit money detection market. Regulatory frameworks from the European Central Bank strengthen detection standards across major economies like Germany, France, and the UK. Widespread adoption of UV and watermark-based systems in retail, transport, and banking reduces fraud incidents. Bulk currency handling in cash-intensive industries further drives system integration. Advanced financial networks and frequent technology upgrades improve operational accuracy. A focus on compliance and transaction security ensures Europe maintains strong market momentum.
Asia Pacific
Asia Pacific captures a 29% share of the counterfeit money detection market. Rapid growth in retail, transportation, and banking sectors fuels system adoption. Countries like China, India, and Japan show rising deployment of UV, magnetic, and AI-integrated detection systems. Large currency circulation volumes and increasing counterfeit cases strengthen regulatory focus. Expanding ATM networks and financial infrastructure further boost demand. Domestic manufacturing and government initiatives enhance technology accessibility. This combination of drivers positions Asia Pacific as a high-growth regional market.
Latin America
Latin America holds a 6% share of the counterfeit money detection market. Brazil and Mexico are key adopters as counterfeit activities increase in retail and transport sectors. Strong government focus on currency protection is driving adoption of affordable and reliable detection systems. Growing SME activity and rising cash handling in commercial spaces further fuel demand. Regulatory frameworks are still developing but encourage wider technology adoption. Expanding financial services and the need for fraud prevention support the region’s gradual growth in this market.
Middle East & Africa
The Middle East & Africa region represents 7% of the counterfeit money detection market. Expanding banking infrastructure and rising tourism support steady adoption of detection systems. Countries such as the UAE and South Africa lead with installations in commercial and transport hubs. Currency verification devices are becoming essential in retail operations. Cross-border trade and financial modernization stimulate system deployment. Although regulatory structures are still evolving, technology penetration is increasing. This creates a solid foundation for future market expansion.
Market Segmentations:
By Product Type:
- Coin & currency counters
- Currency sorter
By Technology:
By Application:
- Self-checkout machines
- Gaming machines
By Geography
- North America
- Europe
- Germany
- France
- U.K.
- Italy
- Spain
- Rest of Europe
- Asia Pacific
- China
- Japan
- India
- South Korea
- South-east Asia
- Rest of Asia Pacific
- Latin America
- Brazil
- Argentina
- Rest of Latin America
- Middle East & Africa
- GCC Countries
- South Africa
- Rest of the Middle East and Africa
Competitive Landscape
The counterfeit money detection market is characterized by strong competition among major players such as Renishaw Plc., JASCO, Thermo Fisher Scientific Inc., JEOL Ltd., Shimadzu Corporation, Oxford Instruments, TESCAN GROUP, Bruker, Agilent Technologies, Inc., and Danaher Corporation. The counterfeit money detection market is highly competitive, driven by rapid technological advancements and regulatory pressure to ensure currency security. Companies focus on developing advanced UV, infrared, magnetic, and watermark detection systems that offer higher speed and precision. AI and machine learning integration enhances real-time detection capabilities and reduces manual errors in cash handling. Partnerships with financial institutions, retail chains, and transport operators strengthen distribution networks and improve market reach. Firms are also investing in portable and cost-efficient devices to meet the growing demand from small and medium enterprises. Continuous product innovation, compliance with international standards, and strategic expansions play a central role in maintaining market competitiveness.
Shape Your Report to Specific Countries or Regions & Enjoy 30% Off!
Key Player Analysis
- Renishaw Plc.
- JASCO
- Thermo Fisher Scientific Inc.
- JEOL Ltd.
- Shimadzu Corporation
- Oxford Instruments
- TESCAN GROUP
- Bruker
- Agilent Technologies, Inc.
- Danaher Corporation
Recent Developments
- In September 2025, D-ID announced its acquisition of AI video pioneer simpleshow, merging interactive AI visual agents and avatar technologies with industry-leading explainer video creation capabilities. This partnership enables enterprises to deploy personalized, interactive digital avatars for diverse corporate functions such as sales, training, and onboarding.
- In June 2025, Google launched Safety Charter in India to address the rising challenges of online fraud, deepfakes, and cybersecurity threats amid the country’s expanding digital economy. The initiative focuses on protecting users from scams, enhancing cybersecurity in government and enterprise sectors, and promoting responsible AI development.
- In April 2024, Microsoft showcased its latest AI model, VASA-1, which can generate lifelike talking faces from a single static image and an audio clip. This model is designed to exhibit appealing visual affective skills (VAS), enhancing the realism of digital avatars. By pushing the boundaries of AI-generated content, Microsoft aims to create more engaging and interactive user experiences in various applications, including gaming and virtual communication.
- In November 2023, Glory Ltd. launched GLR-200, new GLR series of Teller Cash Recyclers (TCRs) capable of handling both paper and polymer currency, for financial institutions. The GLR-200 accepts customer dispense and deposit transactions of any value or denomination in addition to foreign exchange and has multiple storage configurations.
Report Coverage
The research report offers an in-depth analysis based on Product Type, Technology, Application and Geography. It details leading market players, providing an overview of their business, product offerings, investments, revenue streams, and key applications. Additionally, the report includes insights into the competitive environment, SWOT analysis, current market trends, as well as the primary drivers and constraints. Furthermore, it discusses various factors that have driven market expansion in recent years. The report also explores market dynamics, regulatory scenarios, and technological advancements that are shaping the industry. It assesses the impact of external factors and global economic changes on market growth. Lastly, it provides strategic recommendations for new entrants and established companies to navigate the complexities of the market.
Future Outlook
- The market will witness higher adoption of AI-powered detection systems for improved accuracy.
- Demand for compact and portable devices will rise across retail and transport sectors.
- Real-time data analytics will play a key role in identifying counterfeit patterns.
- Financial institutions will increase investment in advanced multi-layer authentication systems.
- Integration of machine learning will enhance automation and reduce manual intervention.
- Government regulations will continue to strengthen currency security standards.
- Cloud-based platforms will support faster verification and centralized monitoring.
- Partnerships between technology providers and banks will expand global distribution networks.
- Digital payment growth will drive hybrid detection solutions combining cash and digital security.
- Focus on cost-efficient and user-friendly devices will boost adoption among SMEs.


