
Market Overview:
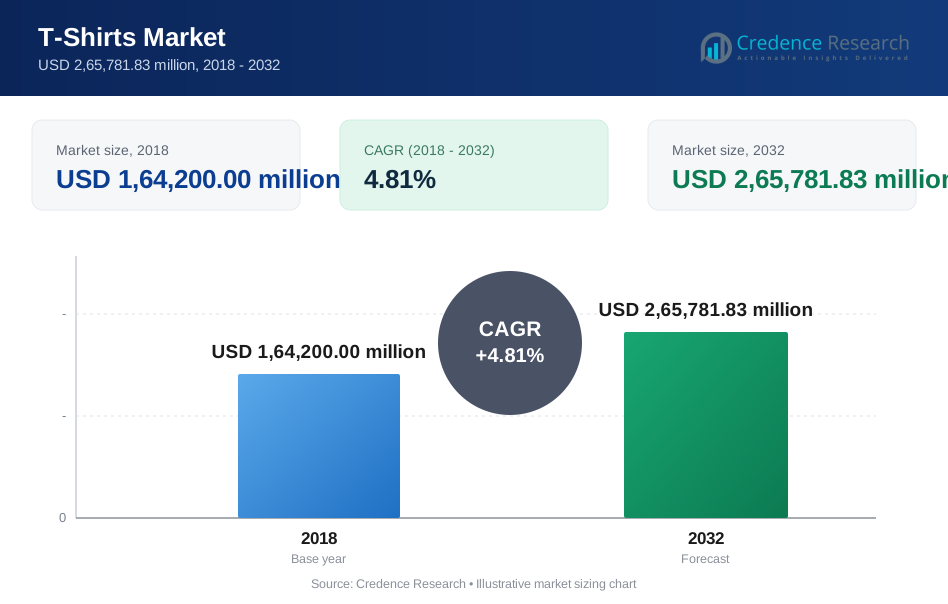
The Global T-Shirt Market size was valued at USD 1,64,200.00 million in 2018 to USD 1,83,891.48 million in 2024 and is anticipated to reach USD 2,65,781.83 million by 2032, at a CAGR of 4.81% during the forecast period.
| REPORT ATTRIBUTE | DETAILS |
|---|---|
| Historical Period | 2020-2023 |
| Base Year | 2024 |
| Forecast Period | 2025-2032 |
| T-Shirt Market Size 2024 | USD 1,83,891.48 Million |
| T-Shirt Market, CAGR | 4.81% |
| T-Shirt Market Size 2032 | USD 2,65,781.83 Million |
Growing interest in fast fashion drives steady consumption across many shopper groups. Brands release frequent designs that match lifestyle shifts and cultural trends. Many labels use organic cotton and recycled blends to strengthen their appeal. Direct-to-consumer channels support wider visibility and quick delivery. Influencer reach lifts brand awareness in young buyers. Custom prints gain traction due to corporate events and personal gifting. Strong supply chains in key textile hubs help producers meet rising volumes and short lead times.
North America and Europe lead due to strong brand presence and high fashion adoption. These regions benefit from mature e-commerce networks and strong demand for premium styles. Asia Pacific emerges fast due to large youth populations and rising urban spending. China, India, and Southeast Asia show strong growth driven by local manufacturing strength and fast retail expansion. Latin America gains traction through lifestyle shifts and expanding online channels. The Middle East and Africa show early growth supported by rising retail penetration and global brand entry.
Market Insights:
- The market grew from USD 1,64,200.00 million in 2018 to USD 1,83,891.48 million in 2024, and is expected to reach USD 2,65,781.83 million by 2032, posting a CAGR of 4.81%, driven by fast fashion cycles, rising casualwear use, and strong e-commerce presence.
- The top three regions—Asia Pacific (39.8%), North America (25.8%), and Europe (23.6%)—lead due to strong manufacturing bases, high brand penetration, and broad fashion adoption supported by digital retail networks.
- Asia Pacific, the fastest-growing region at 6% CAGR, expands quickly due to large youth populations, strong textile ecosystems, and rapid urban spending on casual and graphic styles.
- Based on the chart, Organic Cotton holds ~30% share, supported by rising demand for sustainable fabrics across premium and mass-market categories.
- Polyester and Others jointly contribute ~50%, reflecting strong adoption of performance fabrics and specialty blends that meet comfort, durability, and trend-driven needs.

Market Drivers:
Rising Adoption of Casual Apparel Across Diverse Age Groups
Growing interest in casual clothing strengthens steady demand across global markets. Buyers prefer soft fabrics and simple silhouettes for daily use. Fashion cycles push brands to refresh collections often. Rising online spending lifts exposure for small and large labels. Influencer culture shapes design direction for youth groups. Sustainability expectations push producers toward eco blends. Fast shipping improves buyer trust in digital channels. The Global T Shirt Market benefits from strong demand across lifestyle segments.
- For instance, H&M scaled its use of recycled polyester, with 94% of its polyester in 2024 coming from recycled sources, up from 79% in 2023. This was a significant step toward the company's long-term material goals, which include reaching 100% recycled polyester by 2025. Fast logistics also improve buyer trust in digital channels, with Zara's automated distribution system enabling rapid inventory turnover.
Shift Toward Sustainable Materials and Ethical Production Standards
Eco-focused shoppers prefer organic and recycled blends. Many brands invest in traceable supply chains that support ethical goals. Cleaner dye methods gain attention due to strict rules in major markets. Large factories integrate energy-efficient systems to cut waste. Certifications help brands build trust with conscious buyers. Digital tools support transparency across sourcing stages. Retailers highlight green collections in marketing work. This shift builds long-term value for producers and consumers.
- For instance, Adidas confirmed using 96% recycled polyester in its apparel lines by 2022 across several regions, marking a major shift toward low-impact materials globally.
Growth of E-Commerce Platforms and Direct-To-Consumer Brand Expansion
E-commerce channels allow brands to reach new regions quickly. Easy product discovery supports strong online traffic for apparel. Personalization tools improve engagement and lift conversion rates. Subscription packs help companies predict demand. Cross-border shipping introduces labels to new buyers. Social ads drive faster reach in target groups. Return-friendly policies improve shopper comfort. The Global T Shirt Market gains from strong digital retail adoption.
Rising Influence of Pop Culture, Custom Prints, and Brand Collaborations
Pop culture trends guide buyers toward themed prints and limited drops. Artists partner with labels to offer unique styles. Sports events lift demand for team-based apparel. Corporate gifting needs fuel custom print orders. Print-on-demand platforms scale quickly with digital tech. Viral designs spread across social channels within hours. Event merchandise strengthens seasonal revenue. This shift creates steady demand for expressive designs.
Market Trends:
High Uptake of Premium Fabrics and Performance-Driven T Shirt Designs
Brands launch blends that improve breathability and comfort. Moisture-wick features gain strong interest among active users. Stretch fabrics help labels meet fitnesswear demand. Soft-touch finishes improve the premium feel of new lines. Producers test smart yarns for temperature balance. Retailers promote performance pieces in targeted campaigns. Buyers accept higher prices for durable materials. The Global T Shirt Market tracks strong interest in premium designs.
- For instance, Nike’s Dri-FIT technology powers millions of units annually, with the company reporting that over 40% of its training apparel incorporates moisture-management fabrics.
Expansion of Minimalist Aesthetic and Neutral Color Palettes Across Regions
Shoppers pick clean cuts that match many outfits. Neutral tones fit well in casual and work settings. Many labels push capsule lines that feature simple basics. Buyers prefer timeless shapes that reduce wardrobe clutter. Influencers highlight minimal styling tips online. Retailers group neutral styles to lift sales. Global cities show strong love for muted palettes. This shift supports long-wear products for many lifestyles.
- For instance, Uniqlo’s minimalistic AIRism and Supima cotton T-shirt ranges consistently rank among its top sellers, with the brand confirming sales of over 100 million AIRism units in a single year across global markets.
Rapid Growth of Athleisure-Linked T Shirt Collections Supporting Fitness Culture
Fitness culture drives interest in active-focused tees. Gyms encourage branded apparel for members. Brands test compression fabrics for better performance. Seamless stitching supports comfort during workouts. Sports campaigns raise interest for training gear. Digital fitness creators promote activewear strongly. Many buyers mix gymwear with daily outfits. The Global T Shirt Market benefits from this lifestyle shift.
Rise of AI-Based Design Tools and Data-Driven Style Forecasting Adoption
AI tools help brands predict popular colors and prints. Machine learning supports faster design cycles. Automated systems guide inventory planning for each season. Virtual try-on tools reduce buyer hesitation. Retailers use data to track repeat orders. 3D tools speed prototype testing. Social insights shape collection ideas. This trend improves accuracy in product launch planning.
Market Challenges Analysis:
High Competition, Price Pressure, and Short Product Life Cycles
The Global T Shirt Market faces strong pressure from thousands of brands. Price wars limit margins for many sellers. Frequent design cycles strain supply chains. Counterfeit goods weaken trust among buyers. Many labels struggle to retain loyalty. Rapid trend shifts reduce shelf life for styles. Production delays hurt seasonal planning. It becomes difficult for brands to balance cost and quality efficiently.
Environmental Compliance, Supply Chain Complexity, and Volatile Raw Material Costs
Stricter rules around dyes and waste push producers to upgrade systems. Cotton price swings impact cost planning. Weather shifts affect crop quality worldwide. Supply chain disruptions extend delivery timelines. Ethical sourcing checks slow onboarding of vendors. Labor rules in textile hubs tighten each year. Brands invest more in audits to meet standards. These pressures raise operating difficulty for many companies.
Market Opportunities:
Growth of Customization Platforms, Emerging Markets, and Tech-Enabled Retail Models
The Global T Shirt Market gains new space through custom print tools. Buyers prefer unique designs for gifting and events. AI-driven personalization opens new revenue lines. Rising incomes in Asia and Africa expand demand. D2C channels allow small labels to scale. Virtual fitting improves buyer comfort. Soft logistics networks lift delivery speed. This shift supports long-term expansion.
Expanding Demand for Sustainable Apparel, Premium Basics, and Niche Collaborations
Eco apparel lines win support from conscious shoppers. Premium basics match long-term wardrobe goals. Limited drops attract collectors in many regions. Brands form niche partnerships with artists and designers. Recycled fibers gain adoption among youth. Digital retail improves reach for green lines. Cleaner production builds trust across markets. These factors create strong growth potential.

Market Segmentation Analysis:
By Product Type
Round neck T-shirts dominate due to strong use in daily wear and mass fashion lines. V-neck styles appeal to buyers who want a sharper silhouette across casual outfits. Collared T-shirts gain steady traction in semi-formal and uniform categories. Graphic T-shirts hold wide interest among younger groups that prefer expressive prints. Other specialty formats serve niche fashion and seasonal demand. The Global T Shirt Market benefits from broad product diversity that supports many lifestyle needs.
- For instance, Inditex's public disclosures detail the tonnage of raw materials used, such as the 42.3 million items put on the market with the "Right to Wear +" (later known as "Join Life") environmental sustainability standard across all brands in 2016. These reports outline broad environmental targets and achievements in sourcing sustainable materials, rather than confirming unit counts for specific product categories like "tens of millions of round-neck tees".
By Material
Cotton leads due to comfort, durability, and strong global sourcing networks. Polyester gains share through performance features suited for sportswear and outdoor use. Organic cotton expands among eco-focused buyers. Bamboo and other eco-friendly fabrics rise due to sustainability claims and soft textures. Linen, Merino, and other blends meet premium and climate-specific needs across many regions.
By End-User
Men form a large base driven by continuous wardrobe rotation and strong casualwear adoption. Women’s styles grow fast due to frequent design updates and trend-driven choices. Unisex formats gain scale through minimal aesthetics and broad size ranges used by global brands.
By Printing Technique
Screen printing remains common for bulk orders and uniform programs. Digital printing supports short runs and personalized design work. Sublimation attracts sportswear makers for vibrant and durable graphics. Embroidery meets premium and corporate requirements. Other methods support limited-edition designs and specialty effects.
By Distribution Channel
Online retail grows quickly through wide choice and strong digital marketing. Offline retail stays relevant through fit trials and brand visibility. Brand outlets support loyalty programs and curated collections. Wholesale networks serve bulk buyers. Other channels cover regional and niche retail needs.

Segmentation:
By Product Type
- Round Neck T-Shirts
- V-Neck T-Shirts
- Collared T-Shirts
- Graphic T-Shirts
- Others
By Material
- Cotton
- Polyester
- Organic Cotton
- Bamboo / Eco-Friendly Fabrics
- Others (Linen, Merino, etc.)
By End-User
- Men
- Women
- Unisex
By Printing Technique
- Screen Printing
- Digital Printing (DTG)
- Sublimation Printing
- Embroidery
- Others
By Distribution Channel
- Online Retail (E-commerce, Brand Websites)
- Offline Retail (Supermarkets, Specialty Stores)
- Brand Outlets
- Wholesale / Bulk Distribution
- Others
By Region
- North America
- U.S.
- Canada
- Mexico
- Europe
- Germany
- France
- U.K.
- Italy
- Spain
- Rest of Europe
- Asia Pacific
- China
- Japan
- India
- South Korea
- South-east Asia
- Rest of Asia Pacific
- Latin America
- Brazil
- Argentina
- Rest of Latin America
- Middle East & Africa
- GCC Countries
- South Africa
- Rest of the Middle East and Africa
Regional Analysis:
North America
The North America Global T Shirt Market size was valued at USD 42,363.60 million in 2018, reached USD 46,633.77 million in 2024, and is expected to reach USD 67,269.86 million by 2032 at a CAGR of 4.8%. North America holds a 25.8% share supported by strong apparel spending, wide fashion acceptance, and frequent collection launches that match lifestyle needs. E-commerce networks strengthen access through fast delivery and broad assortments, while sustainability goals push brands toward recycled and organic fabrics. Influencer culture boosts demand for premium and graphic designs, and retail chains maintain strong visibility in urban areas. Local producers test new fabrics for comfort and durability, and the region continues to favor casualwear for daily and work settings.
Europe
The Europe Global T Shirt Market was valued at USD 38,751.20 million in 2018, increased to USD 41,517.67 million in 2024, and is projected to reach USD 56,280.01 million by 2032 at a CAGR of 4.0%. Europe captures a 23.6% share driven by strong fashion culture, high-quality material preference, and premium brand influence. Eco-certified fabrics gain traction due to strict regional standards, while fast-fashion brands shape trends in major cities. E-commerce expands access for emerging designers, and retailers promote minimalist and seasonal looks. Graphic tees perform well among youth segments, and diverse consumer groups support stable regional growth.
Asia Pacific
The Asia Pacific Global T Shirt Market grew from USD 65,318.76 million in 2018 to USD 75,146.48 million in 2024 and is expected to hit USD 1,15,641.89 million by 2032 at a CAGR of 5.6%. Asia Pacific holds the largest share at 39.8%, driven by large populations, strong textile manufacturing, and rapid retail expansion. Youth buyers adopt global trends quickly through digital platforms, and urbanization lifts spending on expressive casualwear. Brands invest in omnichannel strategies to expand reach, while eco-friendly fabrics grow in popularity. International labels widen their store presence across key cities, making the region the strongest contributor to global volume growth.
Latin America
The Latin America Global T Shirt Market increased from USD 11,165.60 million in 2018 to USD 12,392.44 million in 2024 and is projected to reach USD 16,709.70 million by 2032 at a CAGR of 3.9%. Latin America holds a 6.8% share sustained by a young population, rising fashion interest, and growing digital access. Buyers follow global and regional trends across casualwear, while digital platforms extend reach into remote areas. Local manufacturers provide affordable options for mass consumers, and graphic styles remain popular among youth. Retail chains expand in major cities, sustainability awareness grows, and the region maintains steady long-term momentum.
Middle East
The Middle East Global T Shirt Market grew from USD 4,022.90 million in 2018 to USD 4,062.81 million in 2024 and is estimated to reach USD 4,945.00 million by 2032 at a CAGR of 2.6%. The region holds 2.45% share supported by expanding retail hubs, preference for premium styles, and tourism-driven seasonal demand. Malls enhance brand exposure, and online shopping grows with fast digital adoption. Lightweight fabrics suit climate needs, and local designers promote culturally inspired prints. The region records moderate but stable growth across major urban centers.
Africa
The Africa Global T Shirt Market expanded from USD 2,577.94 million in 2018 to USD 4,138.30 million in 2024 and is forecast to reach USD 4,935.37 million by 2032 at a CAGR of 1.8%. Africa holds a 1.57% share driven by rising urbanization, growing retail access, and strong demand for affordable cotton styles. Online retail increases product availability, while youth-driven interest fuels demand for graphic and casual formats. Local production grows in key economies, and global brands enter through franchise models. Climate conditions support year-round use of lightweight materials, and digital expansion improves market reach across the region.
Key Player Analysis:
- Nike
- Adidas
- Puma
- Under Armour
- Levi’s
- H&M
- Zara
- Uniqlo (Fast Retailing)
- Gap Inc.
- American Eagle Outfitters
Competitive Analysis:
The Global T Shirt Market features strong competition shaped by global brands, fast-fashion chains, and digital-first labels. Companies fight for share through rapid design cycles, sustainable materials, and tech-enabled retail strategies. Leading players rely on large supply chains that support scale and speed. Rising interest in personalization pushes firms to invest in advanced printing and digital customization platforms. E-commerce brands challenge traditional retailers with aggressive pricing and targeted marketing. Premium labels focus on quality and fabric innovation. It remains competitive due to low entry barriers and constant trend shifts that drive frequent product refresh cycles.
Recent Developments:
- In October 2025, Nike announced a transformative restructuring by creating a new unified Innovation Engine that consolidates its Innovation, Design and Product teams across Nike, Jordan Brand, and Converse. This strategic move was designed to accelerate athlete-centered innovation and drive product creation that addresses athletes' goals and struggles. The company also unveiled four innovation platforms as part of its commitment to delivering disruptive products and advancing the future of sport.
- In September 2025, Penn State Athletics and Adidas announced a landmark 10-year partnership effective July 1, 2026, making adidas the official footwear, uniform, apparel, and sideline partner of the Nittany Lions. This transformational agreement unites the university's storied athletic legacy with adidas' industry-leading innovation, creating a commitment to elevating the student-athlete experience and enhancing fan engagement.
- In March 2025, Puma unveiled its "Go Wild" campaign, representing its largest global marketing initiative to date and a major repositioning of the brand. The campaign marked an evolution in brand identity, reflecting findings from the largest consumer research in Puma's history. Positioned as "performance meets joy," the campaign departed from traditional athlete-focused advertising to celebrate everyday runners of all backgrounds, from early risers to community runners. Puma simultaneously announced a 40% increase in advertising investments compared to 2024, signaling significant commitment to this new strategic direction.
- In February 2025, Nike introduced the Air Max Dn8, marking a significant evolution in its Air Max franchise. A limited Hyper Pink colourway launched via SNKRS on February 6, 2025, with the first full colourway releasing globally on Nike.com on March 6, 2025, and additional colorways launching on Air Max Day on March 26, 2025. The Air Max Dn8 represents the future of Air technology with vibrant colors and visible Air pockets, designed for both performance and everyday wearability.
Report Coverage:
The research report offers an in-depth analysis based on Product Type, Material, End-User, Printing Technique, and Distribution Channel. It details leading market players, providing an overview of their business, product offerings, investments, revenue streams, and key applications. Additionally, the report includes insights into the competitive environment, SWOT analysis, current market trends, as well as the primary drivers and constraints. Furthermore, it discusses various factors that have driven market expansion in recent years. The report also explores market dynamics, regulatory scenarios, and technological advancements that are shaping the industry. It assesses the impact of external factors and global economic changes on market growth. Lastly, it provides strategic recommendations for new entrants and established companies to navigate the complexities of the market.
Future Outlook:
- Sustainability-driven fabrics will gain wider acceptance across major regions.
- Digital printing will expand due to the rising need for short-run and custom designs.
- E-commerce growth will reshape pricing, delivery, and inventory strategies.
- Premium basics will scale as buyers seek durability and comfort.
- Smart inventory models will reduce waste and improve forecasting accuracy.
- Athleisure-linked T-shirt demand will strengthen across global markets.
- Influencer-driven collaborations will create high-impact micro-trends.
- Local manufacturing hubs will grow to support shorter lead times.
- Brands will invest in circular material systems to meet compliance rules.
- AI-driven design tools will guide color, pattern, and trend decisions.
Request a Free Sample
Fill in your details and we'll send you a free sample report.
- Sample data tables & charts
- Research methodology
Need a Custom Version of This Report?
Tailor the scope, geography, or segments to your exact requirements.
- Custom geography or segment scope
- Direct access to our analyst team
Frequently Asked Questions
What is the current market size for the Global T Shirt Market, and what is its projected size in 2032?
At what Compound Annual Growth Rate is the Global T Shirt Market projected to grow between 2025 and 2032?
Which Global T Shirt Market segment held the largest share in 2024?
What are the primary factors fueling the growth of the Global T Shirt Market?
Who are the leading companies in the Global T Shirt Market?
Which region commanded the largest share of the Global T Shirt Market in 2024?
Table of Content
Chapter 1. Report Introduction
- 1.1 Report Description & Purpose
- 1.1.1 Report Title & Market Definition
- 1.1.2 Unique Selling Propositions (USP) & Key Differentiators
- 1.1.3 Value Proposition for Stakeholders
- 1.2 Research Objectives
- 1.2.1 Market Sizing Objectives (Volume & Revenue)
- 1.2.2 Segmentation Objectives
- 1.2.3 Competitive Intelligence Objectives
- 1.2.4 Forecast & Scenario Objectives
- 1.3 Report Scope
- 1.3.1 T-Shirts Scope – Types & Subtypes Covered
- 1.3.2 Geographic Scope – Regions & Countries Covered
- 1.3.3 Historical Period, Base Year & Forecast Period (2018; forecast to 2032)
- 1.3.4 Inclusions & Exclusions
- 1.4 HS Code & Classification Framework
- 1.5 Currency, Units & Pricing Basis
- 1.6 Target Stakeholders
- 1.7 Limitations & Assumptions
Chapter 2. Executive Summary
- 2.1 Global T-Shirts Market Snapshot
- 2.1.1 Market Size – Historical (2018) & Forecast (2018-2032) (2018: USD 1,64,200.00 million → 2032: USD 2,65,781.83 million)
- 2.1.2 Volume & Revenue – Global Totals
- 2.1.3 Key Market Highlights – Top Five Facts
- 2.2 T-Shirts Market Segmentation Snapshot
- 2.2.1 Market Split by Region – 2018 vs. 2032
- 2.3 Competitive Snapshot
- 2.3.1 Top 10 Players by Revenue Share – 2018
- 2.3.2 Top 10 Players by Volume Share – 2018
- 2.3.3 Recent Strategic Developments (18-Month Summary)
- 2.4 Key Investment Highlights & Strategic Conclusions
Chapter 3. T-Shirts Market Dynamics & Industry Analysis
- 3.1 Market Overview & Context
- 3.1.1 T-Shirts Market Position in the Broader Automotive Value Chain
- 3.1.2 OEM vs. Replacement Market Dynamics
- 3.1.3 Market Maturity & Development Stage by Region
- 3.2 T-Shirts Market Drivers
- 3.3 T-Shirts Market Restraints & Challenges
- 3.4 T-Shirts Market Opportunities
- 3.5 Porter's Five Forces Analysis
- 3.5.1 Threat of New Entrants
- 3.5.2 Bargaining Power of Suppliers
- 3.5.3 Bargaining Power of Buyers
- 3.5.4 Threat of Substitutes
- 3.5.5 Competitive Rivalry – Intensity Assessment
- 3.6 T-Shirts Value Chain Analysis
- 3.6.1 Upstream – Raw Material/Input Suppliers
- 3.6.1.1 Raw Material/Input 1
- 3.6.1.2 Raw Material/Input 2
- 3.6.1.3 Raw Material/Input 3
- 3.6.2 Midstream – Production/Manufacturing/Service Delivery
- 3.6.2.1 Production/Process Overview
- 3.6.2.2 Key Facility Locations & Capacity by Manufacturer
- 3.6.3 Downstream – Distribution & End Consumer
- 3.6.3.1 Primary Channel – B2B/OEM
- 3.6.3.2 Secondary Channels – Dealer, Retail, Online, Direct
- 3.6.4 Value Chain Profitability Analysis
- 3.6.1 Upstream – Raw Material/Input Suppliers
- 3.7 PESTEL Analysis
- 3.7.1 Political Factors
- 3.7.2 Economic Factors
- 3.7.3 Social Factors
- 3.7.4 Technological Factors
- 3.7.5 Environmental Factors
- 3.7.6 Legal Factors
- 3.8 T-Shirts Supply Chain Analysis
- 3.8.1 Raw Material/Input Supply Risk Assessment
- 3.8.2 Manufacturing Concentration Risk (Geographic Exposure)
- 3.8.3 Trade Disruption Impact Analysis
- 3.9 Regulatory & Policy Landscape
Note: The regulatory and policy landscape section covers regulations based on their applicability to the market, T-Shirts category, geography, and scope of the study. Only regulatory frameworks with a material impact on operations, compliance, trade, sustainability, or market access are analyzed in detail.
Chapter 4. Key Investment Pockets & Opportunity Analysis
- 4.1 T-Shirts Market Attractiveness Analysis
- 4.1.1 By Region – Investment Attractiveness Matrix (Volume × CAGR)
- 4.2 Absolute Revenue Growth Opportunity
- 4.2.1 By Region – Absolute USD Growth Through 2032
- 4.3 Incremental Volume Opportunity
- 4.3.1 By Region – Incremental Volume Through 2032
- 4.3.2 Segment – Incremental Volume
- 4.4 Emerging Submarket Opportunity Deep Dive (Subject to Applicability)
- 4.5 Emerging Market Opportunity Scorecards
- 4.5.1 United States
- 4.5.2 Europe
- 4.5.3 Asia
- 4.5.4 Middle East & Africa
Note: Emerging Market Opportunity Scorecards will be included based on relevance and strategic importance. Regions listed are indicative and may vary depending on data availability and market dynamics.
Chapter 5. T-Shirts Import-Export Analysis & Trade Flows
- 5.1 Global Trade Overview
- 5.1.1 Global Export Value by Country (2018)
- 5.1.2 Global Export Volume by Country (2018)
- 5.1.3 Global Import Value by Country (2018)
- 5.1.4 Global Import Volume by Country (2018)
- 5.1.5 Net Trade Balance by Country (2018)
- 5.2 Export Analysis – Segment
- 5.2.1 Type 1 (HS Code)
- 5.2.2 Type 2 (HS Code)
- 5.2.3 Type 3 (HS Code)
- 5.2.4 Type 4 (HS Code)
- 5.2.5 Type 5 (HS Code)
- 5.3 Import Analysis – Segment
- 5.3.1 Type 1 (HS Code)
- 5.3.2 Type 2 (HS Code)
- 5.3.3 Type 3 (HS Code)
- 5.3.4 Type 4 (HS Code)
- 5.3.5 Type 5 (HS Code)
- 5.4 Average Unit Trade Prices
- 5.4.1 Average Export Price – Segment & Country
- 5.4.2 Average Import Price – Segment & Source Country
- 5.4.3 Price Trends (2018)
- 5.5 Key Trade Route Analysis
- 5.5.1 Trade Route 1
- 5.5.2 Trade Route 2
- 5.5.3 Trade Route 3
- 5.5.4 Trade Route 4
- 5.5.5 Trade Route 5
- 5.6 Trade Policy Impact Assessment
- 5.6.1 US Anti-Dumping & Section 301 Tariffs
- 5.6.2 EU Customs Union Impact
- 5.6.3 Major Free Trade Agreements
- 5.6.4 USMCA Rules of Origin
Note: Trade policy analysis will be included only where relevant to the T-Shirts market.
Chapter 6. Competitive Landscape & Company Benchmarking
- 6.1 T-Shirts Market Concentration & Structure
- 6.1.1 Herfindahl-Hirschman Index (HHI) – vs. 2018
- 6.1.2 Tier 1, Tier 2 & Tier 3 Market Structure
- 6.1.3 Global, Regional & Local Player Dynamics
- 6.2 T-Shirts Market Share Analysis – 2018
- 6.2.1 Global Revenue Share by Company
- 6.2.2 Global Volume Share by Company
- 6.2.3 Regional Revenue Share
- 6.2.4 Market Share Evolution ( vs. 2018)
- 6.2.5 OEM Segment Share by Company
- 6.2.6 Replacement Segment Share by Company
- 6.3 Production/Delivery Capacity & Facility Analysis
- 6.3.1 Global Installed Capacity
- 6.3.2 Capacity Utilization Rates
- 6.3.3 Production/Output Volume
- 6.3.4 Facility Locations & Capacity Map
- 6.3.5 Planned Capacity Additions
- 6.4 T-Shirts Competitive Benchmarking Matrix
- 6.4.1 Revenue, Volume, CAGR & Profitability Comparison
- 6.4.2 Channel Revenue Mix
- 6.4.3 Geographic Revenue Exposure
- 6.4.4 R&D Intensity
- 6.4.5 Sustainability Maturity
- 6.5 Strategic Developments in T-Shirts (Last 24 Months)
- 6.5.1 Mergers, Acquisitions & Divestments
- 6.5.2 New T-Shirts Launches
- 6.5.3 Facility Expansions
- 6.5.4 Strategic Alliances, Joint Ventures & Partnerships
- 6.5.5 Distribution Expansion & Market Entry
- 6.5.6 Sustainability & ESG Initiatives
- 6.6 Competitive Strategy Mapping
- 6.6.1 Leader, Challenger, Follower & Niche Classification
- 6.6.2 Pricing Strategy Comparison
- 6.6.3 Channel Strategy Matrix
Note: Strategic developments are included based on their materiality and the availability of reliable information.
Chapter 7. Global T-Shirts Market – By Distribution Channel
- 7.1 Segment Overview
- 7.1.1 Volume & Revenue Split by Channel (2018 & 2032)
- 7.1.2 Channel Mix Evolution (2018-2032)
Chapter 8. Regional Market Analysis – Global Overview
- 8.1 Global Regional Overview
- 8.1.1 Regional Volume Share
- 8.1.2 Regional Revenue Share
- 8.1.3 Regional Volume by Region
- 8.1.4 Regional Revenue by Region
- 8.1.5 Regional Forecast Through 2032
- 8.2 Cross-Regional Segment Analysis
- 8.2.1 By Distribution Channel
- 8.2.2 By Brand/Price Tier
Chapter 9. North America T-Shirts Market
- 9.1 United States
- 9.2 Canada
- 9.3 Mexico
Chapter 10. Europe T-Shirts Market
- 10.1 Germany
- 10.2 France
- 10.3 Italy
- 10.4 United Kingdom
- 10.5 Spain
- 10.6 Poland
- 10.7 Russia
- 10.8 Netherlands
- 10.9 Belgium
- 10.10 Sweden
- 10.11 Denmark
- 10.12 Norway
- 10.13 Rest of Europe
Chapter 11. Asia Pacific T-Shirts Market
- 11.1 China
- 11.2 India
- 11.3 Japan
- 11.4 South Korea
- 11.5 Thailand
- 11.6 Indonesia
- 11.7 Vietnam
- 11.8 Malaysia
- 11.9 Australia
- 11.10 Rest of Asia Pacific
Chapter 12. Latin America T-Shirts Market
- 12.1 Brazil
- 12.2 Argentina
- 12.3 Colombia
- 12.4 Chile
- 12.5 Rest of Latin America
Chapter 13. Middle East T-Shirts Market
- 13.1 Saudi Arabia
- 13.2 United Arab Emirates
- 13.3 Turkey
- 13.4 Israel
- 13.5 Iran
- 13.6 Rest of the Middle East
Chapter 14. Africa T-Shirts Market
- 14.1 South Africa
- 14.2 Egypt
- 14.3 Nigeria
- 14.4 Morocco
- 14.5 Rest of Africa
Chapter 15. T-Shirts Company Profiles
- 15.1 [Company 01]
- 15.1.1 Company Overview
- 15.1.2 Key Management Personnel
- 15.1.3 Products & Services Portfolio
- 15.1.4 Financial Performance
- 15.1.5 Key Market Focus & Geographic Presence
- 15.1.6 Recent Developments & Strategic Initiatives
Note: The company profile list is preliminary and may change based on research findings, market developments, data availability, and client requirements.
Chapter 16. Appendices
- Appendix A – List of Abbreviations & Acronyms
- Appendix B – Industry Classification Code Reference – Full Series
- Appendix C – Production & Capacity Data Tables
- Appendix D – End-Use & Demand Base Tables
- Appendix E – Consumption & Replacement Rate Assumptions
- Appendix F – ASP Reference Tables
- Appendix G – Manufacturing & Facility Database
- Appendix H – Import-Export Data Tables
- Appendix I – Regulatory Summary Tables
- Appendix J – Primary Research Participant List (Anonymized)
- Appendix K – Primary Research Questionnaire Framework
- Appendix L – Data Sources & Bibliography
- Appendix M – Market Size Divergence & Source Comparison
Chapter 17. Research Methodology
- 17.1 Research Framework & Philosophy
- 17.2 Secondary Research – Sources, Hierarchy & Data Extraction
- 17.3 Data Modeling – Bottom-Up & Top-Down Market Sizing
- 17.4 Primary Research – Stakeholder Framework, LOI & Sample Sizes
- 17.5 Forecast Methodology – Regression, Scenario & Sensitivity Analysis
- 17.6 Quality Control – Four-Layer Validation Framework
- 17.7 Limitations & Standard Assumptions
- 17.8 Disclaimer
