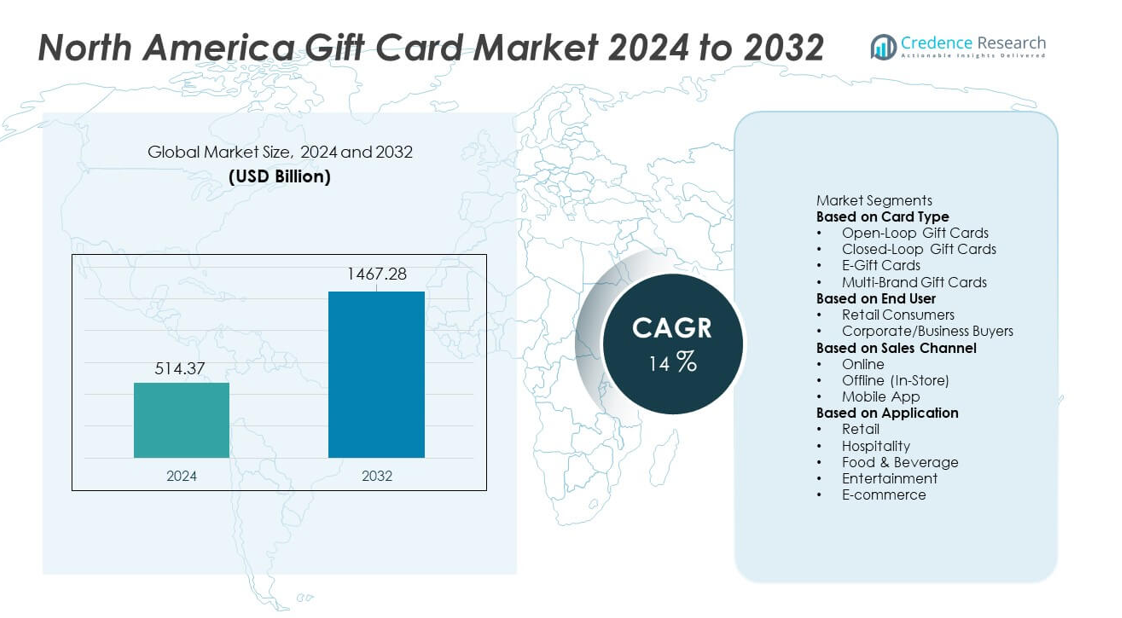
Home » Consumer Goods » North America Gift Card Market

North America Gift Card Market By Material Merchant Type (Supermarkets/Hypermarkets, Discount Stores, Coffee Shops, Entertainments, Restaurants, Department Stores, Grocery Stores, Salons/Spa, Book Stores, Home Décor Stores, Gas Stations, Visa/Master Card/American Express Gift Cards, Others) By Merchant Type (Universal Accepted Open Loop, Restaurant Closed Loop, Retail Closed Loop, Miscellaneous Closed Loop, E-Gifting) By End User – Growth, Future Prospects & Competitive Analysis, 2022 – 2030

Price: $2999

Published: | Report ID: 30434 | Report Format : PDF

North America Gift Card Market Overview

North America Gift Cards Market is projected to increase at a significant CAGR of 10.33% in the coming years. In 2022, the North America gift cards market was valued at USD 390.05 Billion and is projected to reach USD 896.33 Billion by 2030. The demand for gift cards is projected to increase substantially in the coming years.

The North America gift card market is expected to grow significantly in the coming years. The market is segmented by country, with the US and Canada being the major players. The US dominates the market, with a CAGR of 14.2% during the forecast period. The market is expected to grow due to increased government initiatives to adopt digital payment alternatives, particularly in hospitality, banking, corporate institutions, and retail sectors. The retail industry in the US and Canada has shown a significant uptake in digital gift card adoption, supported by technological innovations in product offerings. The North America gift cards market is segmented into card type and type, with closed-loop cards dominating the market. The market is expected to grow due to the widespread adoption of smartphones and digital wallets, which presents promising opportunities for the gift card market in the foreseeable future.

A “Gift Card” is a versatile, prepaid stored-value money card issued by retailers or banks, and can be used as an alternative to cash for purchases within specific stores or services. Available in two main types—physical cards, akin to credit cards with preloaded funds and a magnetic strip or barcode, and digital cards, delivered via email or apps with a code for online or in-store purchases—gift cards are often given by employers or organizations as rewards or gifts. They offer the convenience and flexibility for recipients to buy what they want or need, and are considered safer than cash. However, they come with limitations such as being restricted to certain stores or services, potential expiration dates, and possible fees. Especially popular during holidays and special occasions, gift cards provide a flexible and widely appreciated gift solution.

North America Gift Card Market

Design Element 2

Access crucial information at unmatched prices!

Request your free sample report today & start making informed decisions powered by Credence Research!

Download Free Sample
CTA Design Element 3

North America Gift Card Market Trends and Drivers

The gift card market in North America is experiencing significant growth and transformation, propelled by a confluence of factors and emerging trends. One of the most notable shifts is the transition from traditional plastic cards to digital formats, such as e-Gift cards and mobile gift cards. This change is largely driven by the increasing usage of mobile devices and the expansion of internet connectivity. Additionally, the widespread adoption of smartphones and digital wallets has opened up new opportunities in the gift card sector, making it easier for consumers to send and receive gift cards, thus fueling market expansion.

Government initiatives across countries like the United States and Canada have played a pivotal role in promoting digital payments. These efforts are not only bolstering the use of digital gift cards but also enhancing their appeal due to the convenience, flexibility, reliability, and security they offer. Furthermore, corporate institutions are increasingly favoring gift cards over cash for employee rewards and incentives, further contributing to the market’s growth.

Seasonal factors also significantly impact the North American gift card market. Regional holiday seasons and gift-giving occasions, such as Christmas, create a surge in demand for gift cards during specific times of the year. Moreover, the market is witnessing a rising demand from millennials, who are drawn to the convenience and social aspects of online gift giving.

Lastly, technological advancements and innovations are continuously shaping the gift card market. The market is segmented by card type, with closed-loop cards currently leading. However, the ongoing technological evolution, especially in the realm of smartphones and digital wallets, is anticipated to foster further growth and diversification in the gift card market in the foreseeable future.

North America Gift Card Market Restraints

The North American gift card market faces several challenges that could potentially restrain its growth. A primary concern is the issue of unredeemed balances, where a significant portion of the value on gift cards remains unused, leading to revenue liabilities for companies and potential legal complexities under various state laws regarding unclaimed property. Market saturation also poses a threat, as the increasingly competitive landscape of the gift card industry approaches a point of limited growth potential. Additionally, the necessity of adhering to regulatory compliance, including consumer protection and escheatment laws, presents operational challenges for market players. Economic downturns further impact the market, as consumers typically curtail discretionary spending, including the purchase and use of gift cards. Finally, security concerns, despite the existing safeguards, continue to affect consumer confidence due to fears of fraud and misuse. These factors collectively contribute to the limitations and challenges faced by the gift card market in North America, impacting its overall growth trajectory.

Competitive Analysis

The North America Gift Card market is witnessing substantial growth and is characterized by the presence of several major market players. The key players profiled in the North America Gift Card market analysis include,

  • Blackhawk Network Holdings, Inc.
  • Com Inc
  • American Express Company
  • Fiserv Inc
  • PayPal Inc
  • InComm Payments
  • Givex Corporation

These companies are focusing on implementing strategies such as product innovations, mergers, acquisitions, joint ventures, alliances, and partnerships to improve their market position.

Regional Insights

In the North American gift card market, the United States holds a dominant position, characterized by high consumer spending, advanced technology, and a robust retail sector. This region is particularly receptive to digital and mobile gift card solutions, reflecting the widespread use of smartphones and a preference for online shopping. The trend towards personalization and customization of gift cards is notable in the U.S., catering to a diverse range of consumer preferences. Furthermore, the corporate sector in the United States frequently employs gift cards as a tool for employee incentives and customer loyalty programs, significantly contributing to the market’s expansion.

In contrast, the Canadian gift card market, while smaller in comparison, exhibits steady growth with a balanced focus on both physical and digital card formats. Canadian consumers show a strong preference for multi-store gift cards, which offer more flexibility and a wider range of choices. The market is also shaped by specific governmental regulations and consumer protection laws related to gift cards. Seasonal trends play a significant role in Canada, with increased demand during holiday periods like Christmas and Boxing Day. Across both the United States and Canada, there is a common shift towards digital and e-Gift cards, driven by a demand for convenience, speed, and security in transactions. Additionally, both regions are continuously adapting to regulatory changes and evolving consumer protection laws, which have a substantial impact on the gift card market dynamics.

Interesting Facts about the North America Gift Card Market

The gift card market in North America is not only experiencing substantial growth but is also poised for continued expansion in the coming years. Some key facts and figures underscore this trend:

  • The global gift card market is on a trajectory to achieve a remarkable market value of USD 1897.46 Billion by 2030. Notably, North America and Europe combined accounted for over 70% of the global gift card sales in 2020, underscoring their significant contribution to the industry.
  • Within this context, North America emerges as the highest revenue contributor to the global gift card market. The region is projected to grow at a compound annual growth rate (CAGR) of 10.33% over the forecast period, indicating a robust and upward market trajectory.
  • E-gift cards, in particular, saw a dramatic increase of 80.7% in November compared to the figures from 2019, reflecting a shifting preference towards digital formats.
  • Gift cards are a popular choice among American consumers, with 93% reporting that they have either given or sent a gift card. Birthdays and holiday seasons are the most common occasions, with 74% using gift cards for birthdays and 55% during holiday periods.
  • On average, consumers tend to spend about $26 per gift card. Interestingly, a significant portion of consumers, approximately 60% as reported by Statista, often end up spending more than the card’s face value upon redemption.
  • The open-loop gift card segment, which allows broader usage across various retailers and services, accounts for 66% of the market. This indicates its dominant role and influence within the gift card industry.
  • The concentration of gift card sales in North America and Europe is particularly notable, with over 70% of sales originating from these regions. This highlights the immense potential and market strength of the gift card industry in North America and Europe.

Notable developments within the industry include:

In April 2022, Black Network, a prominent player in the global branded payments market, made a significant announcement regarding its partnership with Bitski, a leading company in NFT and blockchain wallet services. This collaboration marked a notable milestone in the digital assets space, as they introduced the world’s first NFT promotion that can be accessed through the purchase of a gift card. This innovative offering seamlessly integrates real-world value with virtual, Web3 benefits, representing a groundbreaking development in the realm of digital and virtual asset transactions.

In June 2022, Blackhawk Network, in partnership with LibertyX, unveiled a new initiative to make cryptocurrency more approachable for consumers. This initiative enables customers to purchase bitcoin through their LibertyX accounts at select U.S. merchants. The participating retailers in this program include a range of well-known supermarket chains such as Fresco y Mas, Harveys Supermarkets, Southeastern Grocers, Tops, Weis, and Winn-Dixie. This move significantly expands the reach and convenience of cryptocurrency transactions, allowing for broader consumer engagement in the growing digital currency market.

Shape Your Report to Specific Countries or Regions & Enjoy 30% Off!

Market Segmentations

North America Gift Cards Market – By Material Merchant Type

  • Restaurants
  • Department Stores
  • Grocery Stores
  • Supermarkets/Hypermarkets
  • Discount Stores
  • Coffee Shops
  • Entertainments
  • Salons/Spa
  • Book Stores
  • Home Décor Stores
  • Gas Stations
  • Visa/Master Card/American Express Gift Cards
  • Others

North America Gift Cards Market – By Merchant Type

  • Universal Accepted Open Loop
  • Restaurant Closed Loop
  • Retail Closed Loop
  • Miscellaneous Closed Loop
  • E-Gifting

North America Gift Cards Market – By End User

  • Business
  • Individuals

North America Gift Cards Market – By Price Range

  • High (Above 400 US$)
  • Medium (200-400 US$)
  • Low (0-200 US$)

By Countries

  • US
  • Canada

Table of Content

Chapter No. 1 : Introduction.. 23

1.1. Report Description. 23

1.1.1. Purpose of the Report 23

1.1.2. USP & Key Offerings. 23

1.2. Key Benefits for Stakeholders. 23

1.3. Target Audience. 24

1.4. Report Scope 25

Chapter No. 2 : Executive Summary. 27

2.1. Gift Cards Market Snapshot. 27

2.2. North America Gift Cards Market, 2017 – 2022 (USD Billion) 28

Chapter No. 3 : Impact Analysis of COVID 19 & Russia-U.S.raine War on Gift Cards Market. 29

3.1. Impact Assessment of COVID-19 Pandemic, By Region. 29

3.1.1. Supply chain disruptions. 29

3.1.2. Shift in Consumer Behavior. 29

3.1.3. E-Commerce Growth. 29

3.1.4. Industry-Specific Impacts. 29

3.1.5. Business Gifting. 29

3.2. Russia-U.S.raine War Impacts. 30

3.2.1. Uncertainty and economic instability. 30

3.2.2. Currency Fluctuations. 30

3.2.3. Cross-Border Trade. 30

3.2.4. Tourism and Travel 30

3.2.1. Market Sentiment 30

Chapter No. 4 : Gift Cards Market – Industry Analysis. 31

4.1. Introduction 31

4.2. Market Drivers 32

4.2.1. Enhanced Sales for Retailers and Convenience to Buyers 32

4.2.2. Steadily Rising Foodservice Sector Worldwide. 33

4.2.3. Consistently Growing Retail Industry Worldwide. 33

4.3. Market Restraints. 35

4.3.1. Growing instances of gift card hacking by the fraudsters. 35

4.3.2. Economic Uncertainty. 35

4.4. Market Opportunities. 37

4.4.1. Rise of Digital Gift Cards. 37

4.4.2. Use of Packaged Gift Cards. 37

4.5. Buying Criteria 38

Chapter No. 5 : Analysis Competitive Landscape. 39

5.1. Company Market Share Analysis – 2022. 39

5.1.1. North America Gift Cards Market: Company Market Share, by Revenue2022. 39

5.1.2. North America Gift Cards Market: Top 6 Company Market Share, by Revenue2022. 39

5.1.3. North America Gift Cards Market: Top 3 Company Market Share, by Revenue2022. 40

5.1. North America Gift Cards Market Company Revenue Market Share, 2022 41

5.2. Strategic Developments. 42

5.2.1. Acquisitions & Mergers, Partnerships and New Product Launch. 42

5.3. Key Players Product Matrix. 44

Chapter No. 6 : PESTEL & Adjacent Market Analysis. 48

6.1. PESTEL 48

6.1.1. Political Factors. 48

6.1.2. Economic Factors. 48

6.1.3. Social Factors. 48

6.1.4. Technological Factors. 48

6.1.5. Environmental Factors. 49

6.1.6. Legal Factors. 49

6.2. Adjacent Market Analysis. 49

Chapter No. 7 : Gift Cards Market – By Type Segment Analysis. 52

7.1. Gift Cards Market Overview, by Type Segment. 52

7.1.1. Gift Cards Market Revenue Share, By Type, 2022 & 2030 52

7.1.2. Gift Cards Market Attractiveness Analysis, By Type. 54

7.1.3. Incremental Revenue Growth Opportunity, by Type, 2023 – 2030. 54

7.1.4. Gift Cards Market Revenue, By Type, 2017, 2022, 2026 & 2030. 55

7.2. Open Loop 56

7.2.1. North America Open Loop Gift Cards Market Revenue, By Region, 2017 – 2022 (USD Billion) 57

7.2.2. North America Open Loop Gift Cards Market Revenue, By Region, 2017 – 2022 (USD Billion) 57

7.3. Closed Loop 58

7.3.1. North America Closed Loop Gift Cards Market Revenue, By Region, 2017 – 2022 (USD Billion) 59

7.3.2. North America Closed Loop Gift Cards Market Revenue, By Region, 2017 – 2022 (USD Billion) 59

7.4. E-Gifting 60

7.4.1. North America E-Gifting Gift Cards Market Revenue, By Region, 2017 – 2022 (USD Billion) 61

7.4.2. North America E-Gifting Gift Cards Market Revenue, By Region, 2017 – 2022 (USD Billion) 61

7.5. Others 62

7.5.1. North America Others Gift Cards Market Revenue, By Region, 2017 – 2022 (USD Billion) 63

7.5.2. North America Others Gift Cards Market Revenue, By Region, 2017 – 2022 (USD Billion) 63

Chapter No. 8 : Gift Cards Market – By Merchant Type Segment Analysis. 64

8.1. Gift Cards Market Overview, by Merchant Type Segment. 64

8.1.1. Gift Cards Market Revenue Share, By Merchant Type, 2022 & 2030. 64

8.1.2. Gift Cards Market Attractiveness Analysis, By Merchant Type. 67

8.1.3. Incremental Revenue Growth Opportunity, by Merchant Type, 2023 – 2030. 67

8.1.4. Gift Cards Market Revenue, By Merchant Type, 2017, 2022, 2026 & 2030. 68

8.2. Restaurants 69

8.2.1. North America Restaurants Gift Cards Market Revenue, By Region, 2017 – 2022 (USD Billion) 70

8.2.2. North America Restaurants Gift Cards Market Revenue, By Region, 2017 – 2022 (USD Billion) 70

8.3. Discount Stores 71

8.3.1. North America Discount Stores Gift Cards Market Revenue, By Region, 2017 – 2022 (USD Billion) 72

8.3.2. North America Discount Stores Gift Cards Market Revenue, By Region, 2017 – 2022 (USD Billion) 72

8.4. Supermarkets/Hypermarkets. 73

8.4.1. North America Supermarkets/Hypermarkets Gift Cards Market Revenue, By Region, 2017 – 2022 (USD Billion) 74

8.4.2. North America Supermarkets/Hypermarkets Gift Cards Market Revenue, By Region, 2017 – 2022 (USD Billion) 74

8.5. Coffee Shops 75

8.5.1. North America Coffee Shops Gift Cards Market Revenue, By Region, 2017 – 2022 (USD Billion) 76

8.5.2. North America Coffee Shops Gift Cards Market Revenue, By Region, 2017 – 2022 (USD Billion) 76

8.6. Others 77

8.6.1. North America Others Gift Cards Market Revenue, By Region, 2017 – 2022 (USD Billion) 78

8.6.2. North America Others Gift Cards Market Revenue, By Region, 2017 – 2022 (USD Billion) 78

Chapter No. 9 : Gift Cards Market – By End-user Segment Analysis. 79

9.1. Gift Cards Market Overview, by End-user Segment. 79

9.1.1. Gift Cards Market Revenue Share, By End-user, 2022 & 2030 79

9.1.2. Gift Cards Market Attractiveness Analysis, By End-user 80

9.1.3. Incremental Revenue Growth Opportunity, by End-user, 2023 – 2030. 80

9.1.4. Gift Cards Market Revenue, By End-user, 2017, 2022, 2026 & 2030. 81

9.2. Business 82

9.2.1. North America Business Gift Cards Market Revenue, By Region, 2017 – 2022 (USD Billion) 83

9.2.2. North America Business Gift Cards Market Revenue, By Region, 2017 – 2022 (USD Billion) 83

9.3. Individuals 84

9.3.1. North America Individuals Gift Cards Market Revenue, By Region, 2017 – 2022 (USD Billion) 85

9.3.2. North America Individuals Gift Cards Market Revenue, By Region, 2017 – 2022 (USD Billion) 85

Chapter No. 10 :…….. Gift Cards Market – By Price Range Segment Analysis. 86

10.1. Gift Cards Market Overview, by Price Range Segment. 86

10.1.1. Gift Cards Market Revenue Share, By Price Range, 2022 & 2030. 86

10.1.2. Gift Cards Market Attractiveness Analysis, By Price Range 87

10.1.3. Incremental Revenue Growth Opportunity, by Price Range, 2023 – 2030. 87

10.1.4. Gift Cards Market Revenue, By Price Range, 2017, 2022, 2026 & 2030. 88

10.2. High (Above 400 US$) 89

10.2.1. North America High (Above 400 US$) Gift Cards Market Revenue, By Region, 2017 – 2022 (USD Billion) 90

10.2.2. North America High (Above 400 US$) Gift Cards Market Revenue, By Region, 2017 – 2022 (USD Billion) 90

10.3. Medium (200-400 US$) 91

10.3.1. North America Medium (200-400 US$) Gift Cards Market Revenue, By Region, 2017 – 2022 (USD Billion) 92

10.3.2. North America Medium (200-400 US$) Gift Cards Market Revenue, By Region, 2017 – 2022 (USD Billion) 92

10.4. Low 93

10.4.1. North America Low Gift Cards Market Revenue, By Region, 2017 – 2022 (USD Billion) 94

10.4.2. North America Low Gift Cards Market Revenue, By Region, 2017 – 2022 (USD Billion) 94

Chapter No. 11 :…….. Gift Cards Market – Regional Analysis. 95

11.1. Gift Cards Market Overview, by Regional Segments. 95

11.2. Region 95

11.2.1. North America Gift Cards Market Revenue Share, By Region, 2022 & 2030. 95

11.2.2. Gift Cards Market Attractiveness Analysis, By Region. 96

11.2.3. Incremental Revenue Growth Opportunity, by Region, 2023 – 2030. 96

11.2.4. Gift Cards Market Revenue, By Region, 2017, 2022, 2026 & 2030. 97

11.2.5. North America Gift Cards Market Revenue, By Region, 2017 – 2022 (USD Billion) 98

11.2.6. North America Gift Cards Market Revenue, By Region, 2023 – 2030 (USD Billion) 98

11.3. Type 99

11.3.1. North America Gift Cards Market Revenue, By Type, 2017 – 2022 (USD Billion) 99

11.3.2. North America Gift Cards Market Revenue, By Type, 2023 – 2030 (USD Billion) 99

11.4. Merchant Type 100

11.4.1. North America Gift Cards Market Revenue, By Merchant Type, 2017 – 2022 (USD Billion) 100

11.4.2. North America Gift Cards Market Revenue, By Merchant Type, 2023 – 2030 (USD Billion) 100

11.5. End-user 101

11.5.1. North America Gift Cards Market Revenue, By End-user, 2017 – 2022 (USD Billion) 101

11.5.2. North America Gift Cards Market Revenue, By End-user, 2023 – 2030 (USD Billion) 101

11.6. Price Range 102

11.6.1. North America Gift Cards Market Revenue, By Price Range, 2017 – 2022 (USD Billion) 102

11.6.2. North America Gift Cards Market Revenue, By Price Range, 2023 – 2030 (USD Billion) 102

Chapter No. 12 :…….. Gift Cards Market – North America.. 103

12.1. North America 103

Key Highlights. 103

12.1.1. North America Gift Cards Market Revenue, By Country, 2017 – 2022 (USD Billion) 105

12.1.2. North America Gift Cards Market Revenue, By Type, 2017 – 2020 (USD Billion) 106

12.1.3. North America Gift Cards Market Revenue, By Merchant Type, 2017 – 2030 (USD Billion) 107

12.1.4. North America Gift Cards Market Revenue, By End-user, 2017 – 2030 (USD Billion) 108

12.1.5. North America Gift Cards Market Revenue, By Price Range, 2017 – 2030 (USD Billion) 109

12.2. U.S. 110

12.2.1. U.S. Gift Cards Market Revenue, By Type, 2017 – 2020 (USD Billion) 110

12.2.2. U.S. Gift Cards Market Revenue, By Merchant Type, 2017 – 2030 (USD Billion) 111

12.2.3. U.S. Gift Cards Market Revenue, By End-user, 2017 – 2030 (USD Billion) 112

12.2.4. U.S. Gift Cards Market Revenue, By Price Range, 2017 – 2030 (USD Billion) 113

12.3. Canada 114

12.3.1. Canada Gift Cards Market Revenue, By Type, 2017 – 2020 (USD Billion) 114

12.3.2. Canada Gift Cards Market Revenue, By Merchant Type, 2017 – 2030 (USD Billion) 115

12.3.3. Canada Gift Cards Market Revenue, By End-user, 2017 – 2030 (USD Billion) 116

12.3.4. Canada Gift Cards Market Revenue, By Price Range, 2017 – 2030 (USD Billion) 117

12.4. Mexico 118

12.4.1. Mexico Gift Cards Market Revenue, By Type, 2017 – 2020 (USD Billion) 118

12.4.2. Mexico Gift Cards Market Revenue, By Merchant Type, 2017 – 2030 (USD Billion) 119

12.4.3. Mexico Gift Cards Market Revenue, By End-user, 2017 – 2030 (USD Billion) 120

12.4.4. Mexico Gift Cards Market Revenue, By Price Range, 2017 – 2030 (USD Billion) 121

Chapter No. 13 :…….. Company Profiles. 122

13.1. Amazon.com, Inc. 122

13.1.1. Company Overview.. 122

13.1.2. Product Portfolio. 123

13.1.3. Financial Overview.. 123

13.2. Apple Inc. 124

13.2.1. Company Overview.. 124

13.2.2. Product Portfolio. 125

13.2.3. Financial Overview.. 125

13.3. Best Buy Co., Inc. 126

13.3.1. Company Overview.. 126

13.3.2. Product Portfolio. 127

13.3.3. Financial Overview.. 128

13.4. Blackhawk Network Holdings, Inc. 129

13.4.1. Company Overview.. 129

13.4.2. Product Portfolio. 130

13.4.3. Financial Overview.. 130

13.5. Edenred 131

13.5.1. Company Overview.. 131

13.5.2. Product Portfolio. 132

13.5.3. Financial Overview.. 132

13.6. North America Payments Direct, Inc. 133

13.6.1. Company Overview.. 133

13.6.2. Product Portfolio. 134

13.6.3. Financial Overview.. 134

13.7. First Data Corporation. 135

13.7.1. Company Overview.. 135

13.7.2. Product Portfolio. 136

13.7.3. Financial Overview.. 136

13.8. InComm Payments™.. 137

13.8.1. Company Overview.. 137

13.8.2. Product Portfolio. 138

13.8.3. Financial Overview.. 139

13.9. NGC US, LLC. 140

13.9.1. Company Overview.. 140

13.9.2. Product Portfolio. 141

13.9.3. Financial Overview.. 141

13.10. Qwikcilver Solutions Pvt. Ltd. 142

13.10.1. Company Overview.. 142

13.10.2. Product Portfolio. 143

13.10.3. Financial Overview.. 143

13.11. Starbucks Corporation. 144

13.11.1. Company Overview.. 144

13.11.2. Product Portfolio. 145

13.11.3. Financial Overview.. 145

13.12. Target Corporation. 146

13.12.1. Company Overview.. 146

13.12.2. Product Portfolio. 147

13.12.3. Financial Overview.. 147

Chapter No. 14 :…….. Research Methodology. 148

14.1. Research Methodology. 148

14.2. Phase I – Secondary Research. 149

14.3. Phase II – Data Modeling. 149

14.3.1. Company Share Analysis Model 150

14.3.2. Revenue Based Modeling. 150

14.4. Phase III – Primary Research. 151

14.5. Research Limitations. 152

14.5.1. Assumptions. 152


List of Figures

FIG NO. 1. North America Gift Cards Market Revenue, 2017 – 2022 (USD Billion) 28

FIG NO. 2. Company Share Analysis, 2022. 39

FIG NO. 3. Company Share Analysis, 2022. 39

FIG NO. 4. Company Share Analysis, 2022. 40

FIG NO. 5. Gift Cards Market – Company Revenue Market Share, 2022. 41

FIG NO. 6. Gift Cards Market Revenue Share, By Type, 2022 & 2030. 52

FIG NO. 7. Market Attractiveness Analysis, By Type. 54

FIG NO. 8. Incremental Revenue Growth Opportunity by Type. 54

FIG NO. 9. Gift Cards Market Revenue, By Type, 2017, 2022, 2026 & 2030. 55

FIG NO. 10……… North America Gift Cards Market for Open Loop, Revenue (USD Billion) 2017 – 2030. 56

FIG NO. 11……… North America Gift Cards Market for Closed Loop, Revenue (USD Billion) 2017 – 2030. 58

FIG NO. 12……… North America Gift Cards Market for E-Gifting, Revenue (USD Billion) 2017 – 2030. 60

FIG NO. 13……… North America Gift Cards Market for Others, Revenue (USD Billion) 2017 – 2030. 62

FIG NO. 14……… Gift Cards Market Revenue Share, By Merchant Type, 2022 & 2030. 64

FIG NO. 15……… Market Attractiveness Analysis, By Merchant Type. 67

FIG NO. 16……… Incremental Revenue Growth Opportunity by Merchant Type. 67

FIG NO. 17……… Gift Cards Market Revenue, By Merchant Type, 2017, 2022, 2026 & 2030. 68

FIG NO. 18……… North America Gift Cards Market for Restaurants, Revenue (USD Billion) 2017 – 2030. 69

FIG NO. 19……… North America Gift Cards Market for Discount Stores, Revenue (USD Billion) 2017 – 2030. 71

FIG NO. 20……… North America Gift Cards Market for Supermarkets/Hypermarkets, Revenue (USD Billion) 2017 – 2030. 73

FIG NO. 21……… North America Gift Cards Market for Coffee Shops, Revenue (USD Billion) 2017 – 2030. 75

FIG NO. 22……… North America Gift Cards Market for Others, Revenue (USD Billion) 2017 – 2030. 77

FIG NO. 23……… Gift Cards Market Revenue Share, By End-user, 2022 & 2030. 79

FIG NO. 24……… Market Attractiveness Analysis, By End-user 80

FIG NO. 25……… Incremental Revenue Growth Opportunity by End-user 80

FIG NO. 26……… Gift Cards Market Revenue, By End-user, 2017, 2022, 2026 & 2030. 81

FIG NO. 27……… North America Gift Cards Market for Business, Revenue (USD Billion) 2017 – 2030. 82

FIG NO. 28……… North America Gift Cards Market for Individuals, Revenue (USD Billion) 2017 – 2030. 84

FIG NO. 29……… Gift Cards Market Revenue Share, By Price Range, 2022 & 2030. 86

FIG NO. 30……… Market Attractiveness Analysis, By Price Range. 87

FIG NO. 31……… Incremental Revenue Growth Opportunity by Price Range. 87

FIG NO. 32……… Gift Cards Market Revenue, By Price Range, 2017, 2022, 2026 & 2030. 88

FIG NO. 33……… North America Gift Cards Market for High (Above 400 US$), Revenue (USD Billion) 2017 – 2030. 89

FIG NO. 34……… North America Gift Cards Market for Medium (200-400 US$), Revenue (USD Billion) 2017 – 2030. 91

FIG NO. 35……… North America Gift Cards Market for Low, Revenue (USD Billion) 2017 – 2030. 93

FIG NO. 36……… North America Gift Cards Market Revenue Share, By Region, 2022 & 2030. 95

FIG NO. 37……… Market Attractiveness Analysis, By Region. 96

FIG NO. 38……… Incremental Revenue Growth Opportunity by Region. 96

FIG NO. 39……… Gift Cards Market Revenue, By Region, 2017, 2022, 2026 & 2030. 97

FIG NO. 40……… North America Gift Cards Market Revenue, 2017 – 2022 (USD Billion) 103

FIG NO. 41……… Research Methodology – Detailed View.. 148

FIG NO. 42……… Research Methodology. 149


List of Tables

TABLE NO. 1. :…. North America Gift Cards Market: Snapshot 25

TABLE NO. 2. :…. Drivers for the Gift Cards Market: Impact Analysis. 30

TABLE NO. 3. :…. Restraints for the Gift Cards Market: Impact Analysis. 33

TABLE NO. 4. :…. North America Open Loop Gift Cards Market Revenue, By Region, 2017 – 2022 (USD Billion) 55

TABLE NO. 5. :…. North America Open Loop Gift Cards Market Revenue, By Region, 2023– 2030 (USD Billion) 55

TABLE NO. 6. :…. North America Closed Loop Gift Cards Market Revenue, By Region, 2017 – 2022 (USD Billion) 57

TABLE NO. 7. :…. North America Closed Loop Gift Cards Market Revenue, By Region, 2023– 2030 (USD Billion) 57

TABLE NO. 8. :…. North America E-Gifting Gift Cards Market Revenue, By Region, 2017 – 2022 (USD Billion) 59

TABLE NO. 9. :…. North America E-Gifting Gift Cards Market Revenue, By Region, 2023– 2030 (USD Billion) 59

TABLE NO. 10. :.. North America Others Gift Cards Market Revenue, By Region, 2017 – 2022 (USD Billion) 61

TABLE NO. 11. :.. North America Others Gift Cards Market Revenue, By Region, 2023– 2030 (USD Billion) 61

TABLE NO. 12. :.. North America Restaurants Gift Cards Market Revenue, By Region, 2017 – 2022 (USD Billion) 68

TABLE NO. 13. :.. North America Restaurants Gift Cards Market Revenue, By Region, 2023– 2030 (USD Billion) 68

TABLE NO. 14. :.. North America Discount Stores Gift Cards Market Revenue, By Region, 2017 – 2022 (USD Billion) 70

TABLE NO. 15. :.. North America Discount Stores Gift Cards Market Revenue, By Region, 2023– 2030 (USD Billion) 70

TABLE NO. 16. :.. North America Supermarkets/Hypermarkets Gift Cards Market Revenue, By Region, 2017 – 2022 (USD Billion) 72

TABLE NO. 17. :.. North America Supermarkets/Hypermarkets Gift Cards Market Revenue, By Region, 2023– 2030 (USD Billion) 72

TABLE NO. 18. :.. North America Coffee Shops Gift Cards Market Revenue, By Region, 2017 – 2022 (USD Billion) 74

TABLE NO. 19. :.. North America Coffee Shops Gift Cards Market Revenue, By Region, 2023– 2030 (USD Billion) 74

TABLE NO. 20. :.. North America Others Gift Cards Market Revenue, By Region, 2017 – 2022 (USD Billion) 76

TABLE NO. 21. :.. North America Others Gift Cards Market Revenue, By Region, 2023– 2030 (USD Billion) 76

TABLE NO. 22. :.. North America Business Gift Cards Market Revenue, By Region, 2017 – 2022 (USD Billion) 81

TABLE NO. 23. :.. North America Business Gift Cards Market Revenue, By Region, 2023– 2030 (USD Billion) 81

TABLE NO. 24. :.. North America Individuals Gift Cards Market Revenue, By Region, 2017 – 2022 (USD Billion) 83

TABLE NO. 25. :.. North America Individuals Gift Cards Market Revenue, By Region, 2023– 2030 (USD Billion) 83

TABLE NO. 26. :.. North America High (Above 400 US$) Gift Cards Market Revenue, By Region, 2017 – 2022 (USD Billion) 88

TABLE NO. 27. :.. North America High (Above 400 US$) Gift Cards Market Revenue, By Region, 2023– 2030 (USD Billion) 88

TABLE NO. 28. :.. North America Medium (200-400 US$) Gift Cards Market Revenue, By Region, 2017 – 2022 (USD Billion) 90

TABLE NO. 29. :.. North America Medium (200-400 US$) Gift Cards Market Revenue, By Region, 2023– 2030 (USD Billion) 90

TABLE NO. 30. :.. North America Low Gift Cards Market Revenue, By Region, 2017 – 2022 (USD Billion) 92

TABLE NO. 31. :.. North America Low Gift Cards Market Revenue, By Region, 2023– 2030 (USD Billion) 92

TABLE NO. 32. :.. North America Gift Cards Market Revenue, By Region, 2017 – 2022 (USD Billion) 96

TABLE NO. 33. :.. North America Gift Cards Market Revenue, By Region, 2023– 2030 (USD Billion) 96

TABLE NO. 34. :.. North America Gift Cards Market Revenue, By Type, 2017 – 2022 (USD Billion) 97

TABLE NO. 35. :.. North America Gift Cards Market Revenue, By Type, 2023– 2030 (USD Billion) 97

TABLE NO. 36. :.. North America Gift Cards Market Revenue, By Merchant Type, 2017 – 2022 (USD Billion) 98

TABLE NO. 37. :.. North America Gift Cards Market Revenue, By Merchant Type, 2023– 2030 (USD Billion) 98

TABLE NO. 38. :.. North America Gift Cards Market Revenue, By End-user, 2017 – 2022 (USD Billion) 99

TABLE NO. 39. :.. North America Gift Cards Market Revenue, By End-user, 2023– 2030 (USD Billion) 99

TABLE NO. 40. :.. North America Gift Cards Market Revenue, By Price Range, 2017 – 2022 (USD Billion) 100

TABLE NO. 41. :.. North America Gift Cards Market Revenue, By Price Range, 2023– 2030 (USD Billion) 100

TABLE NO. 42. :.. North America Gift Cards Market Revenue, By Country, 2017 – 2022 (USD Billion) 103

TABLE NO. 43. :.. North America Gift Cards Market Revenue, By Country, 2023– 2030 (USD Billion) 103

TABLE NO. 44. :.. North America Gift Cards Market Revenue, By Type, 2017 – 2022 (USD Billion) 104

TABLE NO. 45. :.. North America Gift Cards Market Revenue, By Type, 2023– 2030 (USD Billion) 104

TABLE NO. 46. :.. North America Gift Cards Market Revenue, By Merchant Type, 2017 – 2022 (USD Billion) 105

TABLE NO. 47. :.. North America Gift Cards Market Revenue, By Merchant Type, 2023– 2030 (USD Billion) 105

TABLE NO. 48. :.. North America Gift Cards Market Revenue, By End-user, 2017 – 2022 (USD Billion) 106

TABLE NO. 49. :.. North America Gift Cards Market Revenue, By End-user, 2023– 2030 (USD Billion) 106

TABLE NO. 50. :.. North America Gift Cards Market Revenue, By Price Range, 2017 – 2022 (USD Billion) 107

TABLE NO. 51. :.. North America Gift Cards Market Revenue, By Price Range, 2023– 2030 (USD Billion) 107

TABLE NO. 52. :.. U.S. Gift Cards Market Revenue, By Type, 2017 – 2022 (USD Billion) 108

TABLE NO. 53. :.. U.S. Gift Cards Market Revenue, By Type, 2023– 2030 (USD Billion) 108

TABLE NO. 54. :.. U.S. Gift Cards Market Revenue, By Merchant Type, 2017 – 2022 (USD Billion) 109

TABLE NO. 55. :.. U.S. Gift Cards Market Revenue, By Merchant Type, 2023– 2030 (USD Billion) 109

TABLE NO. 56. :.. U.S. Gift Cards Market Revenue, By End-user, 2017 – 2022 (USD Billion) 110

TABLE NO. 57. :.. U.S. Gift Cards Market Revenue, By End-user, 2023– 2030 (USD Billion) 110

TABLE NO. 58. :.. U.S. Gift Cards Market Revenue, By Price Range, 2017 – 2022 (USD Billion) 111

TABLE NO. 59. :.. U.S. Gift Cards Market Revenue, By Price Range, 2023– 2030 (USD Billion) 111

TABLE NO. 60. :.. Canada Gift Cards Market Revenue, By Type, 2017 – 2022 (USD Billion) 112

TABLE NO. 61. :.. Canada Gift Cards Market Revenue, By Type, 2023– 2030 (USD Billion) 112

TABLE NO. 62. :.. Canada Gift Cards Market Revenue, By Merchant Type, 2017 – 2022 (USD Billion) 113

TABLE NO. 63. :.. Canada Gift Cards Market Revenue, By Merchant Type, 2023– 2030 (USD Billion) 113

TABLE NO. 64. :.. Canada Gift Cards Market Revenue, By End-user, 2017 – 2022 (USD Billion) 114

TABLE NO. 65. :.. Canada Gift Cards Market Revenue, By End-user, 2023– 2030 (USD Billion) 114

TABLE NO. 66. :.. Canada Gift Cards Market Revenue, By Price Range, 2017 – 2022 (USD Billion) 115

TABLE NO. 67. :.. Canada Gift Cards Market Revenue, By Price Range, 2023– 2030 (USD Billion) 115

TABLE NO. 68. :.. Mexico Gift Cards Market Revenue, By Type, 2017 – 2022 (USD Billion) 116

TABLE NO. 69. :.. Mexico Gift Cards Market Revenue, By Type, 2023– 2030 (USD Billion) 116

TABLE NO. 70. :.. Mexico Gift Cards Market Revenue, By Merchant Type, 2017 – 2022 (USD Billion) 117

TABLE NO. 71. :.. Mexico Gift Cards Market Revenue, By Merchant Type, 2023– 2030 (USD Billion) 117

TABLE NO. 72. :.. Mexico Gift Cards Market Revenue, By End-user, 2017 – 2022 (USD Billion) 118

TABLE NO. 73. :.. Mexico Gift Cards Market Revenue, By End-user, 2023– 2030 (USD Billion) 118

TABLE NO. 74. :.. Mexico Gift Cards Market Revenue, By Price Range, 2017 – 2022 (USD Billion) 119

TABLE NO. 75. :.. Mexico Gift Cards Market Revenue, By Price Range, 2023– 2030 (USD Billion) 119


What is the projected growth rate of the North American Gift Cards Market?

The North American Gift Cards Market is expected to grow at a significant CAGR of 10.33% in the coming years, with the market value projected to reach USD 896.33 Billion by 2030 from USD 390.05 Billion in 2022.

How is the North American gift card market segmented?

The market is segmented by country and card type, with the US and Canada being the major players and closed-loop cards dominating the market. This segmentation reflects the diverse applications and preferences within the market.

What factors are driving the growth of the North American gift card market?

Key factors include the shift from traditional plastic cards to digital formats like e-Gift cards and mobile gift cards, government initiatives promoting digital payments, corporate adoption for rewards, and technological innovations in digital wallets and mobile devices.

How do seasonal factors and consumer demographics impact the North American gift card market?

Seasonal factors, such as holiday seasons and gift-giving occasions, significantly boost gift card demand. Additionally, the rising demand from millennials, drawn to the convenience and social aspects of online gift giving, is also shaping market trends.

Eco-friendly Furniture Market

Published:
Report ID: 37489

Electric Guitars Market

Published:
Report ID: 37121

United Kingdom Toothpaste Tablet Market

Published:
Report ID: 36979

Electronic Cigarettes Market

Published:
Report ID: 36948

Soy Protein Ingredients Market

Published:
Report ID: 9445

Wine Corks Market

Published:
Report ID: 36862

Bag in Box Market

Published:
Report ID: 2124

Towel Warmers Market

Published:
Report ID: 36800

Fermented Tea Market

Published:
Report ID: 36734

Luxury Bath and Body Products Market

Published:
Report ID: 36700

Lint Remover Market

Published:
Report ID: 36697

Dishwashing Detergent Market

Published:
Report ID: 36688

Purchase Options

$1999
Delivery Format: Excel.
$2999
Designed for the individual purchaser.
$3999
Users located at a single corporate site or regional office.
$4999
Allowed for unlimited sharing globally within one company.
Smallform of Sample request

Have a question?

User Profile

Don’t settle for less – trust Mitul to help you find the best solution.

Report delivery within 24 to 48 hours

– Other Info –

What people say?-

User Review

I am very impressed with the information in this report. The author clearly did their research when they came up with this product and it has already given me a lot of ideas.

Jana Schmidt
CEDAR CX Technologies

– Connect with us –

Phone

+91 6232 49 3207


support

24/7 Research Support


sales@credenceresearch.com

– Research Methodology –

Going beyond the basics: advanced techniques in research methodology

– Trusted By –

Pepshi, LG, Nestle
Motorola, Honeywell, Johnson and johnson
LG Chem, SIEMENS, Pfizer
Unilever, Samsonite, QIAGEN