Market Overview
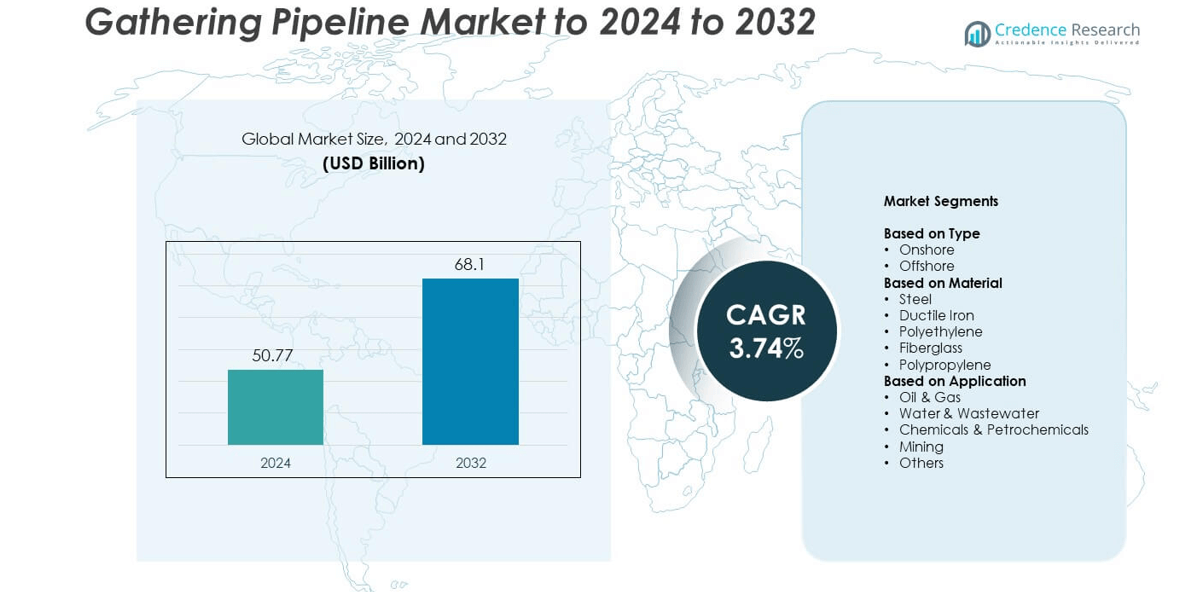
Gathering Pipeline Market size was valued at USD 50.77 Billion in 2024 and is anticipated to reach USD 68.1 Billion by 2032, at a CAGR of 3.74% during the forecast period.
| REPORT ATTRIBUTE |
DETAILS |
| Historical Period |
2020-2023 |
| Base Year |
2024 |
| Forecast Period |
2025-2032 |
| Gathering Pipeline Market Size 2024 |
USD 50.77 Billion |
| Gathering Pipeline Market, CAGR |
3.74% |
| Gathering Pipeline Market Size 2032 |
USD 68.1 Billion |
The gathering pipeline market is led by major players such as McDermott International, TechnipFMC, Subsea 7, Saipem, and Aker Solutions, supported by companies including Heerema Marine Contractors, Van Oord, Boskalis, and Prysmian Group. These firms dominate through advanced offshore construction capabilities, strong project execution, and integration of digital monitoring technologies. Their focus on sustainable materials, AI-based inspection, and automation enhances operational safety and cost efficiency. North America emerged as the leading region, holding a 38% market share in 2024, driven by extensive shale gas extraction, infrastructure upgrades, and favorable regulatory frameworks promoting efficient energy transportation
.Market Insights
- The gathering pipeline market was valued at USD 50.77 Billion in 2024 and is expected to reach USD 68.1 Billion by 2032, growing at a CAGR of 3.74%.
- Rising oil and gas exploration, modernization of aging infrastructure, and expansion of petrochemical industries are driving steady market growth.
- Key trends include adoption of smart monitoring systems, AI-based inspection tools, and the shift toward corrosion-resistant and eco-friendly materials.
- The market is competitive, with leading players such as McDermott International, TechnipFMC, Subsea 7, and Saipem focusing on innovation and offshore expansion.
- North America leads with a 38% share, followed by Asia-Pacific at 28% and Europe at 24%, while the onshore segment dominates globally with 71% share.
Access crucial information at unmatched prices!
Request your sample report today & start making informed decisions powered by Credence Research Inc.!
Download Sample
Market Segmentation Analysis:
By Type
The onshore segment dominated the gathering pipeline market with a 71% share in 2024. Onshore pipelines are widely used due to their lower installation cost, easier maintenance, and access to established transport networks. Expanding shale gas and crude oil extraction across the U.S., China, and Saudi Arabia drives demand for efficient onshore networks. The ongoing replacement of aging pipelines and upgrades to corrosion-resistant materials further support growth. Increasing investments in pipeline infrastructure modernization also strengthen the onshore segment’s leading position across both developed and emerging markets.
- For instance, Enbridge finished the Line 3 onshore replacement spanning 1,765 km in 2021, bringing it in service on October 1.
By Material
The steel segment held the largest market share of 58% in 2024, supported by its durability, pressure resistance, and suitability for long-distance transport. Steel pipelines remain the preferred choice for oil and gas applications requiring high tensile strength. Growing use of advanced coatings and anti-corrosion technologies has enhanced the life span of steel pipelines, reducing maintenance costs. Rising investments in deep drilling and unconventional resource extraction continue to fuel the segment’s dominance, especially across North America and the Middle East.
- For instance, Tenaris unveiled a new 200,000 m² industrial complex in Abu Dhabi that features an inspection line and pipe service yard.
By Application
The oil and gas segment accounted for a 63% share in 2024, emerging as the dominant application area in the gathering pipeline market. Expanding exploration and production projects, especially in shale and offshore reserves, are driving segment growth. Increasing global energy demand and the shift toward automated pipeline monitoring systems further strengthen adoption. Modern pipeline management technologies such as SCADA and leak detection systems are improving efficiency and safety, reinforcing the oil and gas segment’s leadership across the global market.
Key Growth Drivers
Rising Oil and Gas Exploration Activities
Increasing global exploration and production projects are a major growth driver for the gathering pipeline market. The expansion of shale gas extraction and deepwater drilling operations across North America, the Middle East, and Asia-Pacific fuels pipeline installation. Governments are investing in energy infrastructure to enhance domestic output and reduce import dependence. The growing need for efficient hydrocarbon transport from production wells to processing units supports steady market expansion.
- For instance, Aramco’s network expansion adds 4,000 km of pipelines and targets 2 billion scf/d at Jafurah by 2030.
Modernization of Aging Pipeline Infrastructure
Aging pipelines in mature oil-producing regions are driving large-scale replacement and modernization projects. Operators are focusing on upgrading steel pipelines with corrosion-resistant coatings and composite materials to ensure long-term performance. Increased safety regulations and stricter maintenance standards also boost demand for advanced monitoring systems. These infrastructure investments enhance operational reliability and reduce environmental risks, supporting sustainable market growth.
- For instance, TC Energy’s NGTL intra-basin expansion added 23 km and secured 255 TJ/d of new firm service with 15-year terms.
Expansion of Petrochemical and Industrial Applications
Rising industrialization and expansion of petrochemical complexes are increasing the demand for gathering pipelines. Industries such as mining, chemicals, and wastewater treatment rely on pipeline systems for fluid transport. Growing investments in refining capacity and new petrochemical plants in Asia-Pacific further strengthen market opportunities. The development of multi-utility pipeline corridors also contributes to cost optimization and wider adoption.
Key Trends and Opportunities
Adoption of Smart Pipeline Monitoring Technologies
The integration of digital technologies like IoT sensors, SCADA, and AI-based analytics is transforming pipeline operations. These tools enable real-time pressure, flow, and leak monitoring, reducing downtime and enhancing safety. Remote data management and predictive maintenance models are becoming standard practices. Companies adopting intelligent systems benefit from reduced maintenance costs and improved operational efficiency, creating a strong growth opportunity.
- For instance, Silixa’s iPSS monitored a 52 km crude export pipeline using distributed acoustic sensing.
Shift Toward Environmentally Sustainable Materials
Manufacturers are developing eco-friendly materials such as high-density polyethylene and fiberglass for pipeline systems. These materials offer corrosion resistance and lower installation costs compared to traditional steel. The shift supports sustainability targets and aligns with global decarbonization goals. Increasing environmental awareness and government mandates are encouraging operators to adopt recyclable and lightweight materials across new installations.
- For instance, FlexSteel reported 48 miles of steel-reinforced spoolable line pipe installed in the Eagle Ford for high-temperature service.
Key Challenges
High Installation and Maintenance Costs
High capital expenditure remains a key barrier to market expansion, especially in offshore projects. The complex logistics of transporting heavy steel pipelines and maintaining long-distance networks increase operational expenses. Smaller companies often face financial constraints in adopting advanced pipeline systems. Despite technological progress, the total cost of ownership continues to challenge overall profitability.
Stringent Environmental and Safety Regulations
The gathering pipeline industry faces strict compliance requirements due to potential spill and emission risks. Governments have intensified inspection frameworks and imposed penalties for environmental violations. Companies must invest heavily in monitoring, leak detection, and emergency response systems to meet safety standards. Such regulations, while essential, increase operational costs and project delays for operators worldwide.
Regional Analysis
North America
North America held the largest share of 38% in the gathering pipeline market in 2024. The region’s growth is driven by expanding shale gas and crude oil production across the United States and Canada. Extensive exploration in the Permian Basin, Bakken, and Alberta oil sands has strengthened pipeline infrastructure demand. Investments in modernization and replacement of aging pipelines further enhance network reliability. The region also benefits from favorable government policies promoting energy self-sufficiency and the adoption of advanced monitoring technologies for leak detection and maintenance optimization.
Europe
Europe accounted for a 24% share in the gathering pipeline market in 2024. The region’s focus on upgrading existing oil and gas infrastructure and increasing natural gas imports through interconnectivity projects supports steady demand. Countries such as Norway, the UK, and Germany are emphasizing efficient energy transport systems and low-emission materials. Transition toward cleaner fuels and sustainable energy transport networks further drives the market. Increasing cross-border energy cooperation and digitalization in pipeline monitoring strengthen Europe’s position in the global market.
Asia-Pacific
Asia-Pacific captured a 28% share in the gathering pipeline market in 2024. The region’s growth is led by rapid industrialization, energy demand, and expansion of refining and petrochemical infrastructure. China and India are heavily investing in pipeline networks to enhance domestic fuel distribution. Rising offshore exploration projects in Southeast Asia also contribute to market expansion. Government-backed infrastructure initiatives and technological collaborations with global energy firms further accelerate development, making Asia-Pacific a fast-growing regional market for gathering pipelines.
Latin America
Latin America held a 6% share in the gathering pipeline market in 2024. The region’s market is supported by oil and gas development projects in Brazil, Mexico, and Argentina. Increasing offshore activities and energy export pipelines are boosting infrastructure investments. Modernization efforts in aging assets and expansion of cross-country networks strengthen connectivity. However, political instability and funding limitations slightly constrain large-scale project implementation, though private investments continue to support gradual market growth.
Middle East and Africa
The Middle East and Africa region accounted for a 4% share in the gathering pipeline market in 2024. Large-scale oil and gas projects across Saudi Arabia, the UAE, and Qatar sustain market momentum. Expansion of refining capacity and exploration of new natural gas fields strengthen infrastructure development. African nations such as Nigeria and Angola are also increasing pipeline projects to boost export efficiency. Despite regulatory challenges, regional governments are promoting strategic partnerships and digital monitoring solutions to improve pipeline reliability and operational safety.
Market Segmentations:
By Type
By Material
- Steel
- Ductile Iron
- Polyethylene
- Fiberglass
- Polypropylene
By Application
- Oil & Gas
- Water & Wastewater
- Chemicals & Petrochemicals
- Mining
- Others
By Geography
- North America
- Europe
- Germany
- France
- U.K.
- Italy
- Spain
- Rest of Europe
- Asia Pacific
- China
- Japan
- India
- South Korea
- South-east Asia
- Rest of Asia Pacific
- Latin America
- Brazil
- Argentina
- Rest of Latin America
- Middle East & Africa
- GCC Countries
- South Africa
- Rest of the Middle East and Africa
Competitive Landscape
The gathering pipeline market features major players such as McDermott International, TechnipFMC, Subsea 7, Saipem, Heerema Marine Contractors, Van Oord, Boskalis, Allseas, Aker Solutions, Prysmian Group, Jan De Nul, DEME Group, Fluor Corporation, and DeepOcean. These companies compete through advanced engineering capabilities, large-scale project execution, and adoption of digital technologies for pipeline design and monitoring. The market is witnessing a shift toward integrated service models combining engineering, procurement, construction, and installation. Strategic collaborations with energy producers and national oil companies enhance project efficiency and regional presence. Firms are investing in automation, AI-driven inspection tools, and corrosion-resistant materials to optimize costs and ensure compliance with environmental standards. Additionally, expansion into offshore and deepwater pipeline projects is strengthening their long-term competitiveness, as global energy transition drives demand for safe, sustainable, and cost-effective pipeline infrastructure solutions.
Shape Your Report to Specific Countries or Regions & Enjoy 30% Off!
Key Player Analysis
- McDermott International
- TechnipFMC
- Subsea 7
- Saipem
- Heerema Marine Contractors
- Van Oord
- Boskalis
- Allseas
- Aker Solutions
- Prysmian Group
- Jan De Nul
- DEME Group
- Fluor Corporation
- DeepOcean
Recent Developments
- In 2025, Allseas Lorelay pipelay vessel returned to complete offshore pipeline work in the Caribbean in January, and pipelay projects were underway offshore Trinidad and Tobago.
- In 2025, McDermott was awarded a contract by PTTEP to provide engineering, procurement, construction, and installation (EPCI) for a new carbon steel pipeline and subsea umbilicals, risers, and flowlines (SURF) for the Block H gas field expansion project.
- In 2023, TechnipFMC Secured significant subsea contracts, including a “substantial” flexible pipe contract from Petrobras in Brazil and an iEPCI™ (integrated Engineering, Procurement, Construction, and Installation) contract from Woodside Energy for the Xena Phase 3 development.
- In 2023, ExxonMobil acquired Denbury Resources, gaining the largest U.S. CO2 pipeline network to transport captured CO2 for permanent underground storage.
Report Coverage
The research report offers an in-depth analysis based on Type, Material, Application and Geography. It details leading market players, providing an overview of their business, product offerings, investments, revenue streams, and key applications. Additionally, the report includes insights into the competitive environment, SWOT analysis, current market trends, as well as the primary drivers and constraints. Furthermore, it discusses various factors that have driven market expansion in recent years. The report also explores market dynamics, regulatory scenarios, and technological advancements that are shaping the industry. It assesses the impact of external factors and global economic changes on market growth. Lastly, it provides strategic recommendations for new entrants and established companies to navigate the complexities of the market.
Future Outlook
- Expansion of shale gas and offshore drilling projects will increase pipeline installation demand.
- Adoption of smart monitoring systems will enhance safety and operational efficiency.
- Replacement of aging steel networks will drive modernization investments.
- Governments will focus on improving pipeline reliability through stricter safety standards.
- Growth in petrochemical and refining sectors will boost gathering pipeline utilization.
- Rising industrialization in Asia-Pacific will strengthen regional market expansion.
- Development of corrosion-resistant and composite materials will reduce maintenance costs.
- Integration of automation and AI-based inspection tools will improve performance tracking.
- Sustainability goals will promote eco-friendly materials in new pipeline projects.
- Strategic partnerships between energy firms will accelerate global infrastructure development.


