Market Overview:
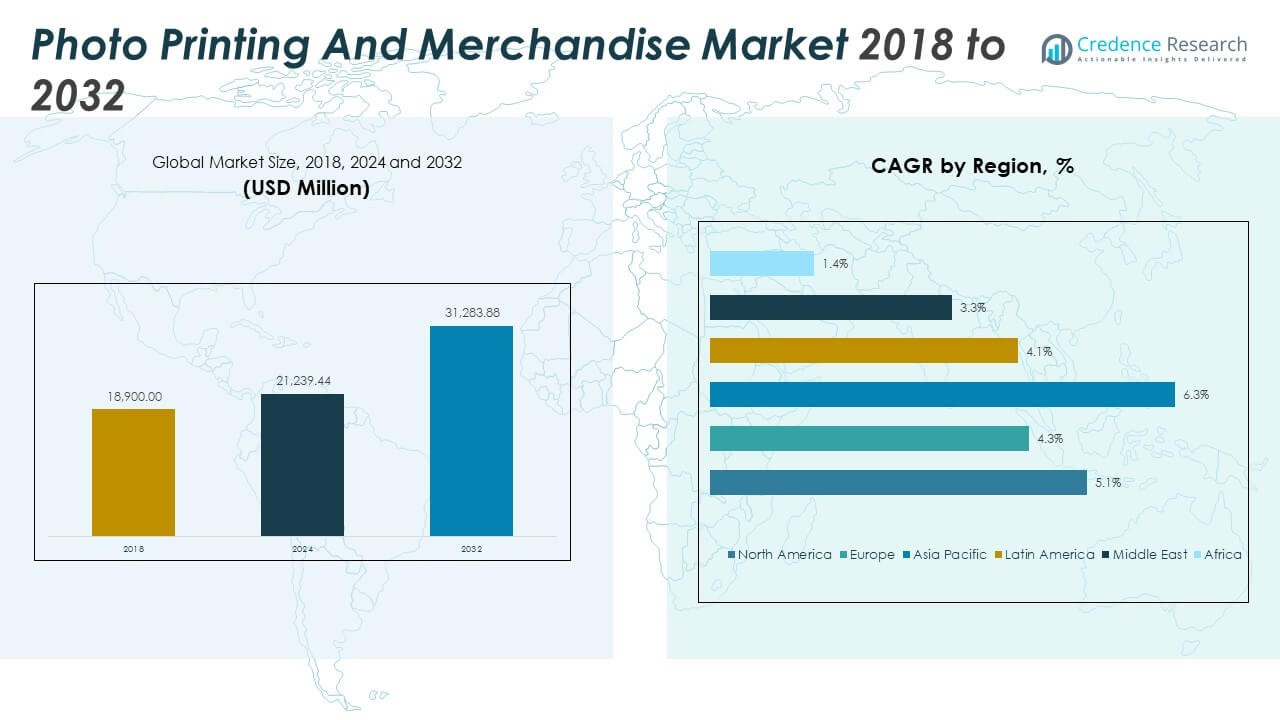
The Photo Printing and Merchandise Market size was valued at USD 18,900 million in 2018 to USD 21,239.44 million in 2024 and is anticipated to reach USD 31,283.88 million by 2032, at a CAGR of 5.07% during the forecast period.
| REPORT ATTRIBUTE |
DETAILS |
| Historical Period |
2020-2023 |
| Base Year |
2024 |
| Forecast Period |
2025-2032 |
| Photo Printing and Merchandise Market Size 2024 |
USD 21,239.44 Million |
| Photo Printing and Merchandise Market, CAGR |
5.07% |
| Photo Printing and Merchandise Market Size 2032 |
USD 31,283.88 Million |
The market is driven by strong consumer preference for customized products such as photo books, calendars, and gifts that preserve personal memories. Increasing smartphone usage and the availability of high-quality photo editing tools have simplified design and ordering processes. Companies are focusing on AI-driven design automation, cloud-based storage integration, and eco-friendly printing solutions to attract digitally active consumers and enhance user experience across online and offline channels.
North America dominates due to high digital adoption and strong presence of key players offering advanced printing services. Europe follows with consistent demand driven by personalization trends and sustainable printing practices. The Asia Pacific region is emerging as the fastest-growing market, supported by a large youth population, rising disposable income, and expanding e-commerce infrastructure. Latin America and the Middle East are experiencing gradual growth driven by digital retail adoption and improved access to affordable printing solutions.
Access crucial information at unmatched prices!
Request your sample report today & start making informed decisions powered by Credence Research Inc.!
Download Sample
Market Insights:
- The Photo Printing and Merchandise Market was valued at USD 18,900 million in 2018, reached USD 21,239.44 million in 2024, and is projected to achieve USD 31,283.88 million by 2032, expanding at a CAGR of 5.07%.
- North America leads with a 37% share due to strong digital adoption, widespread personalization culture, and established players such as Shutterfly and Walgreens.
- Europe holds a 27% share, supported by eco-friendly printing initiatives and a robust gifting culture across major economies like the UK, France, and Germany.
- Asia Pacific follows with a 25% share, recording the fastest growth driven by smartphone penetration, expanding e-commerce platforms, and young consumer demographics.
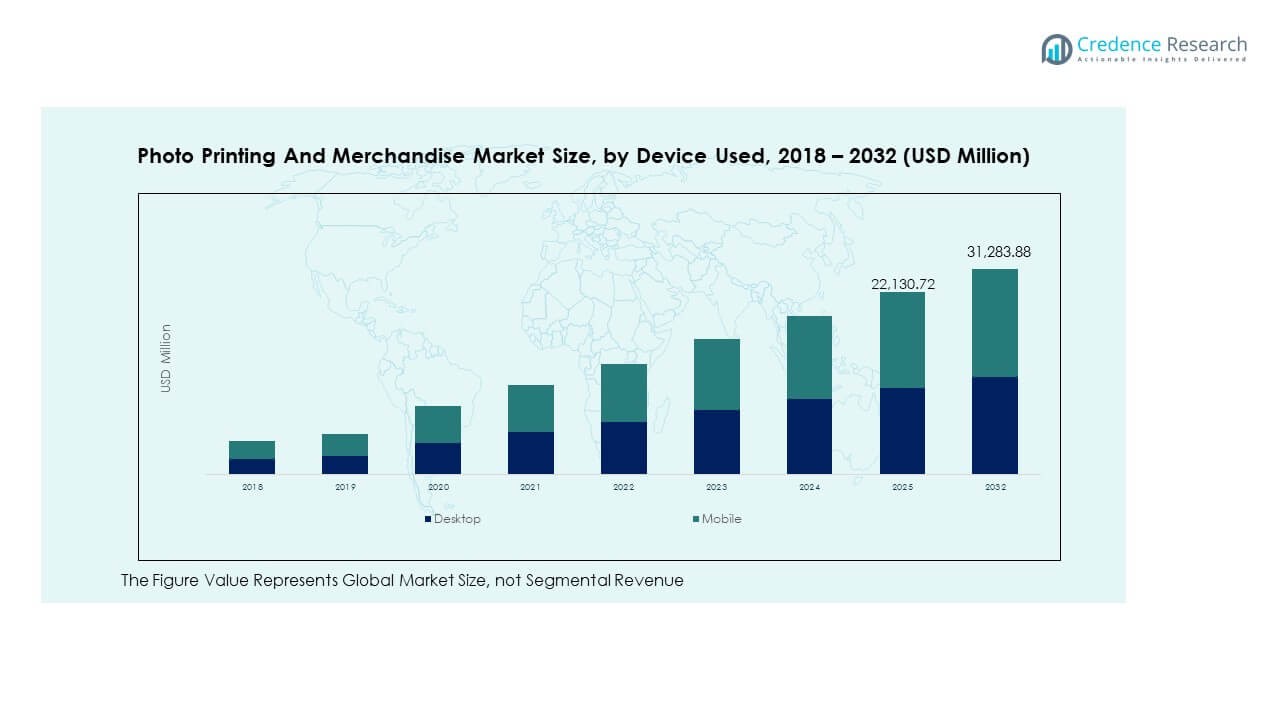
- Based on device segmentation, mobile usage accounts for around 60% of global market activity, while desktops contribute 40%, reflecting a clear shift toward mobile-first customization and ordering behavior.
Market Drivers
Rising Consumer Demand for Personalized and Customized Photo Products
The Photo Printing and Merchandise Market benefits from increasing consumer interest in personalized photo gifts. Customers prefer unique products such as photo books, calendars, and mugs that reflect personal memories. This trend is amplified by digital tools enabling easy customization and order placement. Consumers seek emotional connection through customized designs, driving steady demand. It supports high repeat purchases during festivals, weddings, and corporate gifting. Rising social media influence encourages users to create tangible keepsakes. Custom merchandise enhances brand value for businesses using personalized marketing. The growing culture of personalization continues to strengthen market growth.
- For instance, Shutterfly’s platform enables the creation of personalized photo books, mugs, blankets, and other products through an online and mobile solution, serving a broad consumer base; its catalog includes over 6,000 customizable product options for occasions such as holidays, weddings, and birthdays, as verified by Shutterfly’s 2025 product lineup.
Advancements in Digital Printing Technologies Enhancing Output Quality and Speed
Technological improvements in digital printing have transformed product quality and efficiency. High-resolution printers enable sharper images and faster output for bulk orders. It allows businesses to meet diverse consumer needs across multiple product categories. The integration of UV and dye-sublimation printing delivers durability and vivid color accuracy. Portable and compact printing devices improve accessibility for small retailers. Automated systems help reduce waste and operational costs while ensuring precision. These advancements make short-run and on-demand printing profitable. Continuous R&D in print technology sustains the market’s innovation-driven expansion.
- For instance, the HP Indigo 100K Digital Press, launched globally, is the world’s most productive B2 digital solution, achieving speeds up to 6,000 sheets per hour in Enhanced Productivity Mode and printing at 812 dpi 8-bit resolution for superior color accuracy and image sharpness, according to HP’s official 2025 technical specifications.
Integration of AI-Based Design Tools and Smart Editing Platforms
AI-powered tools are transforming the design and personalization process. Smart editing software enables automatic background removal, image enhancement, and layout suggestions. It simplifies product creation for non-professional users while maintaining creative freedom. Cloud-based design tools allow collaboration between customers and retailers in real time. Predictive analytics enhance product recommendations based on user preferences. Businesses leverage AI to optimize inventory and forecast design trends. These intelligent features improve operational efficiency and user experience. The integration of AI technologies strengthens brand engagement and product diversity.
Expanding E-Commerce Ecosystem and Seamless Digital Ordering Experience
Online platforms drive major growth in photo printing and merchandise adoption. E-commerce websites offer easy access to wide product ranges and personalized design options. It enables users to upload images, preview designs, and place orders instantly. Secure payment systems and reliable logistics boost consumer trust in digital retailing. Social media integration supports direct product promotion and customer interaction. Subscription models encourage recurring purchases and brand loyalty. Mobile applications expand market penetration among younger consumers. The convenience and flexibility of online purchasing strengthen market competitiveness.
Market Trends
Growing Popularity of On-Demand and Instant Printing Solutions
Consumers increasingly prefer quick-turnaround printing services for convenience and immediacy. On-demand printing enables single-unit production with minimal lead time. It allows retailers to manage inventory efficiently while minimizing waste. Compact printers supporting wireless connectivity meet modern customer expectations. Retail kiosks offering instant prints in malls and airports improve user engagement. It promotes the experience-driven economy where customers value instant gratification. The trend supports small businesses offering fast, high-quality printing services. Instant printing continues to redefine consumer expectations across multiple regions.
- For instance, HP’s Envy Photo 7200/7900 series incorporates over 60% recycled plastic, aligning with the company’s sustainability goals. HP’s Instant Ink subscription service continues to expand, offering rapid ink delivery and supporting its growing base of small business and home office users in the U.S.
Sustainability Focus Driving Use of Eco-Friendly Materials and Inks
Environmental awareness influences purchasing decisions among eco-conscious consumers. Companies adopt biodegradable photo paper and water-based inks to reduce environmental impact. It promotes brand credibility and aligns with global sustainability goals. Energy-efficient printing systems minimize carbon emissions and waste generation. Recyclable packaging materials further enhance green branding efforts. Manufacturers prioritize ethical sourcing of raw materials in production cycles. Sustainable printing practices attract government and corporate collaborations. The eco-friendly shift encourages innovation in sustainable merchandise design.
Integration of Augmented Reality and 3D Imaging in Product Personalization
Innovations in AR and 3D imaging technologies enhance consumer interactivity. Users can visualize personalized designs on products before ordering. It enables immersive online shopping experiences with higher conversion rates. AR tools facilitate real-time customization through smartphone apps. Retailers use 3D modeling to demonstrate product dimensions and texture. These immersive tools improve customer confidence in design choices. Interactive visualization fosters emotional connection and purchase satisfaction. The integration of AR and 3D imaging advances market differentiation and digital adoption.
Growing Role of Social Media and Influencer Marketing in Product Promotion
Social platforms serve as key marketing channels for photo merchandise brands. Influencers promote customized products to target younger demographics. It increases visibility and fosters trust among digital-native consumers. Social media contests and giveaways enhance user-generated content sharing. Retailers analyze social trends to design relevant photo themes. Real-time feedback from followers helps refine product offerings. Integration of direct purchase links shortens consumer decision cycles. The synergy between digital marketing and personalization drives brand loyalty and engagement.
- For instance, TikTok’s official 2025 Creator Performance Report highlighted that micro-influencer campaigns on consumer brands achieved average engagement rates near 10%, with higher conversions driven by short-form personalized video content across lifestyle and retail categories.
Market Challenges Analysis
High Production Costs and Supply Chain Constraints Limiting Scalability
The Photo Printing and Merchandise Market faces challenges from rising material and logistics costs. Premium-quality photo paper, inks, and printing equipment require high investment. It limits small businesses from scaling operations efficiently. Disruptions in raw material availability impact production schedules. Dependence on third-party logistics increases delivery time and cost variability. High competition compels firms to offer discounts, reducing profit margins. Managing bulk orders during seasonal peaks becomes complex for smaller vendors. These operational barriers restrain growth in highly competitive regions.
Data Privacy Concerns and Quality Consistency Affecting Consumer Trust
Handling customer images raises privacy and security issues for service providers. It demands strict data protection policies and encrypted storage systems. Any breach of personal data can damage brand reputation significantly. Inconsistent print quality across product batches leads to customer dissatisfaction. Maintaining uniform color calibration remains a technical challenge for manufacturers. Limited standardization in printing hardware and software complicates quality control. Addressing these challenges requires continuous investment in compliance and process optimization. Companies focusing on trust-building and reliability gain long-term market advantage.
Market Opportunities:
Expanding Adoption of AI-Powered Design Customization and Predictive Retail Insights
The Photo Printing and Merchandise Market presents opportunities through intelligent personalization. AI algorithms predict consumer design choices based on past preferences. It enables businesses to deliver customized templates and faster service. Retailers leverage predictive analytics for inventory planning and targeted marketing. Integration of AI chat assistants improves user interaction during product design. Automated personalization reduces manual input and shortens order cycles. Smart product recommendations enhance customer satisfaction and sales conversion. Continuous integration of intelligent systems will create future growth avenues.
Emerging Potential in Corporate Gifting and Event Merchandise Segments
Corporate clients increasingly adopt photo-based merchandise for branding and employee engagement. It includes customized calendars, desk accessories, and promotional apparel. Event organizers demand printed memorabilia for conferences and exhibitions. The trend enhances market exposure across institutional and enterprise sectors. Bulk production orders improve cost efficiency for suppliers. Expanding B2B relationships strengthen recurring revenue streams. Personalized branding solutions boost customer retention for corporate clients. Growing enterprise demand ensures consistent growth opportunities across global markets.
Market Segmentation Analysis:
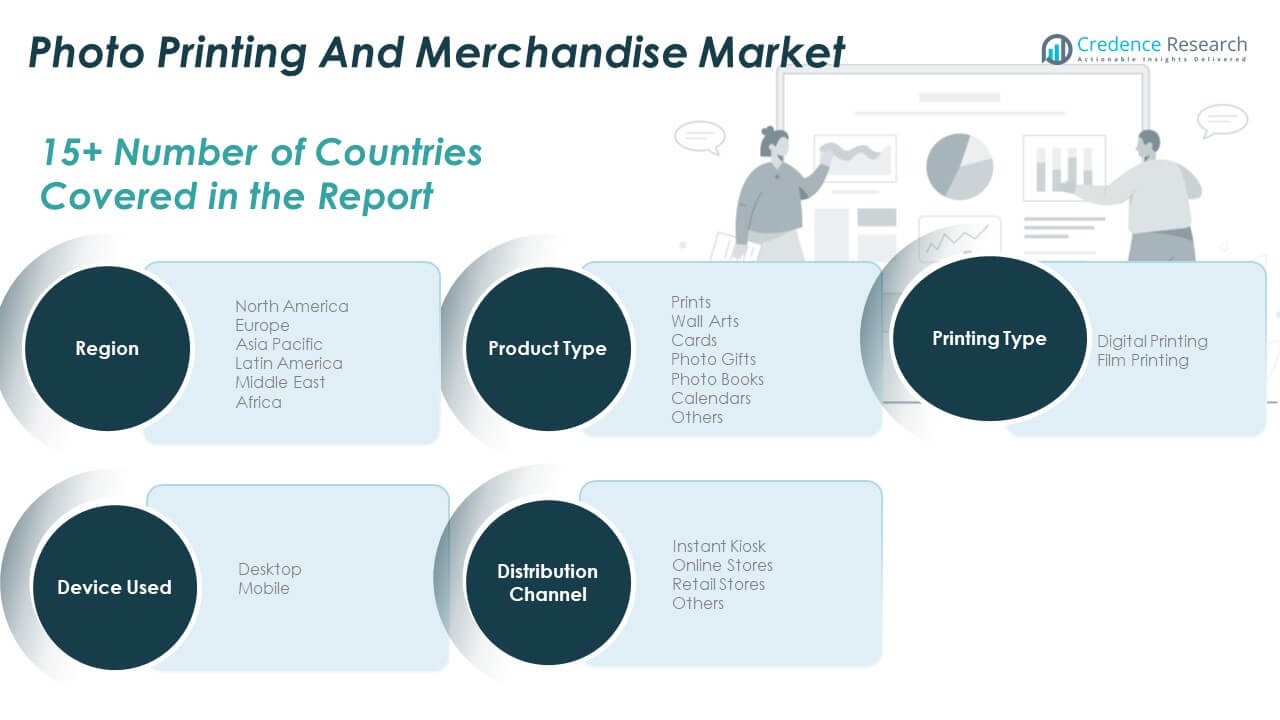
By Product Type
The Photo Printing and Merchandise Market includes prints, wall arts, cards, photo gifts, photo books, calendars, and others. Prints and photo gifts lead due to their strong appeal in personal gifting and promotional branding. Wall arts and photo books attract consumers focused on home décor and memory preservation. Cards and calendars maintain steady demand during festive and corporate seasons. Other products, including custom apparel and photo accessories, add niche diversity. It reflects consumer preference for emotional connection and creative personalization across formats.
- For instance, Shutterfly’s official 2024 Purpose and Impact Report confirms more than two million personalized photo books produced annually, spanning various customizable formats according to verified company impact data.
By Printing Type
Digital printing dominates the market owing to its efficiency, superior image quality, and cost-effectiveness. Advanced inkjet and dye-sublimation technologies support high-volume production with minimal waste. It enables retailers to fulfill personalized orders quickly and accurately. Film printing continues to attract photography enthusiasts who value classic aesthetics and tangible output. The balance between digital convenience and traditional appeal strengthens the market’s product diversity and user engagement.
By Device Used
The market by device used is categorized into desktop and mobile. Mobile devices capture growing demand due to rising smartphone penetration and access to design applications. It allows users to personalize products instantly and order online. Desktop systems remain important for professionals who handle detailed editing and large printing projects. Cross-device compatibility enhances accessibility, ensuring users can design and order from multiple platforms seamlessly.
- For instance, Canva’s official 2024 wrap-up reveals its design community exceeded 220 million global users, who collectively created over 38.5 million designs daily demonstrating strong engagement with mobile and instant-order features worldwide.
By Distribution Channel
Distribution channels include instant kiosks, online stores, retail stores, and others. Online stores hold the largest share due to ease of customization, product variety, and quick delivery. It offers convenient digital interfaces and promotional deals that attract repeat buyers. Retail stores and kiosks maintain offline visibility through same-day delivery and product demonstration. Other channels, such as third-party resellers, help expand reach across regional and small-scale markets. The combination of digital and physical channels supports a flexible and consumer-focused distribution network.
Segmentation:
By Product Type
- Prints
- Wall Arts
- Cards
- Photo Gifts
- Photo Books
- Calendars
- Others
By Printing Type
- Digital Printing
- Film Printing
By Device Used
By Distribution Channel
- Instant Kiosk
- Online Stores
- Retail Stores
- Others
By Region
- North America
- Europe
- Germany
- France
- U.K.
- Italy
- Spain
- Rest of Europe
- Asia Pacific
- China
- Japan
- India
- South Korea
- South-east Asia
- Rest of Asia Pacific
- Latin America
- Brazil
- Argentina
- Rest of Latin America
- Middle East & Africa
- GCC Countries
- South Africa
- Rest of the Middle East and Africa
Regional Analysis:
North America
The North America Photo Printing and Merchandise Market size was valued at USD 7,144.20 million in 2018 to USD 7,934.93 million in 2024 and is anticipated to reach USD 11,672.07 million by 2032, at a CAGR of 5.1% during the forecast period. North America holds a 37% share of the global market, driven by high digital adoption and strong demand for personalized products. The U.S. leads with widespread usage of mobile-based design applications and advanced digital printing technology. It benefits from a mature e-commerce ecosystem and strong consumer spending on customized gifts. Canada and Mexico also show rising adoption of online printing services. The presence of major players such as Shutterfly, Walgreens, and Walmart enhances regional competitiveness. Increasing use of AI-driven design tools supports innovation and user engagement. The region continues to lead in technological integration and premium photo merchandise offerings.
Europe
The Europe Photo Printing and Merchandise Market size was valued at USD 4,687.20 million in 2018 to USD 5,050.16 million in 2024 and is anticipated to reach USD 6,999.85 million by 2032, at a CAGR of 4.3% during the forecast period. Europe captures a 27% share of the global market, supported by high-quality standards and a strong culture of gifting. The UK, Germany, and France represent key markets due to advanced retail infrastructure and aesthetic design preferences. It benefits from sustainable printing practices and eco-friendly materials. Demand for wall art, photo books, and cards remains consistent across the region. Online platforms such as Photobox and CEWE dominate, offering extensive personalization options. European consumers value product craftsmanship and visual appeal. Growing awareness of environmentally responsible merchandise production continues to shape regional market trends.
Asia Pacific
The Asia Pacific Photo Printing and Merchandise Market size was valued at USD 5,065.20 million in 2018 to USD 5,922.53 million in 2024 and is anticipated to reach USD 9,550.99 million by 2032, at a CAGR of 6.3% during the forecast period. Asia Pacific accounts for 25% of the global market and demonstrates the fastest growth rate globally. Rising smartphone use and increasing internet penetration drive online personalization demand. China, Japan, and India lead the region, supported by expanding e-commerce platforms and young consumer demographics. It experiences strong growth in mobile-based photo printing and instant gift products. Local manufacturers invest in affordable, high-quality printing technologies. Social media influence and rapid digital adoption strengthen product visibility. The region’s growing middle class and urbanization trends continue to boost spending on customized merchandise.
Latin America
The Latin America Photo Printing and Merchandise Market size was valued at USD 1,228.50 million in 2018 to USD 1,367.61 million in 2024 and is anticipated to reach USD 1,872.97 million by 2032, at a CAGR of 4.1% during the forecast period. Latin America holds an 8% share of the global market, with Brazil and Mexico emerging as key contributors. The region benefits from a growing number of online retailers offering cost-effective personalized products. It witnesses expanding interest in photo gifts and customized apparel, especially among younger consumers. Limited retail infrastructure pushes customers toward digital channels. Local brands collaborate with global platforms to enhance customization options. Economic stability and digital transformation initiatives support gradual market expansion. Rising mobile adoption fosters demand for easy-to-use photo editing and printing solutions.
Middle East
The Middle East Photo Printing and Merchandise Market size was valued at USD 546.21 million in 2018 to USD 562.71 million in 2024 and is anticipated to reach USD 719.70 million by 2032, at a CAGR of 3.3% during the forecast period. The region contributes nearly 2% to global revenue, driven by growing consumer interest in lifestyle personalization. GCC countries lead the market with rising online retail adoption and modern printing infrastructure. It benefits from increased demand for premium-quality gifts during cultural and festive events. Businesses invest in high-end printing services to support brand marketing. Local print service providers are expanding digital capabilities to meet modern consumer expectations. Rising tourism and gifting culture also support merchandise demand. The region’s gradual digital shift and premium retail investments indicate steady future growth.
Africa
The Africa Photo Printing and Merchandise Market size was valued at USD 228.69 million in 2018 to USD 401.51 million in 2024 and is anticipated to reach USD 468.30 million by 2032, at a CAGR of 1.4% during the forecast period. Africa represents nearly 1% of the global market, with South Africa leading due to its established retail and digital infrastructure. It faces challenges from low awareness and limited access to online personalization tools. Urban consumers show increasing interest in customized gifts and photo products. Growing internet connectivity across Nigeria, Egypt, and Kenya supports digital printing adoption. International players are entering regional partnerships to improve distribution networks. Local print businesses adopt affordable digital printing technologies for scalability. The region is gradually transitioning toward online customization, creating long-term potential for market expansion.
Shape Your Report to Specific Countries or Regions & Enjoy 30% Off!
Key Player Analysis:
Competitive Analysis:
The Photo Printing and Merchandise Market is characterized by intense competition among established global and regional players. Leading companies such as Shutterfly Inc., Walgreens Co., Walmart, Vistaprint, and Adorama Camera, Inc. focus on innovation, product variety, and advanced printing technologies to enhance customer experience. It emphasizes digital integration, AI-based design tools, and mobile-friendly platforms to attract tech-savvy consumers. Partnerships and mergers strengthen brand presence across online and offline channels. Smaller players compete by offering localized customization, affordable pricing, and quick delivery options. Continuous investment in automation and sustainable materials improves operational efficiency and product quality. Competitive differentiation increasingly depends on personalization depth, print precision, and seamless digital interfaces.
Recent Developments:
- In October 2025, Bay Photo Lab announced a significant product update, switching the paper used for some offerings as of October 6, and making changes such as discontinuing selected items by October 12, 2025, reflecting its commitment to enhancing print quality and adapting its product catalog.
- On October 15, 2025, Shutterfly Inc. partnered with Little Sleepies to launch a limited holiday collection featuring seven card designs and six ornament designs, with a philanthropic goal supporting Baby2Baby, underscoring its focus on themed merchandise and social impact.
- In October 2025, Walmart announced a partnership with OpenAI to let shoppers browse and purchase products directly via ChatGPT, representing a technological leap in AI-first shopping experiences for both Walmart and Sam’s Club members, set to launch soon.
Report Coverage:
The research report offers an in-depth analysis based on Product Type, Printing Type, Device Used and Distribution Channel. It details leading market players, providing an overview of their business, product offerings, investments, revenue streams, and key applications. Additionally, the report includes insights into the competitive environment, SWOT analysis, current market trends, as well as the primary drivers and constraints. Furthermore, it discusses various factors that have driven market expansion in recent years. The report also explores market dynamics, regulatory scenarios, and technological advancements that are shaping the industry. It assesses the impact of external factors and global economic changes on market growth. Lastly, it provides strategic recommendations for new entrants and established companies to navigate the complexities of the market.
Future Outlook:
- Advancements in AI-powered design tools will enhance customization precision and reduce production time.
- Growth in mobile-based ordering platforms will continue to expand accessibility for global consumers.
- Demand for eco-friendly printing materials and sustainable packaging will strengthen brand reputation.
- Integration of AR and 3D visualization will elevate customer engagement and design confidence.
- Expansion of e-commerce platforms will drive higher sales volumes for personalized merchandise.
- Corporate gifting and promotional product demand will create consistent revenue streams for vendors.
- Hybrid retail models combining online personalization and in-store pickup will gain popularity.
- Emerging economies in Asia Pacific and Latin America will become key growth frontiers.
- Investment in high-speed digital printing infrastructure will improve scalability and quality output.
- Continuous innovation in print formats and materials will shape the market’s competitive landscape


