CHAPTER NO. 1: GENESIS OF THE MARKET
1.1 Market Prelude – Introduction & Scope
1.2 The Big Picture – Objectives & Vision
1.3 Strategic Edge – Unique Value Proposition
1.4 Stakeholder Compass – Key Beneficiaries
CHAPTER NO. 2: EXECUTIVE LENS
2.1 Pulse of the Industry – Market Snapshot
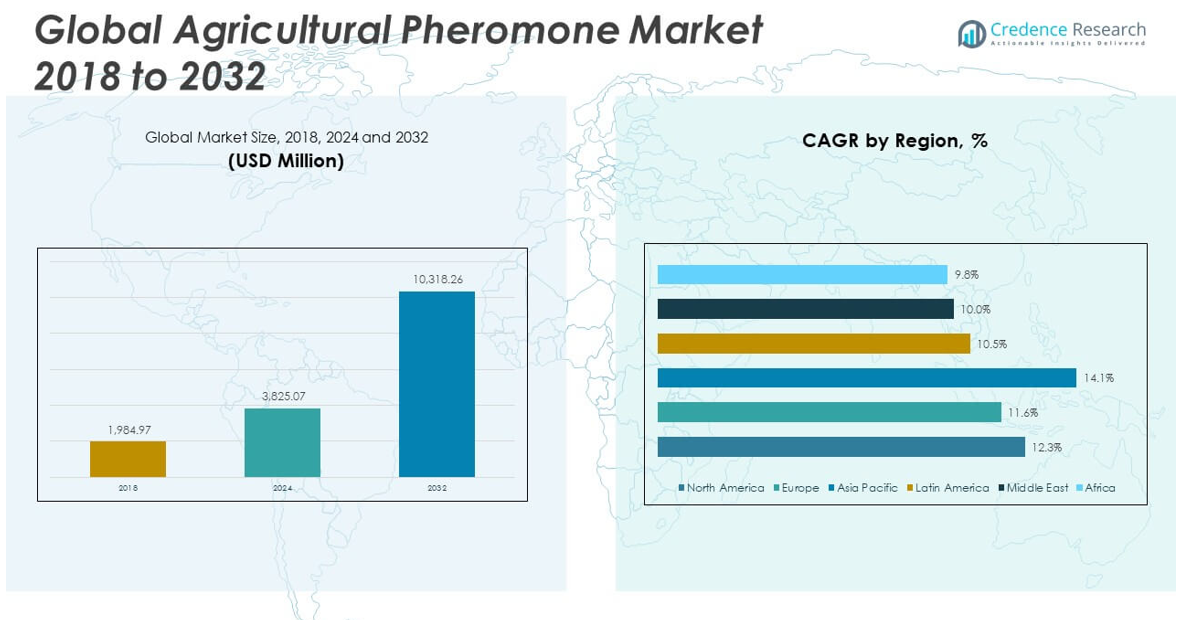
2.2 Growth Arc – Revenue Projections (USD Million)
2.3. Premium Insights – Based on Primary Interviews
CHAPTER NO. 3: AGRICULTURAL PHEROMONE MARKET FORCES & INDUSTRY PULSE
3.1 Foundations of Change – Market Overview
3.2 Catalysts of Expansion – Key Market Drivers
3.2.1 Momentum Boosters – Growth Triggers
3.2.2 Innovation Fuel – Disruptive Technologies
3.3 Headwinds & Crosswinds – Market Restraints
3.3.1 Regulatory Tides – Compliance Challenges
3.3.2 Economic Frictions – Inflationary Pressures
3.4 Untapped Horizons – Growth Potential & Opportunities
3.5 Strategic Navigation – Industry Frameworks
3.5.1 Market Equilibrium – Porter’s Five Forces
3.5.2 Ecosystem Dynamics – Value Chain Analysis
3.5.3 Macro Forces – PESTEL Breakdown
3.6 Price Trend Analysis
3.6.1 Regional Price Trend
3.6.2 Price Trend by Product
CHAPTER NO. 4: KEY INVESTMENT EPICENTER
4.1 Regional Goldmines – High-Growth Geographies
4.2 Product Frontiers – Lucrative Product Categories
4.3 Application Sweet Spots – Emerging Demand Segments
CHAPTER NO. 5: REVENUE TRAJECTORY & WEALTH MAPPING
5.1 Momentum Metrics – Forecast & Growth Curves
5.2 Regional Revenue Footprint – Market Share Insights
5.3 Segmental Wealth Flow – Crop Type & Function Revenue
CHAPTER NO. 6: TRADE & COMMERCE ANALYSIS
6.1. Import Analysis by Region
6.1.1. Global Agricultural Pheromone Import Revenue By Region
6.2. Export Analysis by Region
6.2.1. Global Agricultural Pheromone Export Revenue By Region
CHAPTER NO. 7: COMPETITION ANALYSIS
7.1. Company Market Share Analysis
7.1.1. Global Agricultural Pheromone: Company Market Share
7.2. Global Agricultural Pheromone Company Revenue Market Share
7.3. Strategic Developments
7.3.1. Acquisitions & Mergers
7.3.2. New Product Launch
7.3.3. Regional Expansion
7.4. Competitive Dashboard
7.5. Company Assessment Metrics, 2024
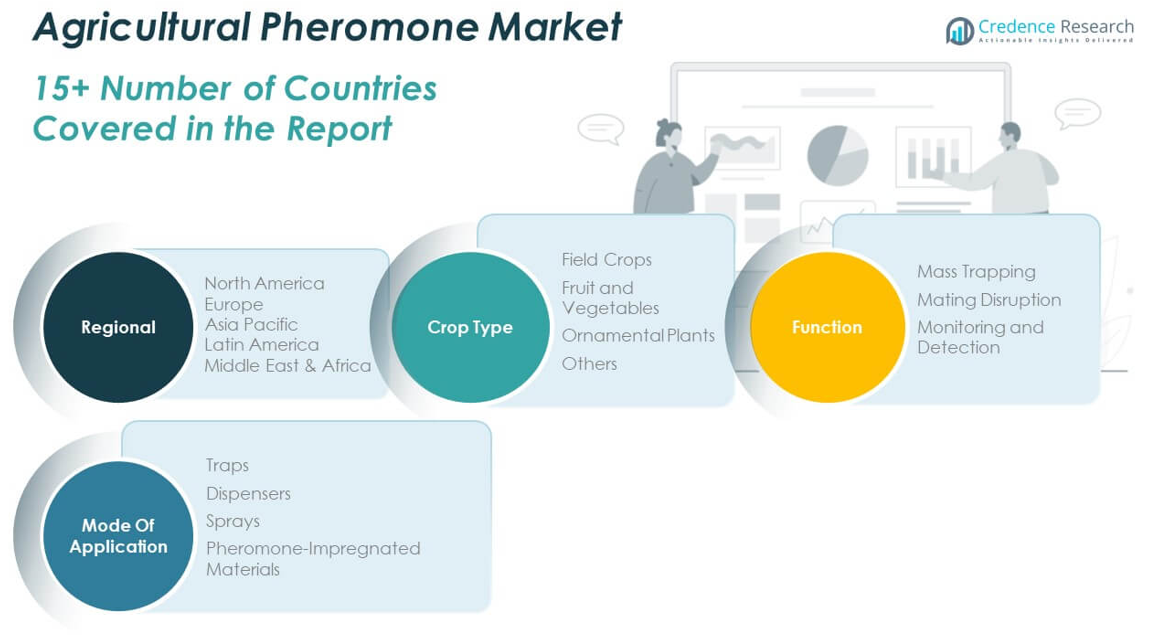
CHAPTER NO. 8: AGRICULTURAL PHEROMONE MARKET – BY CROP TYPE SEGMENT ANALYSIS
8.1. Agricultural Pheromone Overview by Crop Type Segment
8.1.1. Agricultural Pheromone Revenue Share By Crop Type
8.2. Field Crops
8.3. Fruit and Vegetables
8.4. Ornamental Plants
8.5. Others
CHAPTER NO. 9: AGRICULTURAL PHEROMONE MARKET – BY FUNCTION SEGMENT ANALYSIS
9.1. Agricultural Pheromone Overview by Function Segment
9.1.1. Agricultural Pheromone Revenue Share By Function
9.2. Mass Trapping
9.3. Mating Disruption
9.4. Monitoring and Detection
CHAPTER NO. 10: AGRICULTURAL PHEROMONE MARKET – BY MODE OF APPLICATION CHANNEL SEGMENT ANALYSIS
10.1. Agricultural Pheromone Overview by Mode of Application Segment
10.1.1. Agricultural Pheromone Revenue Share By Mode of Application
10.2. Traps
10.3. Dispensers
10.4. Sprays
10.5. Pheromone-Impregnated Materials
CHAPTER NO. 11: AGRICULTURAL PHEROMONE MARKET – REGIONAL ANALYSIS
11.1. Agricultural Pheromone Overview by Region Segment
11.1.1. Global Agricultural Pheromone Revenue Share By Region
11.1.2. Regions
11.1.3. Global Agricultural Pheromone Revenue By Region
11.1.4. Crop Type
11.1.5. Global Agricultural Pheromone Revenue By Crop Type
11.1.6. Function
11.1.7. Global Agricultural Pheromone Revenue By Function
11.1.8. Mode of Application
11.1.9. Global Agricultural Pheromone Revenue By Mode of Application
CHAPTER NO. 12: NORTH AMERICA AGRICULTURAL PHEROMONE MARKET – COUNTRY ANALYSIS
12.1. North America Agricultural Pheromone Overview by Country Segment
12.1.1. North America Agricultural Pheromone Revenue Share By Region
12.2. North America
12.2.1. North America Agricultural Pheromone Revenue By Country
12.2.2. Crop Type
12.2.3. North America Agricultural Pheromone Revenue By Crop Type
12.2.4. Function
12.2.5. North America Agricultural Pheromone Revenue By Function
12.2.6. Mode of Application
12.2.7. North America Agricultural Pheromone Revenue By Mode of Application
2.3. U.S.
12.4. Canada
12.5. Mexico
CHAPTER NO. 13: EUROPE AGRICULTURAL PHEROMONE MARKET – COUNTRY ANALYSIS
13.1. Europe Agricultural Pheromone Overview by Country Segment
13.1.1. Europe Agricultural Pheromone Revenue Share By Region
13.2. Europe
13.2.1. Europe Agricultural Pheromone Revenue By Country
13.2.2. Crop Type
13.2.3. Europe Agricultural Pheromone Revenue By Crop Type
13.2.4. Function
13.2.5. Europe Agricultural Pheromone Revenue By Function
13.2.6. Mode of Application
13.2.7. Europe Agricultural Pheromone Revenue By Mode of Application
13.3. UK
13.4. France
13.5. Germany
13.6. Italy
13.7. Spain
13.8. Russia
13.9. Rest of Europe
CHAPTER NO. 14: ASIA PACIFIC AGRICULTURAL PHEROMONE MARKET – COUNTRY ANALYSIS
14.1. Asia Pacific Agricultural Pheromone Overview by Country Segment
14.1.1. Asia Pacific Agricultural Pheromone Revenue Share By Region
14.2. Asia Pacific
14.2.1. Asia Pacific Agricultural Pheromone Revenue By Country
14.2.2. Crop Type
14.2.3. Asia Pacific Agricultural Pheromone Revenue By Crop Type
14.2.4. Function
14.2.5. Asia Pacific Agricultural Pheromone Revenue By Function
14.2.5. Mode of Application
14.2.7. Asia Pacific Agricultural Pheromone Revenue By Mode of Application
14.3. China
14.4. Japan
14.5. South Korea
14.6. India
14.7. Australia
14.8. Southeast Asia
14.9. Rest of Asia Pacific
CHAPTER NO. 15: LATIN AMERICA AGRICULTURAL PHEROMONE MARKET – COUNTRY ANALYSIS
15.1. Latin America Agricultural Pheromone Overview by Country Segment
15.1.1. Latin America Agricultural Pheromone Revenue Share By Region
15.2. Latin America
15.2.1. Latin America Agricultural Pheromone Revenue By Country
15.2.2. Crop Type
15.2.3. Latin America Agricultural Pheromone Revenue By Crop Type
15.2.4. Function
15.2.5. Latin America Agricultural Pheromone Revenue By Function
15.2.6. Mode of Application
15.2.7. Latin America Agricultural Pheromone Revenue By Mode of Application
15.3. Brazil
15.4. Argentina
15.5. Rest of Latin America
CHAPTER NO. 16: MIDDLE EAST AGRICULTURAL PHEROMONE MARKET – COUNTRY ANALYSIS
16.1. Middle East Agricultural Pheromone Overview by Country Segment
16.1.1. Middle East Agricultural Pheromone Revenue Share By Region
16.2. Middle East
16.2.1. Middle East Agricultural Pheromone Revenue By Country
16.2.2. Crop Type
16.2.3. Middle East Agricultural Pheromone Revenue By Crop Type
16.2.4. Function
16.2.5. Middle East Agricultural Pheromone Revenue By Function
16.2.6. Mode of Application
16.2.7. Middle East Agricultural Pheromone Revenue By Mode of Application
16.3. GCC Countries
16.4. Israel
16.5. Turkey
16.6. Rest of Middle East
CHAPTER NO. 17: AFRICA AGRICULTURAL PHEROMONE MARKET – COUNTRY ANALYSIS
17.1. Africa Agricultural Pheromone Overview by Country Segment
17.1.1. Africa Agricultural Pheromone Revenue Share By Region
17.2. Africa
17.2.1. Africa Agricultural Pheromone Revenue By Country
17.2.2. Crop Type
17.2.3. Africa Agricultural Pheromone Revenue By Crop Type
17.2.4. Function
17.2.5. Africa Agricultural Pheromone Revenue By Function
17.2.6. Mode of Application
17.2.7. Africa Agricultural Pheromone Revenue By Mode of Application
17.3. South Africa
17.4. Egypt
17.5. Rest of Africa
CHAPTER NO. 18: COMPANY PROFILES
18.1. Shin-Etsu Chemical Co., Ltd.
18.1.1. Company Overview
18.1.2. Product Portfolio
18.1.3. Financial Overview
18.1.4. Recent Developments
18.1.5. Growth Strategy
18.1.6. SWOT Analysis
18.2. BASF SE
18.3. ISCA Technologies
18.4. Russell IPM
18.5. Suterra LLC
18.6. Biobest Group
18.7. Provivi, Inc.
18.8. BioControle
18.9. Trécé, Inc.
18.10. Bedoukian Research, Inc.