
Market Overview
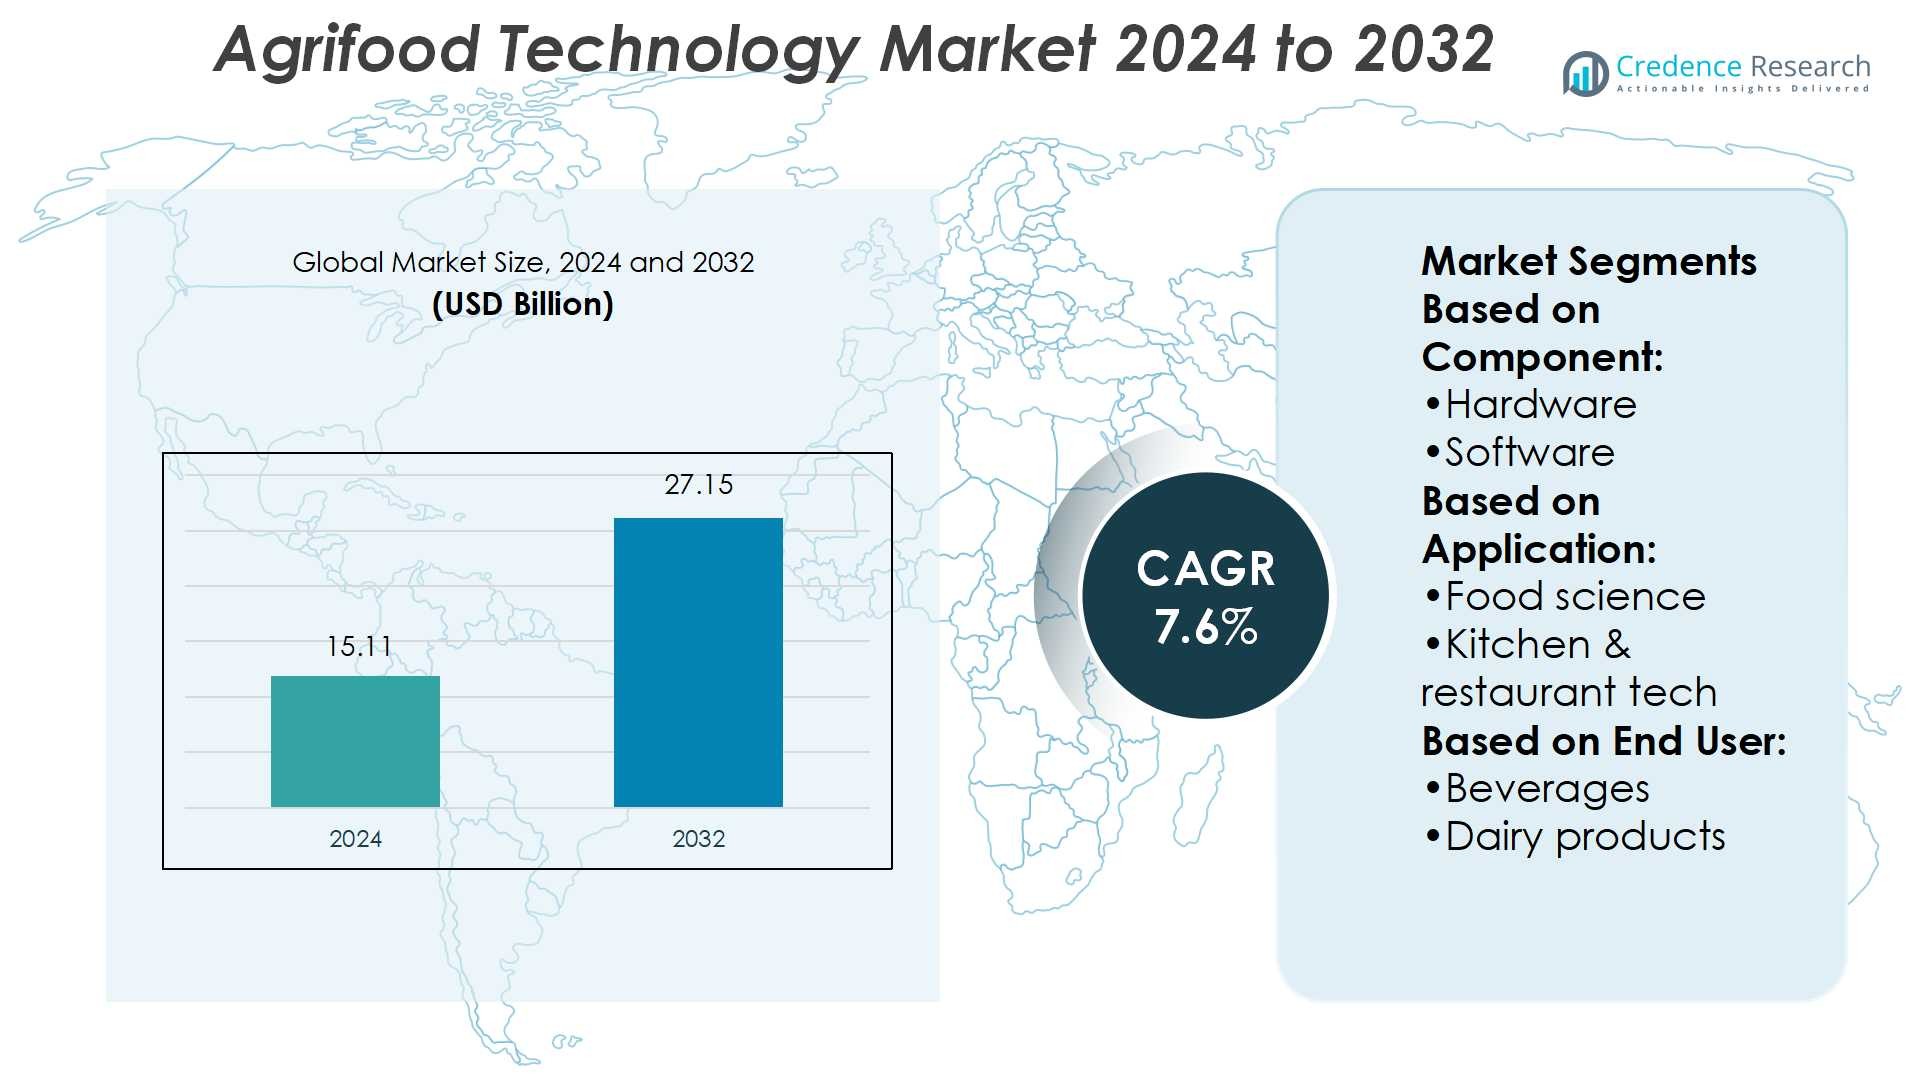
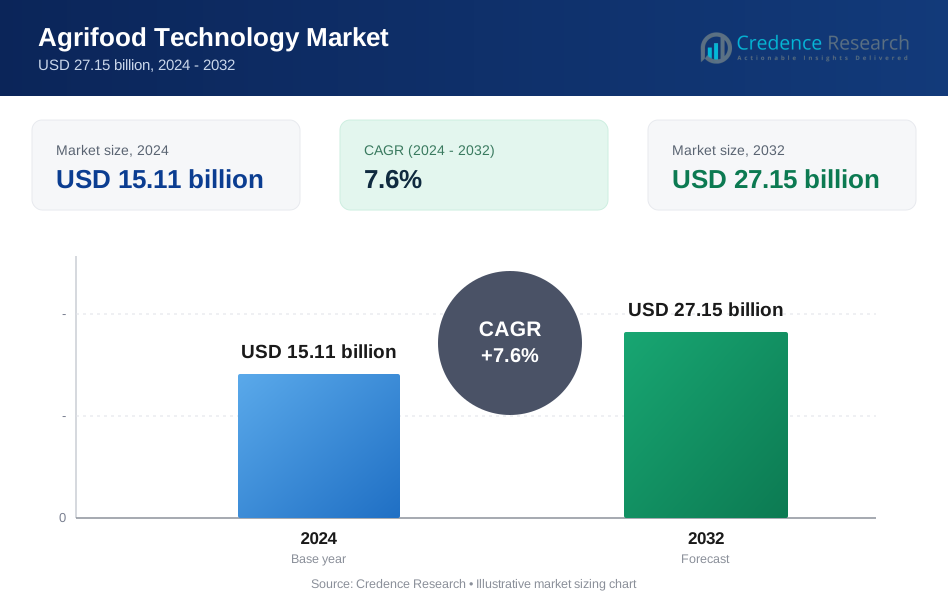
Agrifood Technology Market size was valued USD 15.11 billion in 2024 and is anticipated to reach USD 27.15 billion by 2032, at a CAGR of 7.6% during the forecast period.
| REPORT ATTRIBUTE | DETAILS |
|---|---|
| Historical Period | 2020-2023 |
| Base Year | 2024 |
| Forecast Period | 2025-2032 |
| Agrifood Technology Market Size 2024 | USD 15.11 Billion |
| Agrifood Technology Market, CAGR | 7.6% |
| Agrifood Technology Market Size 2032 | USD 27.15 Billion |
The agrifood technology market is driven by leading players such as TRAX IMAGE RECOGNITION, CUBIQ FOODS, Delivery Hero SE, Carlisle Technology, Miso Robotics, HelloFresh SE, Swiggy, LUNCHBOX, Nymble (Epifeast Inc.), and Flytrex Inc., each advancing innovation across the food value chain. These companies focus on automation, AI-driven analytics, sustainable food solutions, and advanced logistics to address growing consumer demand for efficiency, safety, and convenience. Among regions, Asia-Pacific leads the global market with a 34% share, supported by large-scale food production, rapid adoption of smart farming, and expanding e-commerce-driven delivery systems. This dominance reflects both scale and technological integration.
Market Insights
- The agrifood technology market was valued at USD 15.11 billion in 2024 and is projected to reach USD 27.15 billion by 2032, registering a CAGR of 7.6%.
- Key drivers include automation, AI-based analytics, and sustainable food technologies that improve efficiency, safety, and transparency across the food value chain.
- Major trends highlight growing demand for alternative proteins, blockchain-enabled traceability, and robotics in processing, packaging, and restaurant operations.
- Competitive activity is strong, with companies such as TRAX IMAGE RECOGNITION, CUBIQ FOODS, Delivery Hero SE, and others focusing on innovation, while high implementation costs remain a major restraint.
- Asia-Pacific leads the market with a 34% share, supported by rapid adoption of smart farming and e-commerce-driven delivery, while hardware dominates the component segment with a significant share, driven by robotics, IoT systems, and advanced monitoring solutions.
Market Segmentation Analysis:
By Component
In the agrifood technology market, hardware holds the dominant share, accounting for 45% of the segment. Advanced sensors, robotics, and IoT-enabled machinery drive efficiency in food production, storage, and quality monitoring. Hardware adoption is accelerating due to automation demand, precision farming, and real-time food safety compliance. Software follows closely, supporting data analytics, AI-based food modeling, and predictive supply management. Service-based offerings, such as consulting and system integration, remain smaller but continue growing as enterprises seek tailored solutions to optimize digital transformation across food ecosystems.
- For instance, Beyond Meat’s Beyond IV product line (its fourth-generation formula) replaced coconut oil and canola oil with avocado oil, cutting saturated fat content in the product to just 2 grams per link in its Beyond IV Sausage variant.
By Application
Food science leads the application segment with a 38% market share, supported by investments in biotechnology, food safety testing, and nutritional innovation. The demand for healthier formulations, alternative proteins, and sustainable food research drives this growth. Kitchen and restaurant technologies follow, leveraging AI-powered ordering systems, automated cooking equipment, and contactless payment solutions. Delivery and supply chain applications also expand steadily, driven by e-commerce adoption, last-mile logistics optimization, and traceability standards. Other applications, including waste reduction and energy-efficient food systems, gain momentum with rising sustainability mandates and consumer awareness.
- For instance, Tyson’s R&D “Tyson Discovery Center” has a 39,000-square-foot pilot plant in Springdale with 19 test kitchens, a sensory lab, and packaging innovation lab, used to prototype new formats in weeks rather than months.
By End User
Beverages represent the dominant end-user category with 30% of market share, fueled by automation in bottling, real-time quality checks, and growing demand for functional and plant-based drinks. Dairy products and bakery segments also see rapid adoption, integrating smart sensors for freshness monitoring and automated production lines. Meat and seafood players invest in traceability solutions to address food safety and sustainability. Grain and oil processors leverage predictive analytics for yield optimization, while fruits and vegetable producers adopt precision grading and packaging technologies. Diverse applications across end users reflect the sector’s push for efficiency and regulatory compliance.
Key Growth Drivers
Rising Demand for Food Safety and Quality
Stringent global regulations and consumer demand for transparency are driving adoption of agrifood technologies. Automated monitoring systems, IoT sensors, and blockchain-enabled traceability ensure food safety from production to retail. Companies are integrating predictive analytics to detect contamination risks and maintain compliance with international standards. This focus not only reduces recalls but also builds consumer trust, making food safety a core driver. Increasing regulatory oversight across regions further strengthens investment in technologies that safeguard quality and enhance accountability across the value chain.
- For instance, Nestlé scaled a global IoT Platform that now connects over 2.8 million devices in 97 countries, ingesting about 2.1 billion data points to monitor product quality, safety, and connected consumer devices.
Advancements in Automation and Robotics
Automation and robotics are transforming agriculture and food processing by improving efficiency, precision, and scalability. Robotic harvesters, AI-powered food sorters, and automated packaging machines reduce labor dependence and operational costs. Adoption is accelerating in both developed and emerging markets as companies seek to meet rising food demand with fewer resources. Precision farming tools also enable optimized water and fertilizer usage. By reducing waste and improving consistency, automation supports higher yields and safer products, positioning robotics as a major growth driver in agrifood technology adoption worldwide.
- For instance, Kerry Logistics Network implemented the “KOOLBee” sorting robot in Hong Kong, Tianjin and Dongguan since November 2022. This robot increased overall sorting productivity by 270%.
Shift Toward Sustainable and Alternative Foods
Sustainability imperatives and consumer preferences for healthier diets are driving technological innovation. Food companies invest in plant-based proteins, lab-grown meat, and bioengineered crops to meet changing demand. Agrifood technologies enable resource-efficient production, reduced carbon emissions, and minimal waste across supply chains. Governments also support sustainable agriculture initiatives through subsidies and R&D funding. This shift is creating new markets for alternative foods while reinforcing circular economy practices. The sustainability push ensures continued adoption of innovative agrifood solutions, making it a primary growth driver shaping industry transformation.
Key Trends & Opportunities
Integration of AI and Data Analytics
AI and data analytics are reshaping agrifood operations, enabling predictive crop management, personalized nutrition, and demand forecasting. Companies leverage machine learning for accurate food quality checks, automated supply chain decisions, and waste reduction. Predictive analytics also enhance farm-level productivity by providing real-time insights into soil, weather, and crop health. The trend creates opportunities for technology providers offering end-to-end digital solutions. As food systems become increasingly data-driven, AI integration emerges as a central trend unlocking efficiency, sustainability, and profitability in the global agrifood technology market.
- For instance, Tyson Foods’ “Industrial automation” program uses computer vision at its processing plants to perform real-time chicken tray counts. The system monitors up to 45 million head processed per week to detect under- or over-production in packaging racks.
Expansion of E-commerce and Smart Delivery Systems
E-commerce platforms and smart delivery systems present new opportunities in the agrifood technology market. Increasing consumer preference for online grocery and meal delivery services accelerates investments in last-mile logistics, automated warehousing, and temperature-controlled packaging. Startups and established players deploy drones, robotics, and AI-driven fleet management to reduce delivery times and costs. Traceability technologies also enhance consumer trust in online-purchased food products. The integration of smart delivery with supply chain analytics ensures freshness and compliance, making this trend a key opportunity for companies targeting urban and digital-first consumers.
- For instance, Kraft Heinz is building a 775,000-square-foot automated distribution center in DeKalb, Illinois, which will move more than 60% of its North American foodservice business and approximately 30% of all dry goods through automated facilities.
Key Challenges
High Implementation and Integration Costs
Adopting agrifood technologies requires significant investment in hardware, software, and workforce training. Many small and medium enterprises face challenges in accessing the capital needed to implement robotics, IoT systems, or blockchain solutions. Integration with existing infrastructure adds to costs, delaying large-scale adoption. The financial burden often restricts advanced technology to large corporations, creating a market gap. Until costs decline through scalable production or government incentives, high implementation expenses will remain a key challenge to broader agrifood technology adoption across global markets.
Data Security and Interoperability Issues
With increasing reliance on connected systems, agrifood companies face rising risks of data breaches and cyberattacks. Sensitive supply chain information, farm-level production data, and consumer records must be protected. Lack of standardized platforms and interoperability among technologies further complicates integration, leading to inefficiencies and vulnerabilities. Companies struggle to balance innovation with cybersecurity investments, especially in fragmented markets. Addressing data governance, compliance with privacy laws, and developing interoperable systems remain critical. These challenges must be resolved to ensure trust and continuity in the growing agrifood technology ecosystem.
Regional Analysis
North America
North America holds 32% of the agrifood technology market, driven by strong adoption of automation, robotics, and AI in food production and processing. The U.S. leads with advanced R&D investments, while Canada focuses on sustainable farming practices and traceability systems. High consumer demand for organic, plant-based, and functional foods further accelerates technological integration. Well-established infrastructure and strong venture capital support for agri-tech startups reinforce growth. Strict food safety regulations also drive adoption of monitoring and blockchain-based solutions. The region’s focus on efficiency, quality, and sustainability keeps North America at the forefront of agrifood technology development.
Europe
Europe accounts for 28% of the global market, supported by stringent food safety regulations and sustainability initiatives. Countries such as Germany, France, and the Netherlands lead in implementing precision farming, automated processing, and traceability solutions. The European Union’s Farm-to-Fork Strategy emphasizes eco-friendly practices, boosting demand for sustainable agrifood technologies. Rising adoption of plant-based proteins and alternative food sources also strengthens growth. Robust investment in digital agriculture platforms, supported by public-private partnerships, drives innovation. With a strong regulatory environment and consumer demand for transparency, Europe continues to be a significant hub for agrifood technology adoption and innovation.
Asia-Pacific
Asia-Pacific leads the agrifood technology market with a 34% share, driven by large-scale food production, population growth, and rapid digital adoption. China, India, and Japan dominate with investments in smart farming, e-commerce-driven food delivery, and automation in food processing. Government-backed initiatives promoting food security and sustainability boost adoption of IoT, AI, and blockchain solutions. Growing urbanization and rising disposable incomes fuel demand for convenience foods and safe supply chains. The region also witnesses strong growth in alternative proteins and plant-based products. Asia-Pacific’s scale and innovation ecosystem secure its leadership position in the global agrifood technology market.
Latin America
Latin America captures 4% of the agrifood technology market, with Brazil and Mexico leading adoption. The region’s focus on improving agricultural productivity and reducing post-harvest losses drives demand for digital farming tools, cold chain solutions, and logistics technologies. Export-oriented economies, particularly in fruits, vegetables, and meat, accelerate the adoption of food safety and traceability systems. While investment levels remain lower compared to developed regions, international collaborations and government-led modernization programs are enhancing adoption. Increasing consumer demand for packaged and processed foods also supports market growth, positioning Latin America as an emerging participant in agrifood technology development.
Middle East & Africa
The Middle East & Africa region holds a 2% share of the agrifood technology market, with adoption centered on addressing food security challenges and water scarcity. Countries such as the UAE, Saudi Arabia, and South Africa are investing in vertical farming, hydroponics, and precision irrigation technologies to meet rising demand. Import dependency has pushed governments to encourage local food production using advanced technologies. Emerging e-commerce platforms and growing urbanization also drive investment in food logistics and cold chain solutions. Although adoption remains at an early stage, the region presents significant growth potential through innovation-led agricultural modernization.
Market Segmentations:
By Component:
- Hardware
- Software
By Application:
- Food science
- Kitchen & restaurant tech
By End User:
- Beverages
- Dairy products
By Geography
- North America
- U.S.
- Canada
- Mexico
- Europe
- Germany
- France
- U.K.
- Italy
- Spain
- Rest of Europe
- Asia Pacific
- China
- Japan
- India
- South Korea
- South-east Asia
- Rest of Asia Pacific
- Latin America
- Brazil
- Argentina
- Rest of Latin America
- Middle East & Africa
- GCC Countries
- South Africa
- Rest of the Middle East and Africa
Competitive Landscape
The competitive landscape of the agrifood technology market players such as TRAX IMAGE RECOGNITION, CUBIQ FOODS, Delivery Hero SE, Carlisle Technology, Miso Robotics, HelloFresh SE, Swiggy, LUNCHBOX, Nymble (Epifeast Inc.), and Flytrex Inc. The agrifood technology market is highly competitive, shaped by rapid innovation and diverse business models. Companies are investing heavily in automation, AI-driven analytics, and sustainable food solutions to address rising demand for efficiency, safety, and transparency across the value chain. Digital platforms and smart logistics strengthen food delivery and supply chain operations, while robotics and IoT transform production and processing. Meal-kit services, smart kitchen systems, and drone-based logistics are expanding consumer convenience and accessibility. The market’s competitiveness is reinforced by continuous R&D, strategic partnerships, and the push toward sustainability-driven technologies, ensuring ongoing disruption and growth.
Key Player Analysis
- TRAX IMAGE RECOGNITION
- CUBIQ FOODS
- Delivery Hero SE
- Carlisle Technology
- Miso Robotics
- HelloFresh SE
- Swiggy
- LUNCHBOX
- Nymble (Epifeast Inc.)
- Flytrex Inc.
Recent Developments
- In April 2025, Farmers Edge Inc. partnered with Taurus Ag Marketing Inc. to expand access to high-quality soil testing solutions across Canada. Taurus will improve the availability of advanced lab services, delivering industry-leading turnaround times and tailored insights to support data-driven decisions for growers, agronomists, and agri-businesses.
- In April 2025, Garmin introduced the Instinct 3 Series in India, raising the bar for rugged smartwatch innovation. The Instinct 3 Series delivers robust features to endure the most demanding environment and is tailored for adventure seekers, outdoor enthusiasts, and fitness lovers.
- In November 2024, Sony Group Corporation (Japan) and CardioComm Solutions (U.S.) partnered to integrate its advanced ECG technology into Sony’s mSafety platform, enhancing wearable technology capabilities. This collaboration allows users to monitor heart health directly through a wearable device without a smartphone connection.
- In February 2024, Samsung introduced the Galaxy Fit 3 to the Indian market. This entry-level health and fitness tracker features a 1.6-inch AMOLED display, which is 45% wider than its predecessor.
Report Coverage
The research report offers an in-depth analysis based on Component, Application, End-User and Geography. It details leading market players, providing an overview of their business, product offerings, investments, revenue streams, and key applications. Additionally, the report includes insights into the competitive environment, SWOT analysis, current market trends, as well as the primary drivers and constraints. Furthermore, it discusses various factors that have driven market expansion in recent years. The report also explores market dynamics, regulatory scenarios, and technological advancements that are shaping the industry. It assesses the impact of external factors and global economic changes on market growth. Lastly, it provides strategic recommendations for new entrants and established companies to navigate the complexities of the market.
Future Outlook
- Adoption of AI and machine learning will enhance predictive farming and food quality checks.
- Automation and robotics will streamline processing, packaging, and restaurant operations.
- Blockchain-based traceability will improve food safety and strengthen consumer trust.
- Drone and autonomous delivery systems will expand last-mile food logistics.
- Sustainable farming technologies will support reduced water use and lower carbon emissions.
- Alternative proteins and lab-grown meat will gain stronger market presence.
- Smart kitchen appliances will drive convenience for households and restaurants.
- E-commerce platforms will continue reshaping food purchasing and distribution.
- Governments will increase support for agri-tech innovation through policies and incentives.
- Data-driven solutions will improve supply chain efficiency and reduce food waste.
Request a Free Sample
Fill in your details and we'll send you a free sample report.
- Sample data tables & charts
- Research methodology
Need a Custom Version of This Report?
Tailor the scope, geography, or segments to your exact requirements.
- Custom geography or segment scope
- Direct access to our analyst team
Frequently Asked Questions
What is the current market size for Agrifood Technology Market, and what is its projected size in 2032?
At what Compound Annual Growth Rate is the Agrifood Technology Market projected to grow between 2025 and 2032?
Which Agrifood Technology Market segment held the largest share in 2024?
What are the primary factors fueling the growth of the Agrifood Technology Market?
Who are the leading companies in the Agrifood Technology Market?
Which region commanded the largest share of the Agrifood Technology Market in 2024?
Table of Content
Chapter 1. Report Introduction
- 1.1 Report Description & Purpose
- 1.1.1 Report Title & Market Definition
- 1.1.2 Unique Selling Propositions (USP) & Key Differentiators
- 1.1.3 Value Proposition for Stakeholders
- 1.2 Research Objectives
- 1.2.1 Market Sizing Objectives (Volume & Revenue)
- 1.2.2 Segmentation Objectives
- 1.2.3 Competitive Intelligence Objectives
- 1.2.4 Forecast & Scenario Objectives
- 1.3 Report Scope
- 1.3.1 Agrifood Technology Scope – Types & Subtypes Covered
- 1.3.2 Geographic Scope – Regions & Countries Covered
- 1.3.3 Historical Period, Base Year & Forecast Period (2024; forecast to 2032)
- 1.3.4 Inclusions & Exclusions
- 1.4 HS Code & Classification Framework
- 1.5 Currency, Units & Pricing Basis
- 1.6 Target Stakeholders
- 1.7 Limitations & Assumptions
Chapter 2. Executive Summary
- 2.1 Global Agrifood Technology Market Snapshot
- 2.1.1 Market Size – Historical (2024) & Forecast (2024-2032) (2024: USD 15.11 billion → 2032: USD 27.15 billion)
- 2.1.2 Volume & Revenue – Global Totals
- 2.1.3 Key Market Highlights – Top Five Facts
- 2.2 Agrifood Technology Market Segmentation Snapshot
- 2.2.1 Market Split by Region – 2024 vs. 2032
- 2.3 Competitive Snapshot
- 2.3.1 Top 10 Players by Revenue Share – 2024
- 2.3.2 Top 10 Players by Volume Share – 2024
- 2.3.3 Recent Strategic Developments (18-Month Summary)
- 2.4 Key Investment Highlights & Strategic Conclusions
Chapter 3. Agrifood Technology Market Dynamics & Industry Analysis
- 3.1 Market Overview & Context
- 3.1.1 Agrifood Technology Market Position in the Broader Automotive Value Chain
- 3.1.2 OEM vs. Replacement Market Dynamics
- 3.1.3 Market Maturity & Development Stage by Region
- 3.2 Agrifood Technology Market Drivers
- 3.3 Agrifood Technology Market Restraints & Challenges
- 3.4 Agrifood Technology Market Opportunities
- 3.5 Porter's Five Forces Analysis
- 3.5.1 Threat of New Entrants
- 3.5.2 Bargaining Power of Suppliers
- 3.5.3 Bargaining Power of Buyers
- 3.5.4 Threat of Substitutes
- 3.5.5 Competitive Rivalry – Intensity Assessment
- 3.6 Agrifood Technology Value Chain Analysis
- 3.6.1 Upstream – Raw Material/Input Suppliers
- 3.6.1.1 Raw Material/Input 1
- 3.6.1.2 Raw Material/Input 2
- 3.6.1.3 Raw Material/Input 3
- 3.6.2 Midstream – Production/Manufacturing/Service Delivery
- 3.6.2.1 Production/Process Overview
- 3.6.2.2 Key Facility Locations & Capacity by Manufacturer
- 3.6.3 Downstream – Distribution & End Consumer
- 3.6.3.1 Primary Channel – B2B/OEM
- 3.6.3.2 Secondary Channels – Dealer, Retail, Online, Direct
- 3.6.4 Value Chain Profitability Analysis
- 3.6.1 Upstream – Raw Material/Input Suppliers
- 3.7 PESTEL Analysis
- 3.7.1 Political Factors
- 3.7.2 Economic Factors
- 3.7.3 Social Factors
- 3.7.4 Technological Factors
- 3.7.5 Environmental Factors
- 3.7.6 Legal Factors
- 3.8 Agrifood Technology Supply Chain Analysis
- 3.8.1 Raw Material/Input Supply Risk Assessment
- 3.8.2 Manufacturing Concentration Risk (Geographic Exposure)
- 3.8.3 Trade Disruption Impact Analysis
- 3.9 Regulatory & Policy Landscape
Note: The regulatory and policy landscape section covers regulations based on their applicability to the market, Agrifood Technology category, geography, and scope of the study. Only regulatory frameworks with a material impact on operations, compliance, trade, sustainability, or market access are analyzed in detail.
Chapter 4. Key Investment Pockets & Opportunity Analysis
- 4.1 Agrifood Technology Market Attractiveness Analysis
- 4.1.1 By Region – Investment Attractiveness Matrix (Volume × CAGR)
- 4.2 Absolute Revenue Growth Opportunity
- 4.2.1 By Region – Absolute USD Growth Through 2032
- 4.3 Incremental Volume Opportunity
- 4.3.1 By Region – Incremental Volume Through 2032
- 4.3.2 Segment – Incremental Volume
- 4.4 Emerging Submarket Opportunity Deep Dive (Subject to Applicability)
- 4.5 Emerging Market Opportunity Scorecards
- 4.5.1 United States
- 4.5.2 Europe
- 4.5.3 Asia
- 4.5.4 Middle East & Africa
Note: Emerging Market Opportunity Scorecards will be included based on relevance and strategic importance. Regions listed are indicative and may vary depending on data availability and market dynamics.
Chapter 5. Agrifood Technology Import-Export Analysis & Trade Flows
- 5.1 Global Trade Overview
- 5.1.1 Global Export Value by Country (2024)
- 5.1.2 Global Export Volume by Country (2024)
- 5.1.3 Global Import Value by Country (2024)
- 5.1.4 Global Import Volume by Country (2024)
- 5.1.5 Net Trade Balance by Country (2024)
- 5.2 Export Analysis – Segment
- 5.2.1 Type 1 (HS Code)
- 5.2.2 Type 2 (HS Code)
- 5.2.3 Type 3 (HS Code)
- 5.2.4 Type 4 (HS Code)
- 5.2.5 Type 5 (HS Code)
- 5.3 Import Analysis – Segment
- 5.3.1 Type 1 (HS Code)
- 5.3.2 Type 2 (HS Code)
- 5.3.3 Type 3 (HS Code)
- 5.3.4 Type 4 (HS Code)
- 5.3.5 Type 5 (HS Code)
- 5.4 Average Unit Trade Prices
- 5.4.1 Average Export Price – Segment & Country
- 5.4.2 Average Import Price – Segment & Source Country
- 5.4.3 Price Trends (2024)
- 5.5 Key Trade Route Analysis
- 5.5.1 Trade Route 1
- 5.5.2 Trade Route 2
- 5.5.3 Trade Route 3
- 5.5.4 Trade Route 4
- 5.5.5 Trade Route 5
- 5.6 Trade Policy Impact Assessment
- 5.6.1 US Anti-Dumping & Section 301 Tariffs
- 5.6.2 EU Customs Union Impact
- 5.6.3 Major Free Trade Agreements
- 5.6.4 USMCA Rules of Origin
Note: Trade policy analysis will be included only where relevant to the Agrifood Technology market.
Chapter 6. Competitive Landscape & Company Benchmarking
- 6.1 Agrifood Technology Market Concentration & Structure
- 6.1.1 Herfindahl-Hirschman Index (HHI) – vs. 2024
- 6.1.2 Tier 1, Tier 2 & Tier 3 Market Structure
- 6.1.3 Global, Regional & Local Player Dynamics
- 6.2 Agrifood Technology Market Share Analysis – 2024
- 6.2.1 Global Revenue Share by Company
- 6.2.2 Global Volume Share by Company
- 6.2.3 Regional Revenue Share
- 6.2.4 Market Share Evolution ( vs. 2024)
- 6.2.5 OEM Segment Share by Company
- 6.2.6 Replacement Segment Share by Company
- 6.3 Production/Delivery Capacity & Facility Analysis
- 6.3.1 Global Installed Capacity
- 6.3.2 Capacity Utilization Rates
- 6.3.3 Production/Output Volume
- 6.3.4 Facility Locations & Capacity Map
- 6.3.5 Planned Capacity Additions
- 6.4 Agrifood Technology Competitive Benchmarking Matrix
- 6.4.1 Revenue, Volume, CAGR & Profitability Comparison
- 6.4.2 Channel Revenue Mix
- 6.4.3 Geographic Revenue Exposure
- 6.4.4 R&D Intensity
- 6.4.5 Sustainability Maturity
- 6.5 Strategic Developments in Agrifood Technology (Last 24 Months)
- 6.5.1 Mergers, Acquisitions & Divestments
- 6.5.2 New Agrifood Technology Launches
- 6.5.3 Facility Expansions
- 6.5.4 Strategic Alliances, Joint Ventures & Partnerships
- 6.5.5 Distribution Expansion & Market Entry
- 6.5.6 Sustainability & ESG Initiatives
- 6.6 Competitive Strategy Mapping
- 6.6.1 Leader, Challenger, Follower & Niche Classification
- 6.6.2 Pricing Strategy Comparison
- 6.6.3 Channel Strategy Matrix
Note: Strategic developments are included based on their materiality and the availability of reliable information.
Chapter 7. Global Agrifood Technology Market – By Distribution Channel
- 7.1 Segment Overview
- 7.1.1 Volume & Revenue Split by Channel (2024 & 2032)
- 7.1.2 Channel Mix Evolution (2024-2032)
Chapter 8. Regional Market Analysis – Global Overview
- 8.1 Global Regional Overview
- 8.1.1 Regional Volume Share
- 8.1.2 Regional Revenue Share
- 8.1.3 Regional Volume by Region
- 8.1.4 Regional Revenue by Region
- 8.1.5 Regional Forecast Through 2032
- 8.2 Cross-Regional Segment Analysis
- 8.2.1 By Distribution Channel
- 8.2.2 By Brand/Price Tier
Chapter 9. North America Agrifood Technology Market
- 9.1 United States
- 9.2 Canada
- 9.3 Mexico
Chapter 10. Europe Agrifood Technology Market
- 10.1 Germany
- 10.2 France
- 10.3 Italy
- 10.4 United Kingdom
- 10.5 Spain
- 10.6 Poland
- 10.7 Russia
- 10.8 Netherlands
- 10.9 Belgium
- 10.10 Sweden
- 10.11 Denmark
- 10.12 Norway
- 10.13 Rest of Europe
Chapter 11. Asia Pacific Agrifood Technology Market
- 11.1 China
- 11.2 India
- 11.3 Japan
- 11.4 South Korea
- 11.5 Thailand
- 11.6 Indonesia
- 11.7 Vietnam
- 11.8 Malaysia
- 11.9 Australia
- 11.10 Rest of Asia Pacific
Chapter 12. Latin America Agrifood Technology Market
- 12.1 Brazil
- 12.2 Argentina
- 12.3 Colombia
- 12.4 Chile
- 12.5 Rest of Latin America
Chapter 13. Middle East Agrifood Technology Market
- 13.1 Saudi Arabia
- 13.2 United Arab Emirates
- 13.3 Turkey
- 13.4 Israel
- 13.5 Iran
- 13.6 Rest of the Middle East
Chapter 14. Africa Agrifood Technology Market
- 14.1 South Africa
- 14.2 Egypt
- 14.3 Nigeria
- 14.4 Morocco
- 14.5 Rest of Africa
Chapter 15. Agrifood Technology Company Profiles
- 15.1 [Company 01]
- 15.1.1 Company Overview
- 15.1.2 Key Management Personnel
- 15.1.3 Products & Services Portfolio
- 15.1.4 Financial Performance
- 15.1.5 Key Market Focus & Geographic Presence
- 15.1.6 Recent Developments & Strategic Initiatives
Note: The company profile list is preliminary and may change based on research findings, market developments, data availability, and client requirements.
Chapter 16. Appendices
- Appendix A – List of Abbreviations & Acronyms
- Appendix B – Industry Classification Code Reference – Full Series
- Appendix C – Production & Capacity Data Tables
- Appendix D – End-Use & Demand Base Tables
- Appendix E – Consumption & Replacement Rate Assumptions
- Appendix F – ASP Reference Tables
- Appendix G – Manufacturing & Facility Database
- Appendix H – Import-Export Data Tables
- Appendix I – Regulatory Summary Tables
- Appendix J – Primary Research Participant List (Anonymized)
- Appendix K – Primary Research Questionnaire Framework
- Appendix L – Data Sources & Bibliography
- Appendix M – Market Size Divergence & Source Comparison
Chapter 17. Research Methodology
- 17.1 Research Framework & Philosophy
- 17.2 Secondary Research – Sources, Hierarchy & Data Extraction
- 17.3 Data Modeling – Bottom-Up & Top-Down Market Sizing
- 17.4 Primary Research – Stakeholder Framework, LOI & Sample Sizes
- 17.5 Forecast Methodology – Regression, Scenario & Sensitivity Analysis
- 17.6 Quality Control – Four-Layer Validation Framework
- 17.7 Limitations & Standard Assumptions
- 17.8 Disclaimer
