
Market Overview
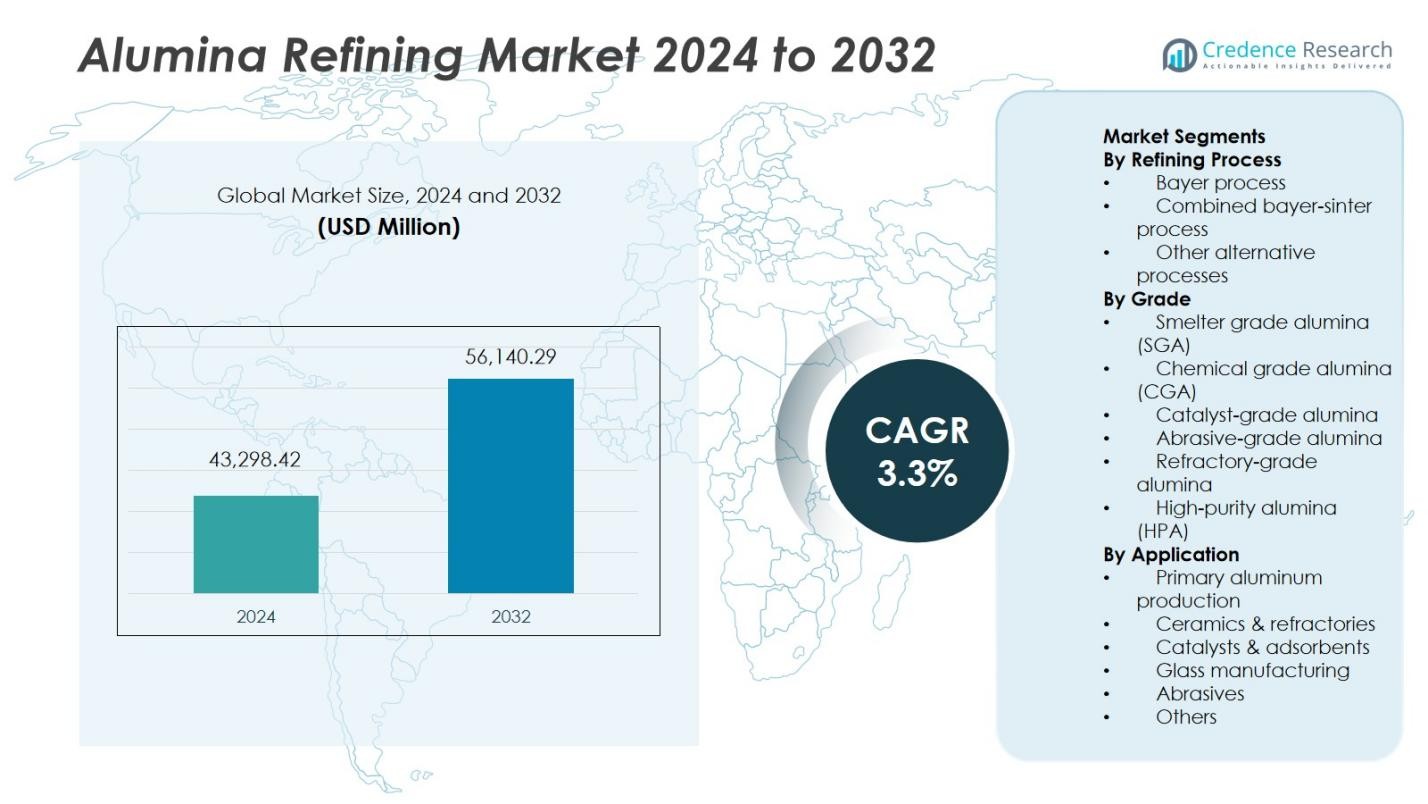
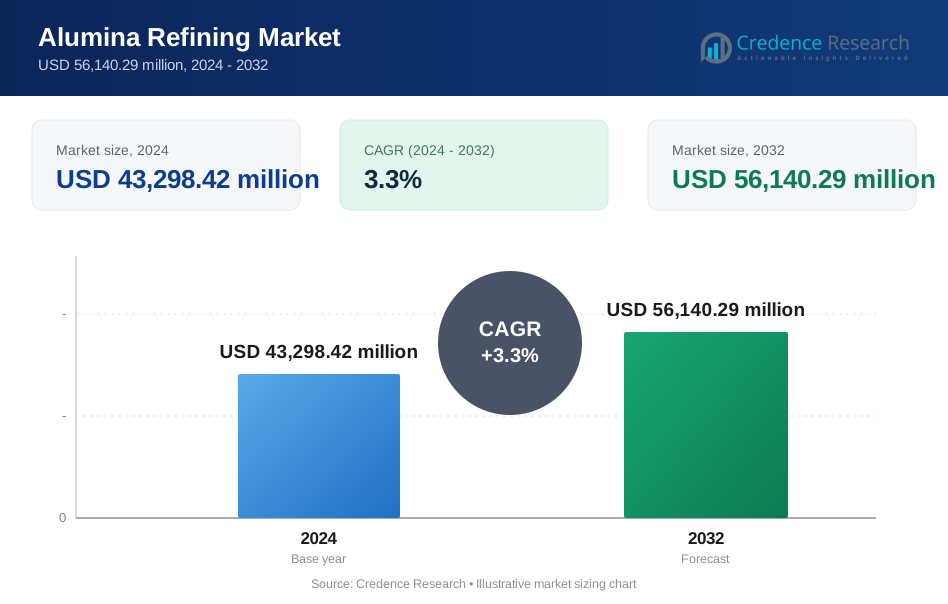
The Alumina Refining Market size was valued at USD 43,298.42 million in 2024 and is anticipated to reach USD 56,140.29 million by 2032, registering a CAGR of 3.3% during the forecast period.
| REPORT ATTRIBUTE | DETAILS |
|---|---|
| Historical Period | 2020-2023 |
| Base Year | 2024 |
| Forecast Period | 2025-2032 |
| Alumina Refining Market Size 2024 | USD 43,298.42 Million |
| Alumina Refining Market, CAGR | 3.3% |
| Alumina Refining Market Size 2032 | USD 56,140.29 Million |
The Alumina Refining Market is led by major companies such as Rio Tinto, Alcoa, Chalco, Rusal, Norsk Hydro, South32, Hindalco, Vedanta, Emirates Global Aluminium, and Orica, which collectively dominate global refining capacity through integrated operations and technological advancement. These companies focus on energy efficiency, digital automation, and sustainability to enhance productivity and reduce environmental impact. Continuous investments in refining modernization and renewable power integration support long-term competitiveness. Asia-Pacific leads the market with a 58% share, driven by large-scale production in China, Australia, and India. North America holds 21%, supported by advanced refining technologies, while Europe accounts for 17%, emphasizing low-carbon operations and circular economy principles. Strategic expansions and partnerships across emerging economies further strengthen market resilience and global supply stability.
Market Insights
- The Alumina Refining Market was valued at USD 43,298.42 million in 2024 and is projected to reach USD 56,140.29 million by 2032, registering a CAGR of 3.3% during 2025–2032.
- Rising demand for aluminum in automotive, aerospace, and construction sectors drives market growth, supported by rapid industrialization and lightweight material adoption.
- Increasing focus on sustainability, digital automation, and high-purity alumina production shapes market trends, with producers investing in energy-efficient and low-emission technologies.
- The market is moderately consolidated with key players such as Rio Tinto, Alcoa, Chalco, and Hindalco focusing on expanding refining capacity, improving process efficiency, and enhancing supply security.
- Asia-Pacific dominates with a 58% share due to strong production in China, Australia, and India, followed by North America at 21% and Europe at 17%, while smelter-grade alumina accounts for 68% of total demand driven by high aluminum output.
 Market Segmentation Analysis:
By Refining Process
The Bayer process dominates the alumina refining market, accounting for 78% of the total share in 2024. This process remains the most widely adopted due to its high efficiency, cost-effectiveness, and ability to produce high-purity alumina from bauxite. The combined Bayer-sinter process holds a smaller but growing share, favored in regions with low-grade bauxite reserves. Other alternative processes, including acid leaching and chloride methods, are still in development stages, focusing on energy savings and environmental sustainability. Continuous process optimization and automation support Bayer process leadership across global refineries.
For instance, Bayer-sinter process adoption in China and Russia, where it is preferred for treating low-grade bauxite ore, achieving lower caustic and bauxite consumption while maintaining competitive energy use.
By Grade
Smelter Grade Alumina (SGA) leads the market with 68% share in 2024, primarily driven by its extensive use in aluminum smelting through electrolytic reduction. Chemical Grade Alumina (CGA) and High-Purity Alumina (HPA) follow, gaining traction in catalysts, ceramics, and electronic components. Refractory and abrasive grades maintain stable demand in metallurgical and polishing industries. Increasing aluminum production for automotive, construction, and packaging applications continues to boost SGA demand, while rising purity requirements in emerging technologies enhance HPA segment growth.
For instance, companies like Polar Performance Materials manufacture 4N and 5N purity grades used in semiconductor manufacturing, where ultra-high purity alumina coatings enhance durability and reduce yield loss significantly.
By Application
Primary aluminum production represents the dominant application segment, accounting for 70% of the global market share in 2024. This dominance stems from the massive demand for aluminum in automotive, aerospace, and industrial sectors. Ceramics and refractories form the second-largest application area, supported by infrastructure expansion and high-temperature process industries. Catalyst and adsorbent uses, along with glass manufacturing and abrasives, collectively hold the remaining share. Growing energy-efficient aluminum smelters and increased adoption of lightweight materials further strengthen the alumina refining demand across major economies.
Key Growth Drivers
Rising Aluminum Demand Across End-Use Industries
The increasing need for aluminum in transportation, construction, and packaging sectors drives alumina refining demand. Lightweight materials are essential in automotive and aerospace applications, boosting smelter-grade alumina consumption. Rapid urbanization and renewable energy expansion also contribute to strong aluminum output. The ongoing global transition toward electric vehicles and energy-efficient manufacturing further strengthens market growth, ensuring continuous alumina demand across both mature and emerging industrial regions.
For instance, in the aerospace sector, Boeing uses aluminum extensively to enhance aircraft strength while reducing weight, supporting alumina demand.
Advancements in Refining Technologies
Technological improvements in alumina refining enhance productivity, reduce costs, and improve environmental performance. Modern refineries are adopting automation, predictive maintenance, and data analytics for better efficiency and yield. Integration of energy recovery systems and low-carbon technologies helps lower emissions and operational expenses. These innovations allow refiners to remain competitive while meeting global sustainability goals and tightening environmental regulations, reinforcing their long-term industry position.
For instance, Alcoa has implemented AI-driven predictive maintenance systems across its facilities, leading to a 10% reduction in maintenance person-hours and a 20% decrease in unplanned downtime, optimizing operational efficiency and lowering maintenance costs.
Expanding Demand for High-Purity Alumina (HPA)
High-purity alumina demand is rapidly growing due to its critical use in electronics, LEDs, and lithium-ion batteries. The clean energy transition and electric vehicle adoption further expand HPA applications. Its superior thermal stability and purity make it essential for semiconductors and optical materials. Refineries focusing on advanced purification processes benefit from higher margins and long-term growth opportunities, positioning HPA production as a key strategic segment within the alumina industry.
Key Trends & Opportunities
Increasing Focus on Sustainability and Circular Economy
Sustainability has become a defining trend in the alumina refining industry. Refineries are investing in carbon capture, waste recycling, and water reuse to minimize their environmental impact. Adoption of renewable energy sources such as solar and hydropower supports cleaner production. Circular economy initiatives, including red mud valorization, improve material efficiency. These sustainability-focused strategies enhance regulatory compliance, attract green investors, and strengthen the environmental credibility of leading alumina producers.
For instance, Vedanta Aluminium in India has collaborated with NITI Aayog and national research institutions to develop techniques for extracting valuable materials like pig iron, alumina, titania, and rare earth oxides including scandium from red mud, a major byproduct of alumina refining, advancing circular economy practices and supporting India’s self-reliance in critical minerals.
Strategic Integration and Regional Expansion
Major producers are pursuing integration and geographic expansion to secure raw material supply and strengthen market presence. Backward integration ensures access to quality bauxite reserves, while forward expansion enhances downstream aluminum production capacity. New projects in Asia-Pacific, the Middle East, and Africa are reshaping supply chains and reducing transportation costs. Strategic alliances and joint ventures across emerging economies are enabling companies to achieve operational resilience and long-term competitiveness.
For instance, Bahrain (Alba), the world's largest single-site aluminium smelter, which recently forged a strategic partnership with Shandong Innovation Group and BlueFive Capital to optimize the global aluminium supply chain, including upstream investments beyond Bahrain.
Key Challenges
High Energy Consumption and Production Costs
Energy represents a significant share of total alumina refining expenses, posing a major cost challenge. The Bayer process, though efficient, demands large quantities of electricity and fuel. Rising global energy prices further strain refinery margins. Producers in regions lacking affordable energy sources face reduced competitiveness. Transitioning to renewable power, improving heat recovery, and adopting process innovations are crucial steps for lowering production costs and sustaining profitability.
Environmental Regulations and Waste Management Issues
Stringent global regulations on emissions, waste disposal, and water consumption challenge alumina producers. The disposal of red mud, a toxic by-product, remains a critical environmental concern. Compliance with sustainability standards often requires costly waste treatment and storage systems. Non-compliance risks financial penalties and reputational damage. To overcome these issues, companies are investing in eco-friendly refining technologies and developing sustainable residue reuse methods to ensure long-term environmental compliance.
Regional Analysis
North America
North America holds a 21% market share in the global alumina refining market, driven by strong aluminum production capacity in the United States and Canada. The region benefits from advanced refining technologies, sustainable energy integration, and high demand from aerospace and automotive industries. Continuous investments in digitalized refineries and renewable-powered operations support efficiency gains. The growing focus on domestic production and reduced import dependency further enhances regional competitiveness. Environmental compliance and recycling initiatives strengthen North America’s position as a mature yet evolving alumina refining hub.
Europe
Europe accounts for a 17% market share, led by major refineries in Germany, Norway, and Ireland. The region emphasizes low-carbon refining processes and circular economy models to meet strict EU environmental standards. The presence of major players such as Norsk Hydro drives process innovation and sustainability advancements. Rising demand for green aluminum in construction and transport sectors promotes steady growth. Ongoing investment in energy efficiency and hydrogen-based refining projects further aligns with Europe’s carbon-neutral targets, ensuring long-term market stability across the continent.
Asia-Pacific
Asia-Pacific dominates the global alumina refining market with a 58% market share, anchored by China, Australia, and India. China remains the world’s largest producer and consumer of alumina due to its vast bauxite reserves and integrated aluminum smelters. Australia leads in bauxite exports and advanced refining infrastructure, while India experiences steady growth through capacity expansions by Hindalco and Vedanta. Rapid industrialization, urban infrastructure projects, and increasing EV production drive alumina demand. The region’s government-backed energy transition policies and cost-effective production further reinforce Asia-Pacific’s global dominance.
Latin America
Latin America holds a 3% market share, primarily supported by Brazil’s strong bauxite mining base and alumina refining capacity. The region’s competitive advantage stems from abundant natural resources and growing foreign investments in sustainable refining operations. Brazil leads regional output with modern facilities such as Alunorte, supported by continuous capacity expansions. Rising aluminum exports to North America and Europe stimulate market growth. However, infrastructural challenges and energy dependency constrain full-scale development. Initiatives to modernize logistics and improve renewable energy integration are gradually enhancing Latin America’s refining competitiveness.
Middle East & Africa
The Middle East & Africa region captures a 1% market share, driven by growing refining operations in the United Arab Emirates and South Africa. The establishment of Emirates Global Aluminium’s Al Taweelah refinery has positioned the UAE as a regional leader. Abundant energy resources and proximity to key export markets provide strategic advantages. Africa’s bauxite-rich nations, such as Guinea, are attracting large-scale investments in integrated alumina projects. However, limited technological infrastructure and political uncertainties remain challenges. Continuous investment in energy-efficient technologies and infrastructure expansion is improving regional refining potential.
Market Segmentations:
By Refining Process
- Bayer process
- Combined bayer-sinter process
- Other alternative processes
By Grade
- Smelter grade alumina (SGA)
- Chemical grade alumina (CGA)
- Catalyst-grade alumina
- Abrasive-grade alumina
- Refractory-grade alumina
- High-purity alumina (HPA)
By Application
- Primary aluminum production
- Ceramics & refractories
- Catalysts & adsorbents
- Glass manufacturing
- Abrasives
- Others
By Region
- North America
- U.S.
- Canada
- Mexico
- Europe
- Germany
- France
- U.K.
- Italy
- Spain
- Rest of Europe
- Asia Pacific
- China
- Japan
- India
- South Korea
- South-east Asia
- Rest of Asia Pacific
- Latin America
- Brazil
- Argentina
- Rest of Latin America
- Middle East & Africa
- GCC Countries
- South Africa
- Rest of the Middle East and Africa
Competitive Landscape
The competitive landscape of the alumina refining market features key players such as Rio Tinto, Alcoa, Norsk Hydro, Chalco, Rusal, South32, Hindalco, Vedanta, Emirates Global Aluminium, and Orica. The market is moderately consolidated, with top companies controlling a significant portion of global refining capacity. These players focus on expanding production efficiency, integrating renewable energy, and optimizing supply chains to maintain competitiveness. Strategic collaborations and technology-driven sustainability initiatives, such as waste minimization and carbon reduction programs, are shaping long-term growth. Regional expansion, especially in Asia-Pacific and the Middle East, remains a core focus to meet rising aluminum demand. Companies are also investing in high-purity alumina production to diversify portfolios and capture value-added market opportunities. Overall, innovation, operational excellence, and sustainability continue to define competitive positioning in the alumina refining industry.
Key Player Analysis
- Rio Tinto
- Hindalco
- South32
- Alcoa
- Orica
- Chalco
- Vedanta
- Rusal
- Emirates Global Aluminium
- Norsk Hydro
Recent Developments
- In August 2024, Alcoa Corporation completed the acquisition of Alumina Limited, gaining full ownership of its bauxite and alumina operations previously managed under a joint venture.
- In June 2025, Hindalco Industries announced the acquisition of U.S.-based AluChem for USD 125 million to strengthen its specialty alumina portfolio, particularly in low-soda and high-value segments.
- In May 2025, Rio Tinto, in collaboration with Indium Corporation, successfully extracted the first primary gallium from its alumina refining stream, marking a technological milestone that opens new value-added opportunities in refinery by-products.
Report Coverage
The research report offers an in-depth analysis based on Refining Process, Grade, Application and Region. It details leading market players, providing an overview of their business, product offerings, investments, revenue streams, and key applications. Additionally, the report includes insights into the competitive environment, SWOT analysis, current market trends, as well as the primary drivers and constraints. Furthermore, it discusses various factors that have driven market expansion in recent years. The report also explores market dynamics, regulatory scenarios, and technological advancements that are shaping the industry. It assesses the impact of external factors and global economic changes on market growth. Lastly, it provides strategic recommendations for new entrants and established companies to navigate the complexities of the market.
Future Outlook
- The alumina refining market will grow steadily due to rising global aluminum demand.
- Companies will focus on energy-efficient refining technologies to lower production costs.
- High-purity alumina will gain traction from electronics and battery applications.
- Asia-Pacific will remain the dominant refining hub driven by industrial expansion.
- Investments in renewable-powered refineries will support sustainability goals.
- Digital automation and predictive analytics will enhance process control and output.
- Strategic mergers and joint ventures will strengthen global supply chain stability.
- Waste recycling and red mud valorization will become key environmental priorities.
- Governments will enforce stricter emission standards, driving green technology adoption.
- Long-term growth will rely on balancing cost optimization with environmental compliance.
Request a Free Sample
Fill in your details and we'll send you a free sample report.
- Sample data tables & charts
- Research methodology
Need a Custom Version of This Report?
Tailor the scope, geography, or segments to your exact requirements.
- Custom geography or segment scope
- Direct access to our analyst team
Frequently Asked Questions
What is the current market size for the Alumina Refining Market, and what is its projected size in 2032?
At what Compound Annual Growth Rate is the Alumina Refining Market projected to grow between 2025 and 2032?
Which Alumina Refining Market segment held the largest share in 2024?
What are the primary factors fueling the growth of the Alumina Refining Market?
Who are the leading companies in the Alumina Refining Market?
Which region commanded the largest share of the Alumina Refining Market in 2024?
Table of Content
Chapter 1. Report Introduction
- 1.1 Report Description & Purpose
- 1.1.1 Report Title & Market Definition
- 1.1.2 Unique Selling Propositions (USP) & Key Differentiators
- 1.1.3 Value Proposition for Stakeholders
- 1.2 Research Objectives
- 1.2.1 Market Sizing Objectives (Volume & Revenue)
- 1.2.2 Segmentation Objectives
- 1.2.3 Competitive Intelligence Objectives
- 1.2.4 Forecast & Scenario Objectives
- 1.3 Report Scope
- 1.3.1 Alumina Refining Scope – Types & Subtypes Covered
- 1.3.2 Geographic Scope – Regions & Countries Covered
- 1.3.3 Historical Period, Base Year & Forecast Period (2024; forecast to 2032)
- 1.3.4 Inclusions & Exclusions
- 1.4 HS Code & Classification Framework
- 1.5 Currency, Units & Pricing Basis
- 1.6 Target Stakeholders
- 1.7 Limitations & Assumptions
Chapter 2. Executive Summary
- 2.1 Global Alumina Refining Market Snapshot
- 2.1.1 Market Size – Historical (2024) & Forecast (2024-2032) (2024: USD 43,298.42 million → 2032: USD 56,140.29 million)
- 2.1.2 Volume & Revenue – Global Totals
- 2.1.3 Key Market Highlights – Top Five Facts
- 2.2 Alumina Refining Market Segmentation Snapshot
- 2.2.1 Market Split by Region – 2024 vs. 2032
- 2.3 Competitive Snapshot
- 2.3.1 Top 10 Players by Revenue Share – 2024
- 2.3.2 Top 10 Players by Volume Share – 2024
- 2.3.3 Recent Strategic Developments (18-Month Summary)
- 2.4 Key Investment Highlights & Strategic Conclusions
Chapter 3. Alumina Refining Market Dynamics & Industry Analysis
- 3.1 Market Overview & Context
- 3.1.1 Alumina Refining Market Position in the Broader Automotive Value Chain
- 3.1.2 OEM vs. Replacement Market Dynamics
- 3.1.3 Market Maturity & Development Stage by Region
- 3.2 Alumina Refining Market Drivers
- 3.3 Alumina Refining Market Restraints & Challenges
- 3.4 Alumina Refining Market Opportunities
- 3.5 Porter's Five Forces Analysis
- 3.5.1 Threat of New Entrants
- 3.5.2 Bargaining Power of Suppliers
- 3.5.3 Bargaining Power of Buyers
- 3.5.4 Threat of Substitutes
- 3.5.5 Competitive Rivalry – Intensity Assessment
- 3.6 Alumina Refining Value Chain Analysis
- 3.6.1 Upstream – Raw Material/Input Suppliers
- 3.6.1.1 Raw Material/Input 1
- 3.6.1.2 Raw Material/Input 2
- 3.6.1.3 Raw Material/Input 3
- 3.6.2 Midstream – Production/Manufacturing/Service Delivery
- 3.6.2.1 Production/Process Overview
- 3.6.2.2 Key Facility Locations & Capacity by Manufacturer
- 3.6.3 Downstream – Distribution & End Consumer
- 3.6.3.1 Primary Channel – B2B/OEM
- 3.6.3.2 Secondary Channels – Dealer, Retail, Online, Direct
- 3.6.4 Value Chain Profitability Analysis
- 3.6.1 Upstream – Raw Material/Input Suppliers
- 3.7 PESTEL Analysis
- 3.7.1 Political Factors
- 3.7.2 Economic Factors
- 3.7.3 Social Factors
- 3.7.4 Technological Factors
- 3.7.5 Environmental Factors
- 3.7.6 Legal Factors
- 3.8 Alumina Refining Supply Chain Analysis
- 3.8.1 Raw Material/Input Supply Risk Assessment
- 3.8.2 Manufacturing Concentration Risk (Geographic Exposure)
- 3.8.3 Trade Disruption Impact Analysis
- 3.9 Regulatory & Policy Landscape
Note: The regulatory and policy landscape section covers regulations based on their applicability to the market, Alumina Refining category, geography, and scope of the study. Only regulatory frameworks with a material impact on operations, compliance, trade, sustainability, or market access are analyzed in detail.
Chapter 4. Key Investment Pockets & Opportunity Analysis
- 4.1 Alumina Refining Market Attractiveness Analysis
- 4.1.1 By Region – Investment Attractiveness Matrix (Volume × CAGR)
- 4.2 Absolute Revenue Growth Opportunity
- 4.2.1 By Region – Absolute USD Growth Through 2032
- 4.3 Incremental Volume Opportunity
- 4.3.1 By Region – Incremental Volume Through 2032
- 4.3.2 Segment – Incremental Volume
- 4.4 Emerging Submarket Opportunity Deep Dive (Subject to Applicability)
- 4.5 Emerging Market Opportunity Scorecards
- 4.5.1 United States
- 4.5.2 Europe
- 4.5.3 Asia
- 4.5.4 Middle East & Africa
Note: Emerging Market Opportunity Scorecards will be included based on relevance and strategic importance. Regions listed are indicative and may vary depending on data availability and market dynamics.
Chapter 5. Alumina Refining Import-Export Analysis & Trade Flows
- 5.1 Global Trade Overview
- 5.1.1 Global Export Value by Country (2024)
- 5.1.2 Global Export Volume by Country (2024)
- 5.1.3 Global Import Value by Country (2024)
- 5.1.4 Global Import Volume by Country (2024)
- 5.1.5 Net Trade Balance by Country (2024)
- 5.2 Export Analysis – Segment
- 5.2.1 Type 1 (HS Code)
- 5.2.2 Type 2 (HS Code)
- 5.2.3 Type 3 (HS Code)
- 5.2.4 Type 4 (HS Code)
- 5.2.5 Type 5 (HS Code)
- 5.3 Import Analysis – Segment
- 5.3.1 Type 1 (HS Code)
- 5.3.2 Type 2 (HS Code)
- 5.3.3 Type 3 (HS Code)
- 5.3.4 Type 4 (HS Code)
- 5.3.5 Type 5 (HS Code)
- 5.4 Average Unit Trade Prices
- 5.4.1 Average Export Price – Segment & Country
- 5.4.2 Average Import Price – Segment & Source Country
- 5.4.3 Price Trends (2024)
- 5.5 Key Trade Route Analysis
- 5.5.1 Trade Route 1
- 5.5.2 Trade Route 2
- 5.5.3 Trade Route 3
- 5.5.4 Trade Route 4
- 5.5.5 Trade Route 5
- 5.6 Trade Policy Impact Assessment
- 5.6.1 US Anti-Dumping & Section 301 Tariffs
- 5.6.2 EU Customs Union Impact
- 5.6.3 Major Free Trade Agreements
- 5.6.4 USMCA Rules of Origin
Note: Trade policy analysis will be included only where relevant to the Alumina Refining market.
Chapter 6. Competitive Landscape & Company Benchmarking
- 6.1 Alumina Refining Market Concentration & Structure
- 6.1.1 Herfindahl-Hirschman Index (HHI) – vs. 2024
- 6.1.2 Tier 1, Tier 2 & Tier 3 Market Structure
- 6.1.3 Global, Regional & Local Player Dynamics
- 6.2 Alumina Refining Market Share Analysis – 2024
- 6.2.1 Global Revenue Share by Company
- 6.2.2 Global Volume Share by Company
- 6.2.3 Regional Revenue Share
- 6.2.4 Market Share Evolution ( vs. 2024)
- 6.2.5 OEM Segment Share by Company
- 6.2.6 Replacement Segment Share by Company
- 6.3 Production/Delivery Capacity & Facility Analysis
- 6.3.1 Global Installed Capacity
- 6.3.2 Capacity Utilization Rates
- 6.3.3 Production/Output Volume
- 6.3.4 Facility Locations & Capacity Map
- 6.3.5 Planned Capacity Additions
- 6.4 Alumina Refining Competitive Benchmarking Matrix
- 6.4.1 Revenue, Volume, CAGR & Profitability Comparison
- 6.4.2 Channel Revenue Mix
- 6.4.3 Geographic Revenue Exposure
- 6.4.4 R&D Intensity
- 6.4.5 Sustainability Maturity
- 6.5 Strategic Developments in Alumina Refining (Last 24 Months)
- 6.5.1 Mergers, Acquisitions & Divestments
- 6.5.2 New Alumina Refining Launches
- 6.5.3 Facility Expansions
- 6.5.4 Strategic Alliances, Joint Ventures & Partnerships
- 6.5.5 Distribution Expansion & Market Entry
- 6.5.6 Sustainability & ESG Initiatives
- 6.6 Competitive Strategy Mapping
- 6.6.1 Leader, Challenger, Follower & Niche Classification
- 6.6.2 Pricing Strategy Comparison
- 6.6.3 Channel Strategy Matrix
Note: Strategic developments are included based on their materiality and the availability of reliable information.
Chapter 7. Global Alumina Refining Market – By Distribution Channel
- 7.1 Segment Overview
- 7.1.1 Volume & Revenue Split by Channel (2024 & 2032)
- 7.1.2 Channel Mix Evolution (2024-2032)
Chapter 8. Regional Market Analysis – Global Overview
- 8.1 Global Regional Overview
- 8.1.1 Regional Volume Share
- 8.1.2 Regional Revenue Share
- 8.1.3 Regional Volume by Region
- 8.1.4 Regional Revenue by Region
- 8.1.5 Regional Forecast Through 2032
- 8.2 Cross-Regional Segment Analysis
- 8.2.1 By Distribution Channel
- 8.2.2 By Brand/Price Tier
Chapter 9. North America Alumina Refining Market
- 9.1 United States
- 9.2 Canada
- 9.3 Mexico
Chapter 10. Europe Alumina Refining Market
- 10.1 Germany
- 10.2 France
- 10.3 Italy
- 10.4 United Kingdom
- 10.5 Spain
- 10.6 Poland
- 10.7 Russia
- 10.8 Netherlands
- 10.9 Belgium
- 10.10 Sweden
- 10.11 Denmark
- 10.12 Norway
- 10.13 Rest of Europe
Chapter 11. Asia Pacific Alumina Refining Market
- 11.1 China
- 11.2 India
- 11.3 Japan
- 11.4 South Korea
- 11.5 Thailand
- 11.6 Indonesia
- 11.7 Vietnam
- 11.8 Malaysia
- 11.9 Australia
- 11.10 Rest of Asia Pacific
Chapter 12. Latin America Alumina Refining Market
- 12.1 Brazil
- 12.2 Argentina
- 12.3 Colombia
- 12.4 Chile
- 12.5 Rest of Latin America
Chapter 13. Middle East Alumina Refining Market
- 13.1 Saudi Arabia
- 13.2 United Arab Emirates
- 13.3 Turkey
- 13.4 Israel
- 13.5 Iran
- 13.6 Rest of the Middle East
Chapter 14. Africa Alumina Refining Market
- 14.1 South Africa
- 14.2 Egypt
- 14.3 Nigeria
- 14.4 Morocco
- 14.5 Rest of Africa
Chapter 15. Alumina Refining Company Profiles
- 15.1 [Company 01]
- 15.1.1 Company Overview
- 15.1.2 Key Management Personnel
- 15.1.3 Products & Services Portfolio
- 15.1.4 Financial Performance
- 15.1.5 Key Market Focus & Geographic Presence
- 15.1.6 Recent Developments & Strategic Initiatives
Note: The company profile list is preliminary and may change based on research findings, market developments, data availability, and client requirements.
Chapter 16. Appendices
- Appendix A – List of Abbreviations & Acronyms
- Appendix B – Industry Classification Code Reference – Full Series
- Appendix C – Production & Capacity Data Tables
- Appendix D – End-Use & Demand Base Tables
- Appendix E – Consumption & Replacement Rate Assumptions
- Appendix F – ASP Reference Tables
- Appendix G – Manufacturing & Facility Database
- Appendix H – Import-Export Data Tables
- Appendix I – Regulatory Summary Tables
- Appendix J – Primary Research Participant List (Anonymized)
- Appendix K – Primary Research Questionnaire Framework
- Appendix L – Data Sources & Bibliography
- Appendix M – Market Size Divergence & Source Comparison
Chapter 17. Research Methodology
- 17.1 Research Framework & Philosophy
- 17.2 Secondary Research – Sources, Hierarchy & Data Extraction
- 17.3 Data Modeling – Bottom-Up & Top-Down Market Sizing
- 17.4 Primary Research – Stakeholder Framework, LOI & Sample Sizes
- 17.5 Forecast Methodology – Regression, Scenario & Sensitivity Analysis
- 17.6 Quality Control – Four-Layer Validation Framework
- 17.7 Limitations & Standard Assumptions
- 17.8 Disclaimer
