Market Overview:
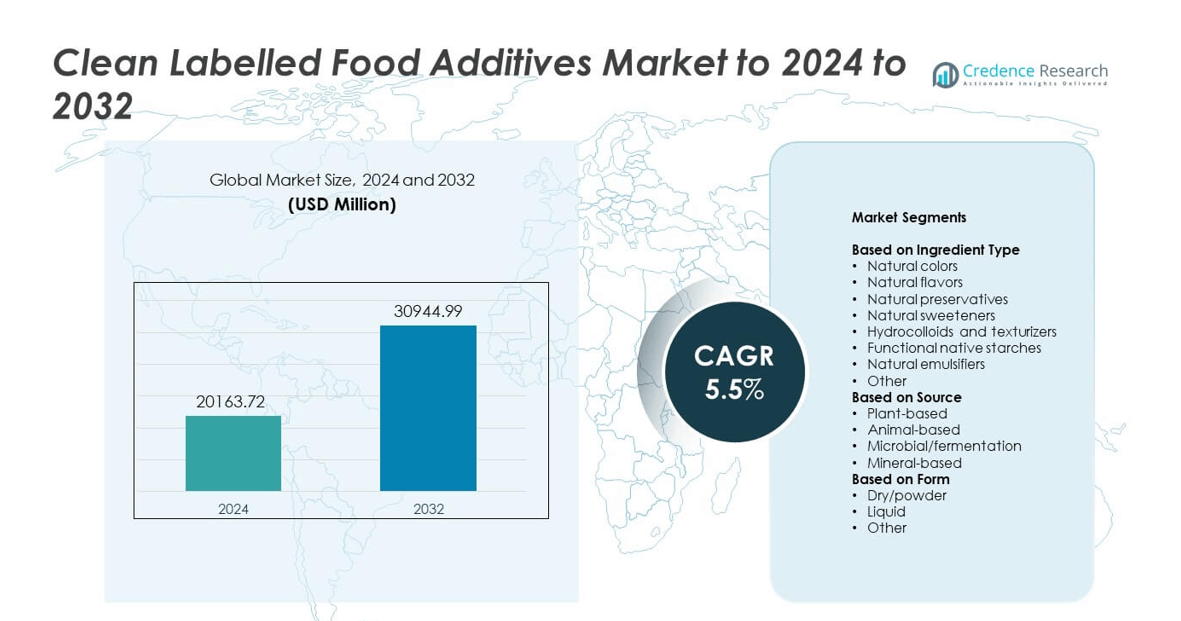
The Clean Labelled Food Additives market size was valued at USD 20163.72 million in 2024 and is anticipated to reach USD 30944.99 million by 2032, at a CAGR of 5.5% during the forecast period.
| REPORT ATTRIBUTE |
DETAILS |
| Historical Period |
2020-2023 |
| Base Year |
2024 |
| Forecast Period |
2025-2032 |
| Clean Labelled Food Additives Market Size 2024 |
USD 20163.72 million |
| Clean Labelled Food Additives Market, CAGR |
5.5% |
| Clean Labelled Food Additives Market Size 2032 |
USD 30944.99 million |
The clean-labelled food additives market is dominated by major players including Cargill, BASF SE, Symrise, Kerry Group, ADM, Corbion, Ingredion, DSM, IFF, and Sensient Technologies. These companies focus on expanding their portfolios through innovation in natural colors, flavors, and functional ingredients that meet rising consumer demand for transparency and sustainability. Strategic collaborations, product reformulations, and advanced extraction technologies drive competitiveness among global leaders. North America led the market in 2024 with a 34.2% share, followed by Europe with 29.8% and Asia-Pacific with 23.7%, reflecting strong regional adoption of clean-label solutions across the food and beverage industry.
Market Insights
- The clean-labelled food additives market was valued at USD 20163.72 million in 2024 and is projected to reach USD 30944.99 million by 2032, expanding at a CAGR of 5.5% during the forecast period.
- Rising consumer awareness of natural ingredients and transparency in labeling drives the market, with growing adoption across beverages, bakery, and dairy sectors.
- The market trend is shifting toward plant-based and functional additives, supported by technological advancements in extraction and fermentation processes.
- Competition remains strong as global players focus on sustainable sourcing, innovation in natural emulsifiers, and expansion in developing markets.
- North America held 34.2% of the market share in 2024, followed by Europe at 29.8% and Asia-Pacific at 23.7%, while natural colors led the ingredient segment with 31.6%, reflecting a global preference for clean, natural, and high-quality additive solutions.
Access crucial information at unmatched prices!
Request your sample report today & start making informed decisions powered by Credence Research Inc.!
Download Sample
Market Segmentation Analysis:
By Ingredient Type
Natural colors held the largest share of 31.6% in the clean-labelled food additives market in 2024. Their dominance is driven by growing consumer preference for visually appealing products formulated with plant-based pigments. Natural colors such as carotenoids, anthocyanins, and curcumin are extensively used in beverages, dairy, and bakery applications. Manufacturers continue to develop more stable and heat-resistant natural color formulations to meet stringent clean-label requirements and expand their presence in premium and functional food categories.
- For instance, GNT (EXBERRY®) offers more than 400 plant-based color products which are used by over 2,700 manufacturers in more than 86 countries worldwide.
By Source
Plant-based sources accounted for 58.3% of the clean-labelled food additives market in 2024, making them the leading category due to their sustainability and broad consumer appeal. Ingredients derived from fruits, herbs, and grains support vegan, non-GMO, and allergen-free product development. The rise in awareness about ethical sourcing and eco-friendly production processes further strengthens adoption. Expanding applications in natural flavors, emulsifiers, and texturizers continue to drive the demand for plant-based additives across processed food and beverage industries.
- For instance, Ingredion shows Q-NATURALE® can carry up to 4× the oil load of traditional systems, enabling efficient plant-based emulsions.
By Form
The dry or powder form dominated the market with a 64.7% share in 2024, primarily due to its long shelf life, cost-effectiveness, and transport convenience. Powdered additives ensure better stability and controlled functionality in food processing. Their compatibility with dry mixes, bakery items, and instant beverages enhances their preference among manufacturers. The ability of dry formulations to maintain ingredient integrity during storage and processing supports their continued use in large-scale clean-label food production.
Key Growth Drivers
Rising Consumer Demand for Natural and Transparent Ingredients
Consumers increasingly prefer foods made with recognizable and minimally processed ingredients. This shift toward transparency drives food manufacturers to replace synthetic additives with natural alternatives. Clean-label claims such as “no artificial colors or preservatives” attract health-conscious buyers. Growing awareness of ingredient sourcing and formulation transparency supports steady adoption across packaged and ready-to-eat products. Companies are reformulating products to align with global clean-label certifications and sustainability expectations.
- For instance, Sensient surveyed 1,632 consumers and linked color vibrancy to higher taste expectations, guiding natural color reformulation.
Expansion of Processed and Functional Food Categories
The growing popularity of functional and convenience foods supports higher clean-labelled additive consumption. Manufacturers are integrating natural emulsifiers, texturizers, and sweeteners to maintain taste, texture, and nutrition. Expanding product lines in snacks, dairy, and beverages enhance demand for multifunctional natural ingredients. The trend toward fortified foods with added natural flavors and plant-based extracts is strengthening additive innovation pipelines among global brands.
- For instance, ADM demonstrates applications where ProFam® Pea 580 supports products delivering 7 g protein per 5.3 oz serving.
Supportive Regulatory Frameworks and Product Reformulation Initiatives
Stringent regulations restricting artificial additives are accelerating the adoption of clean-labelled substitutes. Regulatory bodies in the EU and North America are promoting transparency and ingredient disclosure, encouraging food brands to reformulate. The clean-label shift aligns with sustainable sourcing policies and health-driven labeling norms. Governments and certification programs are also supporting the growth of natural ingredients through standardization of clean-label definitions and compliance frameworks.
Key Trends & Opportunities
Rising Demand for Plant-Based and Functional Additives
Plant-based ingredients are gaining traction as food manufacturers respond to vegan and sustainability trends. Natural emulsifiers, starches, and flavors derived from plants are being incorporated into diverse food applications. Consumers are increasingly seeking products that provide health benefits beyond nutrition, such as antioxidants and gut health boosters. This shift is fostering innovation in botanical extracts, fiber-rich texturizers, and natural sweeteners to meet evolving dietary expectations.
- For instance, Cargill states EverSweet® enables up to 100% sugar reduction using Reb M/Reb D produced by fermentation
Technological Advancements in Extraction and Preservation
Innovations in biotechnology, fermentation, and cold-extraction techniques are improving the efficiency and purity of clean-label additives. These technologies enable manufacturers to enhance yield while preserving functional and sensory properties. Improved stability and cost-effectiveness of natural ingredients are expanding their application in beverages, confectionery, and dairy products. Continuous R&D in microencapsulation and enzyme-assisted extraction is opening new opportunities for next-generation natural additives.
- For instance, Kemin reports its buffered vinegar extended carrot hummus shelf life by ≥10 days, supporting label-friendly preservation.
Key Challenges
High Production and Ingredient Sourcing Costs
The production of natural additives often requires complex extraction processes and reliable sourcing of raw materials. Seasonal fluctuations and limited supply of plant-based ingredients increase production costs. Maintaining consistent quality and functionality compared to synthetic alternatives remains difficult. These cost challenges restrict adoption among small and mid-sized manufacturers, especially in price-sensitive markets.
Limited Shelf Life and Product Stability Issues
Natural additives generally offer lower stability under extreme processing and storage conditions. Exposure to heat, light, and oxygen can degrade natural pigments, flavors, and preservatives faster than synthetic counterparts. Achieving desired texture, color retention, and preservation without compromising clean-label integrity is technically challenging. This limitation continues to affect large-scale adoption in high-temperature and long-shelf-life food applications.
Regional Analysis
North America
North America held the largest share of 34.2% in the clean-labelled food additives market in 2024. The region’s dominance is supported by strong demand for natural ingredients and transparent labeling in processed foods. Manufacturers across the United States and Canada are reformulating products with plant-derived colors, sweeteners, and preservatives. Favorable FDA regulations promoting natural ingredient use and high consumer awareness strengthen market adoption. The presence of major food companies focusing on sustainable and allergen-free formulations continues to boost innovation and product launches across retail and foodservice channels.
Europe
Europe accounted for 29.8% of the clean-labelled food additives market in 2024, driven by strict regulations and growing consumer preference for organic and non-GMO products. Countries such as Germany, France, and the United Kingdom are leading in product innovation and reformulation efforts. The European Food Safety Authority’s emphasis on natural and traceable ingredients accelerates adoption. Increasing popularity of vegan and plant-based diets also supports regional growth. Food producers are investing in clean-label colorants and natural emulsifiers to align with sustainability and transparency trends across the European market.
Asia-Pacific
Asia-Pacific captured 23.7% of the clean-labelled food additives market in 2024, reflecting rapid urbanization and rising health awareness among consumers. Expanding middle-class populations in China, India, and Japan are fueling demand for natural ingredients in beverages, snacks, and bakery products. Local manufacturers are focusing on sourcing sustainable raw materials to meet international clean-label standards. The growth of e-commerce and modern retail distribution further enhances market penetration. Increasing investment by global food additive producers in regional processing facilities supports steady expansion in Asia-Pacific.
Latin America
Latin America represented 7.4% of the clean-labelled food additives market in 2024, supported by growing demand for healthier packaged foods. Brazil, Mexico, and Argentina are witnessing a transition toward natural and minimally processed ingredients in snacks and beverages. Rising consumer awareness of food safety and sustainability encourages reformulation with clean-label alternatives. Regional food producers are adopting locally sourced plant-based and fruit-derived additives to reduce dependence on imports. Government initiatives promoting food quality standards and nutritional transparency further contribute to market growth.
Middle East & Africa
The Middle East & Africa region accounted for 4.9% of the clean-labelled food additives market in 2024. Growing urban populations and rising disposable incomes are driving preference for natural, premium, and halal-certified ingredients. Countries such as the United Arab Emirates and South Africa are emerging as key markets for clean-label formulations. Increasing food processing activities and expansion of international retail chains support regional demand. Investments in food innovation centers and ingredient production facilities are improving accessibility to sustainable, clean-labelled additives across the region.
Market Segmentations:
By Ingredient Type
- Natural colors
- Natural flavors
- Natural preservatives
- Natural sweeteners
- Hydrocolloids and texturizers
- Functional native starches
- Natural emulsifiers
- Other
By Source
- Plant-based
- Animal-based
- Microbial/fermentation
- Mineral-based
By Form
By Geography
- North America
- Europe
- Germany
- France
- U.K.
- Italy
- Spain
- Rest of Europe
- Asia Pacific
- China
- Japan
- India
- South Korea
- South-east Asia
- Rest of Asia Pacific
- Latin America
- Brazil
- Argentina
- Rest of Latin America
- Middle East & Africa
- GCC Countries
- South Africa
- Rest of the Middle East and Africa
Competitive Landscape
Major players such as Cargill, BASF SE, Symrise, Kerry Group, ADM, Corbion, Ingredion, DSM, IFF, and Sensient Technologies collectively shape the competitive landscape of the clean-labelled food additives market. The market is characterized by strong research investments, strategic acquisitions, and portfolio diversification aimed at developing natural and sustainable ingredient solutions. Companies are focusing on plant-based colorants, natural emulsifiers, and functional starches to meet rising clean-label demand. Advancements in fermentation, enzymatic processing, and botanical extraction are driving innovation and improving cost efficiency. Global manufacturers are expanding production capacities and strengthening regional supply chains to enhance market reach. Strategic collaborations with food and beverage producers enable faster adaptation to evolving consumer preferences. Additionally, sustainability initiatives and transparency in sourcing practices are becoming critical differentiators, with firms emphasizing traceable and eco-friendly raw material procurement to maintain brand credibility and competitive advantage in this rapidly evolving market.
Shape Your Report to Specific Countries or Regions & Enjoy 30% Off!
Key Player Analysis
- Cargill, Incorporated
- BASF SE
- Symrise
- Kerry Group plc
- ADM (Archer Daniels Midland)
- Corbion
- Ingredion Incorporated
- DSM
- IFF (International F&F Inc.)
- Sensient Technologies
Recent Developments
- In 2025, Cargill announced its intention to “set new standards in nutritional innovation, sustainability, and wellness” driven by consumer demand for healthier, more transparent, and environmentally friendly “clean label” products.
- In 2025, Sensient Technologies Launched Marine Blue Capri, a clean label natural alternative to synthetic FD&C Blue 1 colorant, designed to provide bright, stable blue hues in low pH beverages.
- In 2024, BASF opened a new Catalyst Development and Solids Processing Center aimed at process innovations that support development of clean and natural additives.
Report Coverage
The research report offers an in-depth analysis based on Ingredient Type, Source, Form and Geography. It details leading market players, providing an overview of their business, product offerings, investments, revenue streams, and key applications. Additionally, the report includes insights into the competitive environment, SWOT analysis, current market trends, as well as the primary drivers and constraints. Furthermore, it discusses various factors that have driven market expansion in recent years. The report also explores market dynamics, regulatory scenarios, and technological advancements that are shaping the industry. It assesses the impact of external factors and global economic changes on market growth. Lastly, it provides strategic recommendations for new entrants and established companies to navigate the complexities of the market.
Future Outlook
- Demand for natural, minimally processed food additives will continue to increase worldwide.
- Clean-label reformulations will expand in beverages, snacks, and dairy applications.
- Technological progress in fermentation and extraction will enhance product quality.
- Partnerships between ingredient suppliers and food brands will accelerate clean-label innovation.
- The plant-based and vegan product segment will remain a primary growth area.
- Transparent labeling and traceability standards will drive consumer trust and loyalty.
- Asia-Pacific will emerge as the fastest-growing regional market for clean additives.
- Investment in sustainable sourcing and local ingredient processing will strengthen supply chains.
- Demand for multifunctional additives offering flavor, texture, and preservation benefits will grow.
- Regulatory support for natural and safe ingredients will further promote market expansion.


