| REPORT ATTRIBUTE |
DETAILS |
| Historical Period |
2020-2023 |
| Base Year |
2024 |
| Forecast Period |
2025-2032 |
| Assembly Line Solutions Market Size 2024 |
USD 296,040.58 million |
| Assembly Line Solutions Market, CAGR |
7.23% |
| Assembly Line Solutions Market Size 2032 |
USD 20,141.60 million |
Market Overview
The Global Assembly Line Solutions Market is projected to grow from USD 296,040.58 million in 2024 to an estimated USD 517,465.86 million by 2032, with a compound annual growth rate (CAGR) of 7.23% from 2025 to 2032. Manufacturers worldwide invest heavily in integrated assembly line solutions to boost throughput, enhance product quality, and reduce lifecycle costs.
Manufacturers prioritize flexibility and scalability to adapt to shifting demand patterns and proliferating product variants. Key drivers include the Industry 4.0 revolution, rising adoption of industrial robots, and growth in Internet of Things (IoT) platforms that monitor and optimize production processes in real time. Trends such as collaborative robots (cobots) that work alongside human operators, modular assembly frameworks that enable rapid line reconfiguration, and data-driven preventive maintenance are shaping market dynamics. Artificial intelligence and machine learning in quality inspection and predictive analytics further drive adoption by enabling near-zero defect rates and optimized throughput.
Regionally, North America leads the market, underpinned by mature automotive, aerospace, and electronics manufacturing hubs in the United States and Canada. Asia Pacific is set for the fastest growth, propelled by China’s smart manufacturing initiatives, India’s expanding industrial base, and automation investments across Southeast Asia. Europe holds a significant share due to strong automotive and machinery sectors in Germany and Italy. Emerging markets in Latin America and the Middle East & Africa present additional opportunities as industrialization accelerates and governments support automation initiatives through incentives and policy frameworks. Major players such as ABB, Siemens, FANUC, KUKA, and Rockwell Automation drive the competitive landscape through strategic partnerships and continuous innovation.
Access crucial information at unmatched prices!
Request your sample report today & start making informed decisions powered by Credence Research Inc.!
Download Sample
Market Insights
- The Global Assembly Line Solutions Market stood at USD 296,040.58 million in 2024 and will reach USD 517,465.86 million by 2032 at a CAGR of 7.23%.
- Manufacturers deploy Industry 4.0 strategies that integrate robotics, machine vision, and digital twins to boost throughput.
- Real-time IoT platforms enable predictive maintenance and near-zero defect rates by monitoring key performance metrics.
- High upfront investment and unclear payback periods restrict automation adoption among small and midsize firms.
- Complex integration of legacy equipment and shortages of skilled engineers extend commissioning timelines.
- North America commands the largest share, driven by mature automotive, aerospace, and electronics hubs.
- Asia Pacific will post the fastest growth thanks to smart manufacturing initiatives, cost advantages, and expanding industrial bases in China and India.
Report Scope
This report segments the Global Assembly Line Solutions Market as follows:
Market Drivers
Expanding Adoption of Robotics and Automation Technologies by Manufacturers
Manufacturers deploy robotic arms to boost throughput and ensure consistent product quality. They integrate machine vision systems to inspect parts and detect defects early in the line. The Global Assembly Line Solutions Market responds to this surge by offering tailored automation packages. System integrators collaborate with OEMs to match hardware choices to application requirements. Demand for collaborative robots that share workspace grows due to safety and efficiency benefits. It reduces cycle times and manual labor demands across high-volume assembly processes. Engineers refine cell layouts to support fast changeovers and standardized workflows.
- For instance, over 120,000 industrial robots were installed globally in manufacturing facilities last year, reflecting the increasing adoption of automation technologies.
Advancement of Digital Twin and Simulation Platforms for Process Planning
Companies adopt digital twin tools to model assembly line behavior before equipment installation. They simulate production scenarios and validate takt times under different load conditions. The Global Assembly Line Solutions Market incorporates these platforms to cut testing phase duration. Engineers detect layout clashes and resource bottlenecks before committing floor space. Software vendors enhance analytics modules to forecast performance under varied demand profiles. It ensures integration with real-time control systems and supervisory layers. Technical teams refine virtual models continuously to reflect actual shop floor changes.
- For instance, manufacturers utilizing digital twin technology have reported reductions of over 30% in production downtime, improving efficiency and resource allocation.
Growing Need for Flexible and Scalable Production Architecture
Manufacturers shift toward modular assembly cells to handle diverse product variants. They install quick-change fixtures and standardized conveyors to support rapid line reconfiguration. The Global Assembly Line Solutions Market adapts offerings to suit low to mid volume runs. OEMs deliver plug-and-play modules that link seamlessly over industry-standard networks. It empowers facility managers to adjust capacity during seasonal demand swings. Companies expand footprint by adding compatible modules without major redesign. Engineers plan layouts around universal interfaces to simplify future upgrades.
Emphasis on Predictive Maintenance and Data-Driven Production Optimization
Plant operators collect data from IoT sensors across motors, actuators, and conveyors. They analyze vibration and temperature readings to anticipate component wear. The Global Assembly Line Solutions Market features analytics engines that trigger alerts and work orders. Maintenance teams act on insights to prevent unplanned downtime and maintain output rates. It drives equipment uptime and cuts repair costs over long term. System architects integrate dashboards to visualize key performance indicators in real time. Technical staff review historical metrics to refine maintenance schedules and boost asset life.
Market Trends
Integration of Collaborative Robots and Advanced Human-Machine Interfaces
Manufacturers deploy cobots to work alongside operators and boost productivity. They connect these robots with intuitive HMIs that display tasks step by step. The Global Assembly Line Solutions Market supplies cobot cells with safety features that match shop floor standards. It enables layout changes and tool swaps without rewiring. Engineers tune motion profiles to reduce cycle time and ease operator fatigue. Companies train staff to operate robots via touchscreen panels and simple voice commands. This trend drives faster adoption in small and midsize plants that need scalable automation.
- For instance, the global collaborative robot market saw over 40% of its adoption driven by applications in the automotive sector, highlighting the increasing role of cobots in manufacturing
Adoption of Edge Computing and Real-Time Analytics for Production Efficiency
Plants install edge servers to process sensor data near machines. They run analytics models that detect anomalies and optimize throughput in real time. The Global Assembly Line Solutions Market offers platforms that link PLCs and edge devices under one interface. It provides low-latency control loops and triggers alerts when performance dips. IT teams deploy machine learning models to forecast maintenance needs and prevent breakdowns. Operations managers review dashboards on mobile devices to make quick decisions. This trend expands digital transformation from cloud trials to full shop floor deployment.
- For instance, over 70% of manufacturers have integrated edge computing solutions to enhance real-time analytics and optimize production efficiency
Market Challenges
High Capital Expenditure and Uncertain Return on Investment
The Global Assembly Line Solutions Market faces significant upfront cost barriers that deter small and midsize manufacturers. System builders require major investments in robotics, sensors, and control hardware. It raises budget approval cycles and extends project timelines. Tight capital budgets force decision makers to prioritize core operations over automation. They demand clear payback schedules and financial models that prove value. Providers adapt financing options but struggle to meet diverse client requirements.
- For instance, Tesla’s Gigafactory in Nevada invested over USD 5 billion in advanced assembly line automation, integrating robotic arms, AI-driven quality control, and automated material handling systems to streamline production
Integration Complexity and Workforce Skill Shortages
Companies struggle to integrate heterogeneous equipment into unified control platforms. The Global Assembly Line Solutions Market suffers delays when legacy machines need custom interfaces. It increases commissioning effort and raises error risk. Manufacturers report gaps in staff expertise for PLC programming and robot calibration. Training programs lag behind technology evolution and remain costly. System integrators propose standardized modules but face adoption hurdles. Customers seek turnkey solutions that reduce reliance on specialized engineers.
Market Opportunities
Expansion of Retrofit and Upgrade Services for Legacy Systems
Manufacturers seek retrofit options to modernize existing assembly lines without full replacement. The Global Assembly Line Solutions Market can address this demand with modular upgrade kits that match legacy equipment. It lowers entry barriers and shortens deployment cycles. Service teams deliver plug-and-play modules that link to current PLCs and controls. Clients adopt retrofit packages to boost throughput and improve defect detection. OEMs partner with system integrators to conduct site surveys and complete installations swiftly. This approach drives revenue from hardware sales, software licenses, and ongoing support contracts.
Leveraging Sustainable and Energy-Efficient Automation Solutions
Companies pursue sustainability targets and require energy-efficient assembly platforms. The Global Assembly Line Solutions Market can supply low-power drives and smart energy management modules. It tracks power consumption in real time and initiates load balancing to prevent waste. Plant managers reduce carbon footprint and operating costs by implementing these technologies. Vendors offer certification programs that validate green credentials and support compliance. Clients select certified solutions to meet regulatory mandates and enhance corporate image. Integrators provide performance reports that document efficiency gains and support continuous improvement.
Market Segmentation Analysis
By Type
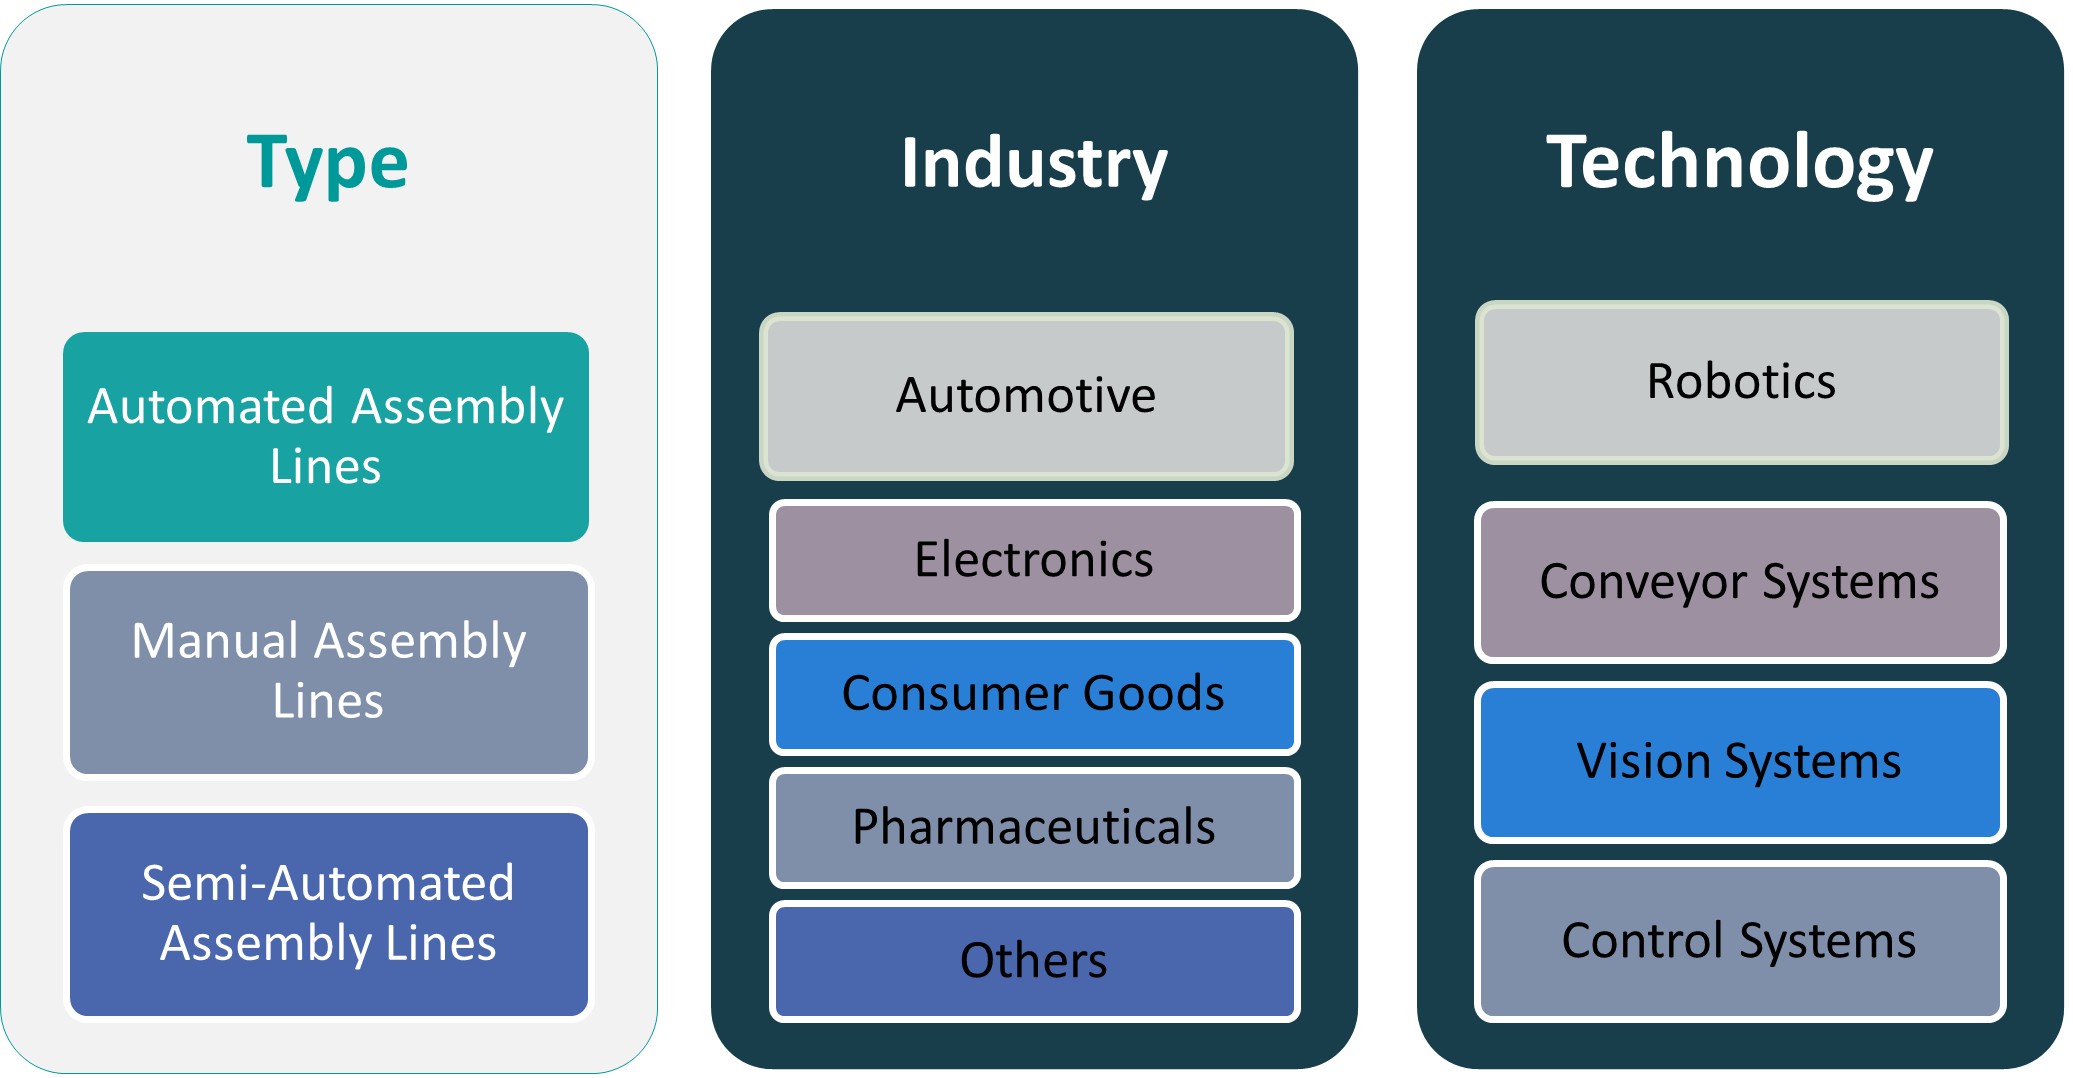
The Global Assembly Line Solutions Market divides by type into automated assembly lines, manual assembly lines, and semi-automated assembly lines. Automated lines feature robotics, conveyors, and programmable logic controllers. Manual lines rely on human labor and simple tools. Semi-automated lines combine manual tasks and mechanized steps. It offers manufacturers options tailored to budget and throughput demands. Operations teams select automation level that matches production volume and product complexity. Suppliers deliver modular packages that simplify future upgrades.
By Industry
The Global Assembly Line Solutions Market segments by industry into automotive, electronics, consumer goods, pharmaceuticals, and others. Automotive firms adopt assembly solutions to meet strict quality standards and high-volume demands. Electronics manufacturers integrate precision conveyors and control systems to handle delicate components. Consumer goods producers favor flexible lines that switch between SKUs. Pharmaceutical producers install vision systems to ensure compliance and traceability. It supports operations teams in diverse manufacturing environments. Suppliers tailor service agreements to each sector’s regulatory and operational requirements.
Segments
Based on Industry
- Automotive
- Electronics
- Consumer Goods
- Pharmaceuticals
- Others
Based on Technology
- Robotics
- Conveyor Systems
- Vision Systems
- Control Systems
Based on Region
- North America
- Europe
- Germany
- France
- U.K.
- Italy
- Spain
- Rest of Europe
- Asia Pacific
- China
- Japan
- India
- South Korea
- South-east Asia
- Rest of Asia Pacific
- Latin America
- Brazil
- Argentina
- Rest of Latin America
- Middle East & Africa
- GCC Countries
- South Africa
- Rest of the Middle East and Africa
Regional Analysis
Dominance of North America Driven by Mature Manufacturing Hubs
North America holds leading position due to mature automotive and electronics hubs. The United States invests heavily in advanced robotics and digital twin technologies. Global Assembly Line Solutions Market benefits from strong R\&D networks and skilled workforce. It supports collaboration between OEMs and system integrators to streamline rollouts. Canada’s growing aerospace and transportation sectors drive demand for flexible solutions. Regulatory frameworks in both countries promote automation adoption and industrial modernization. Regional suppliers offer tailored service agreements that align with local compliance requirements.
Rapid Expansion in Asia Pacific Fueled by Government Incentives and Cost Advantages
Asia Pacific exhibits fastest expansion driven by government incentives and low labor cost. China’s smart factory initiatives and “Made in China 2025” plan fuel automation projects. Global Assembly Line Solutions Market sees strong uptake across electronics and consumer goods plants. Manufacturers in India adopt semi-automated lines to boost competitiveness and manage workforce gaps. Japan focuses on precision robotics to maintain quality in automotive and medical device sectors. Southeast Asian countries invest in assembly solutions to attract foreign direct investment. It ensures rapid capacity scaling to meet regional export demands.
Steady Growth in Europe and Emerging Potential in Latin America, Middle East & Africa
Europe maintains significant share due to robust automotive and machinery industries. Germany’s Industry 4.0 leadership shapes demand for integrated assembly solutions. Italy’s automotive and appliance sectors adopt modular lines for product variety. Global Assembly Line Solutions Market stands out through local partnerships and customization. Latin America presents growth potential in Brazil and Mexico under expanding automotive sectors. Middle East and Africa invest in assembly automation to diversify economies and reduce labor errors. It drives platform localization to meet varied regulatory and cultural needs.
Shape Your Report to Specific Countries or Regions & Enjoy 30% Off!
Key players
- ACRO Automation Systems, Inc.
- Hochrainer GmbH
- JR Automation
- Central Machines, Inc.
- Totally Automated Systems
Competitive Analysis
In the Global Assembly Line Solutions Market, leading firms differentiate on technology, service breadth, and regional reach. ACRO Automation Systems, Inc. focuses on modular robotic cells and turnkey integration that suit high-volume automotive lines. Hochrainer GmbH leverages custom transfer solutions and a strong European network to secure precision manufacturing contracts. JR Automation offers scalable platforms and software-driven controls that attract large electronics clients. Central Machines, Inc. emphasizes precision welding and local support in North America to win industrial machinery business. Totally Automated Systems builds an edge with flexible assembly stations and rapid deployment packages. It invests in R\&D to launch AI-driven inspection and predictive maintenance modules. Providers compete on cost efficiency, training programs, and financing options. They expand into Asia Pacific through joint ventures and localized service centers. Heightened competition fuels continuous innovation and pushes vendors to tailor solutions to evolving customer requirements.
Recent Developments
- In June 2024, Totally Automated Systems relocated its corporate headquarters to a new 100,000 sq ft state-of-the-art facility in Rochester Hills, Michigan, to support expanded automation and Industry 4.0 services.
Market Concentration and Characteristics
[ Global Assembly Line Solutions Market exhibits moderate concentration, with leading automation providers capturing significant share through advanced robotics, digital twins, and integrated control platforms. It benefits from high barriers to entry, including capital intensity and technical complexity. Suppliers differentiate by depth of service offerings, regional support networks, and financing flexibility. Smaller niche firms carve out positions by targeting refurbishment and retrofit projects. It emphasizes strategic partnerships and M&A to expand footprints. End users demand certified quality assurance and turnkey deliveries, encouraging vendors to standardize modules while customizing interfaces.
Report Coverage
The research report offers an in-depth analysis based on Industry, Technology and Region. It details leading market players, providing an overview of their business, product offerings, investments, revenue streams, and key applications. Additionally, the report includes insights into the competitive environment, SWOT analysis, current market trends, as well as the primary drivers and constraints. Furthermore, it discusses various factors that have driven market expansion in recent years. The report also explores market dynamics, regulatory scenarios, and technological advancements that are shaping the industry. It assesses the impact of external factors and global economic changes on market growth. Lastly, it provides strategic recommendations for new entrants and established companies to navigate the complexities of the market.
Future Outlook
- The Global Assembly Line Solutions Market will integrate AI-driven optimization modules and predictive analytics into assembly controls to adjust production parameters in real time. These capabilities eliminate defects and improve throughput with minimal human supervision across high-speed production environments and reduce lifecycle costs significantly.
- Manufacturers will leverage digital twin platforms to simulate complete assembly workflows and validate configurations before deployment. This approach accelerates commissioning schedules, uncovers bottlenecks early, and ensures consistent performance under varied production scenarios across multiple product lines.
- Facilities will expand use of collaborative robots that share workspaces with operators and handle repetitive tasks safely. It boosts labor productivity, reduces ergonomic risks, and adapts quickly to new product variants without major programming effort or extensive safety fencing.
- Engineers will deploy edge computing frameworks to process sensor data locally and trigger real-time control adjustments. It cuts network latency, enables closed-loop feedback on conveyor speeds and torque settings, and maintains optimal throughput even during intermittent connectivity with cloud servers.
- Companies will adopt 5G-enabled connectivity to link mobile modules, autonomous guided vehicles, and remote diagnostics tools. It delivers low-latency communications, supports high-density sensor networks, and empowers remote experts to monitor line health and guide maintenance crews instantly.
- OEMs will focus on sustainable automation platforms that feature energy-efficient drives, regenerative braking, and smart power management. These solutions track consumption metrics continuously, initiate dynamic load balancing, and help plants meet corporate emissions targets while lowering utility expenses.
- Retrofit services will grow for aging assembly lines, offering modular upgrade kits that integrate with legacy PLCs and control panels. It extends asset life, accelerates ROI, and allows small and midsize manufacturers to access advanced inspection and automation functions without full line replacement.
- Integrators will introduce augmented reality interfaces that overlay work instructions and diagnostic overlays onto operator headsets. It speeds training for new hires, guides technicians through maintenance tasks, and minimizes error rates by providing contextual support at the point of need.
- Providers will design modular plug-and-play stations with standardized mechanical and electrical interfaces for rapid deployment. They allow facility managers to reconfigure line segments swiftly for seasonal products and scale capacity incrementally without extensive engineering changes.
- Vendors will form strategic partnerships with software firms and systems integrators to bundle turnkey automation solutions. They combine deep expertise in robotics, vision systems, and control software to deliver fully managed programs and support long-term service agreements.


