
Brachytherapy Devices Market Overview
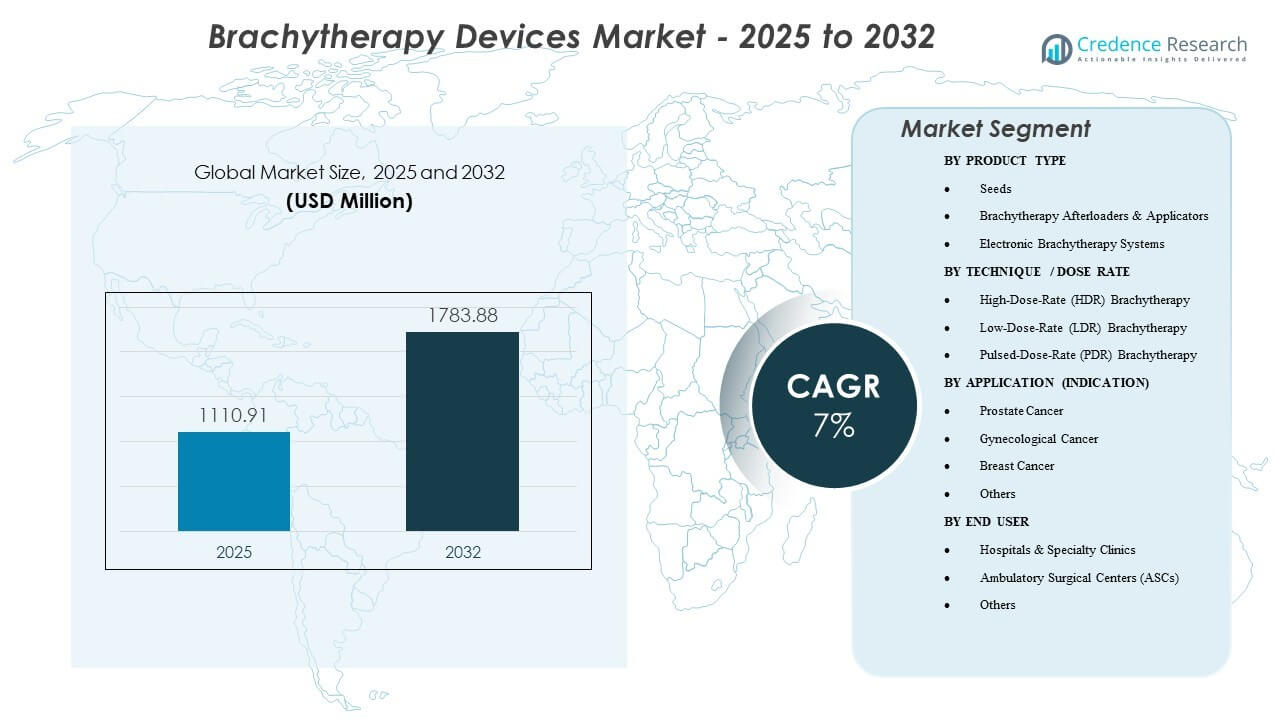
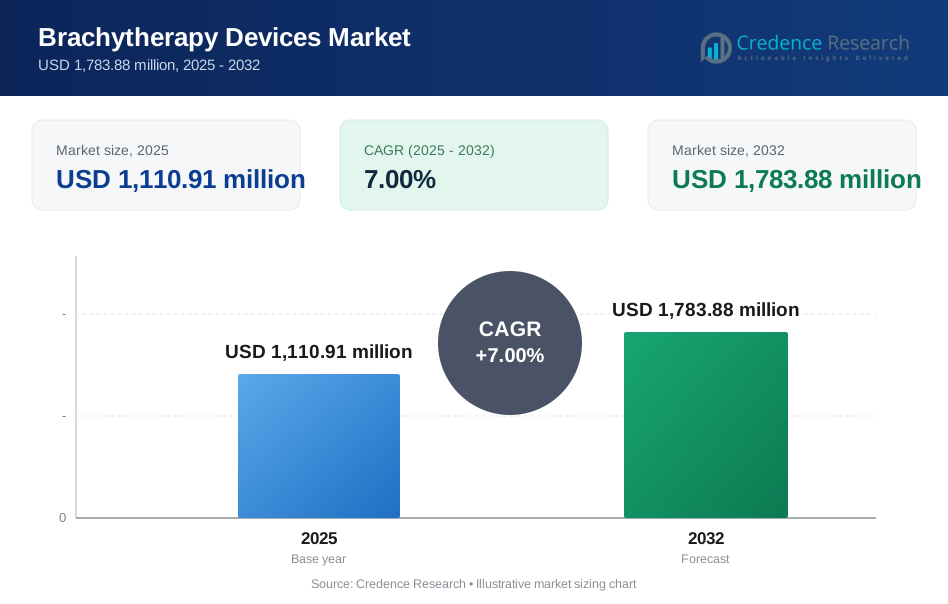
The global brachytherapy devices market size was valued at USD 1,110.91 million in 2025 and is expected to reach USD 1,783.88 million by 2032, growing at a CAGR of 7% from 2025 to 2032. Demand is supported by the shift toward localized, organ-sparing radiation treatments and rising cancer case volumes, along with wider adoption of image-guided planning that improves placement accuracy and dose conformity. In addition, high-throughput clinical workflows are reinforcing the use of HDR platforms and related consumables, as providers prioritize treatment time and scheduling efficiency. North America accounted for 45% of revenue in 2025, supported by a strong installed base, higher procedure volumes, and favorable reimbursement.
| REPORT ATTRIBUTE | DETAILS |
|---|---|
| Historical Period | 2020-2023 |
| Base Year | 2024 |
| Forecast Period | 2025-2032 |
| Brachytherapy Devices Market Size 2025 | USD 1,110.91 million |
| Brachytherapy Devices Market, CAGR | 7% |
| Brachytherapy Devices Market Size 2032 | USD 1,783.88 million |
Key Market Trends & Insights
- North America held 45% of global revenue in 2025, supported by higher procedure penetration and a large installed base of radiation oncology systems.
- HDR brachytherapy accounted for 72% share in 2025, reflecting preference for shorter, fractionated workflows and better scheduling efficiency.
- The market is forecast to grow at a 7% CAGR during 2025–2032, driven by modernization of oncology infrastructure and protocol-based adoption.
- Brachytherapy afterloaders & applicators captured 43% share in 2025, supported by mandatory platform use in HDR/PDR delivery and recurring applicator demand.
- Ambulatory Surgical Centers (ASCs) are expected to see steady growth f as outpatient pathways expand for eligible procedures.
Segment Analysis
Market demand is shaped by a balance between capital equipment (afterloaders, planning integration) and recurring procedure-linked components (applicators, accessories, and, in selected indications, seeds). Centers prioritize systems that improve throughput, standardize dose delivery, and reduce variability across operators, which supports consistent replacement cycles and service contract attachment. Workflow fit and clinical team capacity play a major role in purchase decisions, because brachytherapy requires coordinated scheduling across physicians, physicists, and imaging resources.
Indication mix remains a key determinant of device utilization patterns. Prostate and gynecological care continue to anchor a large share of clinical use due to established protocols, while breast applications benefit from localized approaches in selected patient groups. Adoption is also influenced by the availability of trained teams and the ability to integrate applicators with imaging and treatment planning to improve confidence in placement and dose coverage.
Site-of-care dynamics increasingly matter as providers seek efficient outpatient delivery where clinically appropriate. Hospitals remain the main installation environment due to infrastructure, staffing, and multi-disciplinary oncology pathways, while ASC growth is supported when streamlined HDR workflows and scheduling efficiency improve feasibility.
By Product Type Insights
Brachytherapy Afterloaders & Applicators accounted for the largest share of 43% in 2025. This leadership reflects the central role of afterloaders in HDR/PDR treatment delivery, making them a core capital requirement for brachytherapy-capable centers. Applicators also contribute to repeat demand through procedure-specific designs and replacement cycles driven by utilization intensity and clinical standardization. Procurement often favors vendors offering integrated planning compatibility, service coverage, and a broad applicator portfolio that supports multiple indications.
By Technique / Dose Rate Insights
High-Dose-Rate (HDR) Brachytherapy accounted for the largest share of 72% in 2025. HDR dominance is reinforced by shorter treatment times, outpatient-friendly scheduling, and operational efficiency for high-volume oncology departments. Clinical adoption also benefits from established protocols and strong alignment with image-guided planning that supports consistent placement and dose delivery. Centers tend to prioritize platforms that support predictable fractionation workflows and reduce variability across procedures.
By Application (Indication) Insights
Prostate Cancer accounted for the largest share of 32% in 2025. The segment is supported by established clinical pathways and sustained procedure volumes in centers equipped for seed-based implants and HDR approaches in selected cases. Providers value predictable workflow integration with imaging and planning tools, which strengthens demand for compatible applicators and delivery systems. Replacement and upgrade decisions are often driven by throughput needs and the desire to improve placement accuracy and dose conformity.
By End User Insights
Hospitals & Specialty Clinics accounted for the largest share of 60% in 2025. This leadership reflects concentration of radiation oncology infrastructure, physicist coverage, and multi-disciplinary care teams required for planning and delivery. Hospitals also dominate capital procurement due to budget structures that support afterloader installations, service contracts, and standardized accessory portfolios. Specialty clinics reinforce demand where high procedure volumes justify dedicated brachytherapy workflows and frequent equipment utilization.
Market Drivers
Expanding Demand For Localized, Organ-Sparing Radiation
Brachytherapy supports high-dose delivery to a defined target while limiting exposure to surrounding tissue, which aligns with clinical goals for localized disease management. Demand grows when providers seek approaches that can fit into shorter treatment pathways for eligible patients. Increasing use of image-guided workflows improves confidence in placement and dose conformity, supporting broader adoption. These factors reinforce purchasing of systems and accessory portfolios that enable standardized delivery across teams.
- For instance, an MRI‑guided HDR prostate brachytherapy trial at a U.S. academic center achieved a median prostate V100 of 94% while keeping rectal V75 below 3.1%, demonstrating high target coverage with limited organ-at-risk dose.
Installed-Base Modernization And Workflow Standardization
Replacement cycles and upgrades contribute materially to market momentum as centers modernize planning, delivery, and safety features. Hospitals and high-throughput clinics increasingly emphasize consistent protocols, predictable scheduling, and improved utilization efficiency. This environment supports demand for afterloader platforms with integrated planning compatibility and robust service coverage. Standardization also increases accessory utilization, including procedure-specific applicators and related consumables.
Cancer Care Capacity Expansion In Emerging Systems
Expansion of oncology capacity in developing care systems supports new installations, especially where radiotherapy infrastructure is being strengthened across tertiary and regional centers. New site development increases demand for capital equipment, commissioning support, and training, which can accelerate installed base growth. Procurement decisions often favor vendors that offer end-to-end implementation, maintenance support, and staff training pathways. Over time, these installations create recurring demand via service and accessory replacement.
- For instance, Japan reports 129 Ir‑192 remote afterloaders installed nationwide for brachytherapy, indicating significant penetration of modern HDR capacity in a single Asia‑Pacific market.
Shift Toward Outpatient-Feasible Care Where Appropriate
When clinical protocols and operational capability allow, providers increasingly adopt outpatient-friendly brachytherapy delivery models. HDR’s scheduling advantages support this shift and can improve throughput for facilities managing high patient volumes. ASC growth is enabled where staffing and safety requirements are addressed and where workflow efficiency supports economic feasibility. This trend reinforces demand for platforms that reduce operational friction while maintaining delivery accuracy.
Market Challenges
Brachytherapy adoption remains sensitive to staffing availability and training depth because delivery requires coordinated teams and specialized planning workflows. Facilities without consistent physicist coverage and procedural expertise may limit utilization even after installing capital equipment. Operational constraints such as scheduling, imaging access, and procedure room availability can also reduce throughput, which affects ROI decisions and slows expansion.
- For instance, AAPM practice guidelines specify that an authorized medical physicist and an authorized user must be on site for treatment initiation and immediately available throughout delivery, meaning that any gap in this staffing model can force postponement or cancellation of scheduled HDR cases, reducing realized utilization relative to installed capacity.
Procurement complexity and lifecycle costs create additional friction for new installations. Capital budgets, service contracts, regulatory compliance, and commissioning requirements can lengthen purchasing cycles, especially in cost-sensitive markets. Standardization across applicator portfolios and compatibility with existing planning workflows also influences vendor selection, which can delay decision-making and reduce switching rates.
Market Trends and Opportunities
Electronic brachytherapy systems represent a key opportunity where providers seek simplified logistics and flexible deployment pathways in suitable use cases. Growth is supported by interest in solutions that reduce operational barriers and fit outpatient delivery models, particularly when implementation and workflow integration are streamlined. Vendors that package hardware, training, and service into scalable deployment models are better positioned to convert new sites.
- For instance, the Elekta Xoft Axxent electronic brachytherapy system delivers 50 kV low‑energy X‑rays from a mobile, shielded unit that can operate in standard procedure rooms without a dedicated bunker, and dosimetric comparisons in cervical cancer planning have shown a roughly 45% reduction in Point B dose to pelvic organs at risk versus traditional 192Ir or 60Co HDR sources (111 cGy vs about 210 cGy and 203 cGy, respectively) while maintaining target coverage.
Demand is also rising for applicator ecosystems optimized for image guidance and reproducible placement. Product differentiation increasingly depends on workflow fit, compatibility with planning systems, and accessory breadth across indications. Opportunities expand when vendors support clinical standardization with procedure kits, planning support tools, and service coverage that reduces downtime and improves utilization.
Regional Insights
North America
North America led the market with a 45% revenue share in 2025, supported by higher procedure penetration, established reimbursement pathways, and a large installed base across hospitals and specialty oncology networks. Demand remains strong for HDR workflows and broad applicator portfolios used across multiple indications. Replacement cycles and workflow modernization continue to support system upgrades and service contract growth.
Europe
Europe accounted for 25% of global revenue in 2025, supported by structured oncology care pathways and continued investment in radiotherapy infrastructure. Adoption is influenced by national procurement models, training availability, and standardization of brachytherapy protocols across major centers. Demand typically emphasizes compatibility, service reliability, and procedure standardization.
Asia Pacific
Asia Pacific captured 23% share in 2025 and is supported by expanding oncology capacity, increasing access to radiotherapy services, and growing installation activity across larger hospital systems. Market growth is reinforced by investments in modern planning and delivery workflows, along with rising adoption of standardized protocols in major urban centers. Implementation support and training remain key to sustained utilization expansion.
Latin America
Latin America represented 4% of global revenue in 2025. Growth is shaped by selective expansion of oncology capacity, procurement constraints, and uneven access to specialized staffing. Demand strengthens where hospitals pursue modernization and where vendor support improves commissioning and service continuity.
Middle East & Africa
Middle East & Africa accounted for 3.5% share in 2025. Adoption trends track investments in tertiary care infrastructure and radiotherapy modernization programs, with utilization depending on workforce depth and equipment availability. Demand is stronger in countries expanding national cancer care capacity and building specialist centers.
Competitive Landscape
Competition centers on afterloader platform performance, applicator ecosystem breadth, treatment planning compatibility, and service reliability. Vendors differentiate through workflow integration, uptime support, training capability, and the ability to support multiple indications with standardized accessory portfolios. Commercial strategy increasingly emphasizes installed-base retention via service contracts, upgrades, and procedure-linked accessory pull-through.
Varian Medical Systems (Siemens Healthineers) competes through integrated oncology workflows that connect planning, delivery, and service support, which can improve standardization and operational efficiency for high-volume centers. Its approach typically emphasizes clinical workflow alignment, broad system integration, and lifecycle support that reduces downtime and improves utilization across the installed base.
The industry research and growth report includes detailed analyses of the competitive landscape of the market and information about key companies, including:
- Varian Medical Systems (Siemens Healthineers)
- Elekta AB
- Eckert & Ziegler BEBIG
- Best Medical International (TeamBest)
- Theragenics Corporation
- IsoAid, LLC
- GT Medical Technologies
- iCAD, Inc. (XOFT)
- CIVCO Medical Solutions
- C4 Imaging LLC
- Merit Medical Systems
- Boston Scientific Corporation
Qualitative and quantitative analysis of companies has been conducted to help clients understand the wider business environment as well as the strengths and weaknesses of key industry players. Data is qualitatively analyzed to categorize companies as pure play, category-focused, industry-focused, and diversified; it is quantitatively analyzed to categorize companies as dominant, leading, strong, tentative, and weak.
Recent Developments
- In January 2026, GT Medical Technologies reported that the first patients had been enrolled and treated with its GammaTile brachytherapy therapy in the BRIDGES randomized trial for newly diagnosed glioblastoma, marking the clinical start of a study designed to test whether immediate, surgically targeted GammaTile radiation at the time of tumor resection can improve survival compared with the standard delayed‑radiation approach.
- In June 2025, Elekta announced the acquisition of assets from its Croatian distributor to establish direct operations in Zagreb. This move followed a significant 2024 order from the Croatian Ministry of Health for 12 linear accelerators and four brachytherapy systems to address national equipment shortages.
- In March 2025, BEBIG Medical’s SagiNova® HDR Afterloader became operational at Father Muller Medical College Hospital in Mangalore, India. This launch was part of a major healthcare wing inauguration, supporting the company's expansion in the Indian high-growth oncology market.
Report Scope
| Report Attribute | Details |
| Market size value in 2025 | USD 1110.91 million |
| Revenue forecast in 2032 | USD 1783.88 million |
| Growth rate (CAGR) | 7% (2025–2032) |
| Base year | 2025 |
| Forecast period | 2026–2032 |
| Quantitative units | USD million |
| Segments covered | By Product Type; By Technique / Dose Rate; By Application (Indication); By End User; By Region |
| Regional scope | North America, Europe, Asia Pacific, Latin America, Middle East & Africa |
| Key companies profiled | Varian Medical Systems (Siemens Healthineers), Elekta AB, Eckert & Ziegler BEBIG, Best Medical International (TeamBest), Theragenics Corporation, IsoAid, LLC, GT Medical Technologies, iCAD, Inc. (XOFT), CIVCO Medical Solutions, C4 Imaging LLC, Merit Medical Systems, and Boston Scientific Corporation. |
Segmentation
BY PRODUCT TYPE
- Seeds
- Brachytherapy Afterloaders & Applicators
- Electronic Brachytherapy Systems
BY TECHNIQUE / DOSE RATE
- High-Dose-Rate (HDR) Brachytherapy
- Low-Dose-Rate (LDR) Brachytherapy
- Pulsed-Dose-Rate (PDR) Brachytherapy
BY APPLICATION (INDICATION)
- Prostate Cancer
- Gynecological Cancer
- Breast Cancer
- Others
BY END USER
- Hospitals & Specialty Clinics
- Ambulatory Surgical Centers (ASCs)
- Others
BY REGION
- North America
- Europe
- Asia-Pacific
- South America
- Middle East and Africa
Request a Free Sample
Fill in your details and we'll send you a free sample report.
- Sample data tables & charts
- Research methodology
Need a Custom Version of This Report?
Tailor the scope, geography, or segments to your exact requirements.
- Custom geography or segment scope
- Direct access to our analyst team
Frequently Asked Questions
What is the market size of the Brachytherapy Devices Market and its forecast?
What is the CAGR of the Brachytherapy Devices Market?
Which segment holds the largest share in the market?
What factors are driving market growth?
Who are the leading companies in the market?
Which region leads the Brachytherapy Devices Market?
Table of Content
Chapter 1. Report Introduction
- 1.1 Report Description & Purpose
- 1.1.1 Report Title & Market Definition
- 1.1.2 Unique Selling Propositions (USP) & Key Differentiators
- 1.1.3 Value Proposition for Stakeholders
- 1.2 Research Objectives
- 1.2.1 Market Sizing Objectives (Volume & Revenue)
- 1.2.2 Segmentation Objectives
- 1.2.3 Competitive Intelligence Objectives
- 1.2.4 Forecast & Scenario Objectives
- 1.3 Report Scope
- 1.3.1 Brachytherapy Devices Scope – Types & Subtypes Covered
- 1.3.2 Geographic Scope – Regions & Countries Covered
- 1.3.3 Historical Period, Base Year & Forecast Period (2025; forecast to 2032)
- 1.3.4 Inclusions & Exclusions
- 1.4 HS Code & Classification Framework
- 1.5 Currency, Units & Pricing Basis
- 1.6 Target Stakeholders
- 1.7 Limitations & Assumptions
Chapter 2. Executive Summary
- 2.1 Global Brachytherapy Devices Market Snapshot
- 2.1.1 Market Size – Historical (2025) & Forecast (2025-2032) (2025: USD 1,110.91 million → 2032: USD 1,783.88 million)
- 2.1.2 Volume & Revenue – Global Totals
- 2.1.3 Key Market Highlights – Top Five Facts
- 2.2 Brachytherapy Devices Market Segmentation Snapshot
- 2.2.1 Market Split by Region – 2025 vs. 2032
- 2.3 Competitive Snapshot
- 2.3.1 Top 10 Players by Revenue Share – 2025
- 2.3.2 Top 10 Players by Volume Share – 2025
- 2.3.3 Recent Strategic Developments (18-Month Summary)
- 2.4 Key Investment Highlights & Strategic Conclusions
Chapter 3. Brachytherapy Devices Market Dynamics & Industry Analysis
- 3.1 Market Overview & Context
- 3.1.1 Brachytherapy Devices Market Position in the Broader Automotive Value Chain
- 3.1.2 OEM vs. Replacement Market Dynamics
- 3.1.3 Market Maturity & Development Stage by Region
- 3.2 Brachytherapy Devices Market Drivers
- 3.3 Brachytherapy Devices Market Restraints & Challenges
- 3.4 Brachytherapy Devices Market Opportunities
- 3.5 Porter's Five Forces Analysis
- 3.5.1 Threat of New Entrants
- 3.5.2 Bargaining Power of Suppliers
- 3.5.3 Bargaining Power of Buyers
- 3.5.4 Threat of Substitutes
- 3.5.5 Competitive Rivalry – Intensity Assessment
- 3.6 Brachytherapy Devices Value Chain Analysis
- 3.6.1 Upstream – Raw Material/Input Suppliers
- 3.6.1.1 Raw Material/Input 1
- 3.6.1.2 Raw Material/Input 2
- 3.6.1.3 Raw Material/Input 3
- 3.6.2 Midstream – Production/Manufacturing/Service Delivery
- 3.6.2.1 Production/Process Overview
- 3.6.2.2 Key Facility Locations & Capacity by Manufacturer
- 3.6.3 Downstream – Distribution & End Consumer
- 3.6.3.1 Primary Channel – B2B/OEM
- 3.6.3.2 Secondary Channels – Dealer, Retail, Online, Direct
- 3.6.4 Value Chain Profitability Analysis
- 3.6.1 Upstream – Raw Material/Input Suppliers
- 3.7 PESTEL Analysis
- 3.7.1 Political Factors
- 3.7.2 Economic Factors
- 3.7.3 Social Factors
- 3.7.4 Technological Factors
- 3.7.5 Environmental Factors
- 3.7.6 Legal Factors
- 3.8 Brachytherapy Devices Supply Chain Analysis
- 3.8.1 Raw Material/Input Supply Risk Assessment
- 3.8.2 Manufacturing Concentration Risk (Geographic Exposure)
- 3.8.3 Trade Disruption Impact Analysis
- 3.9 Regulatory & Policy Landscape
Note: The regulatory and policy landscape section covers regulations based on their applicability to the market, Brachytherapy Devices category, geography, and scope of the study. Only regulatory frameworks with a material impact on operations, compliance, trade, sustainability, or market access are analyzed in detail.
Chapter 4. Key Investment Pockets & Opportunity Analysis
- 4.1 Brachytherapy Devices Market Attractiveness Analysis
- 4.1.1 By Region – Investment Attractiveness Matrix (Volume × CAGR)
- 4.2 Absolute Revenue Growth Opportunity
- 4.2.1 By Region – Absolute USD Growth Through 2032
- 4.3 Incremental Volume Opportunity
- 4.3.1 By Region – Incremental Volume Through 2032
- 4.3.2 Segment – Incremental Volume
- 4.4 Emerging Submarket Opportunity Deep Dive (Subject to Applicability)
- 4.5 Emerging Market Opportunity Scorecards
- 4.5.1 United States
- 4.5.2 Europe
- 4.5.3 Asia
- 4.5.4 Middle East & Africa
Note: Emerging Market Opportunity Scorecards will be included based on relevance and strategic importance. Regions listed are indicative and may vary depending on data availability and market dynamics.
Chapter 5. Brachytherapy Devices Import-Export Analysis & Trade Flows
- 5.1 Global Trade Overview
- 5.1.1 Global Export Value by Country (2025)
- 5.1.2 Global Export Volume by Country (2025)
- 5.1.3 Global Import Value by Country (2025)
- 5.1.4 Global Import Volume by Country (2025)
- 5.1.5 Net Trade Balance by Country (2025)
- 5.2 Export Analysis – Segment
- 5.2.1 Type 1 (HS Code)
- 5.2.2 Type 2 (HS Code)
- 5.2.3 Type 3 (HS Code)
- 5.2.4 Type 4 (HS Code)
- 5.2.5 Type 5 (HS Code)
- 5.3 Import Analysis – Segment
- 5.3.1 Type 1 (HS Code)
- 5.3.2 Type 2 (HS Code)
- 5.3.3 Type 3 (HS Code)
- 5.3.4 Type 4 (HS Code)
- 5.3.5 Type 5 (HS Code)
- 5.4 Average Unit Trade Prices
- 5.4.1 Average Export Price – Segment & Country
- 5.4.2 Average Import Price – Segment & Source Country
- 5.4.3 Price Trends (2025)
- 5.5 Key Trade Route Analysis
- 5.5.1 Trade Route 1
- 5.5.2 Trade Route 2
- 5.5.3 Trade Route 3
- 5.5.4 Trade Route 4
- 5.5.5 Trade Route 5
- 5.6 Trade Policy Impact Assessment
- 5.6.1 US Anti-Dumping & Section 301 Tariffs
- 5.6.2 EU Customs Union Impact
- 5.6.3 Major Free Trade Agreements
- 5.6.4 USMCA Rules of Origin
Note: Trade policy analysis will be included only where relevant to the Brachytherapy Devices market.
Chapter 6. Competitive Landscape & Company Benchmarking
- 6.1 Brachytherapy Devices Market Concentration & Structure
- 6.1.1 Herfindahl-Hirschman Index (HHI) – vs. 2025
- 6.1.2 Tier 1, Tier 2 & Tier 3 Market Structure
- 6.1.3 Global, Regional & Local Player Dynamics
- 6.2 Brachytherapy Devices Market Share Analysis – 2025
- 6.2.1 Global Revenue Share by Company
- 6.2.2 Global Volume Share by Company
- 6.2.3 Regional Revenue Share
- 6.2.4 Market Share Evolution ( vs. 2025)
- 6.2.5 OEM Segment Share by Company
- 6.2.6 Replacement Segment Share by Company
- 6.3 Production/Delivery Capacity & Facility Analysis
- 6.3.1 Global Installed Capacity
- 6.3.2 Capacity Utilization Rates
- 6.3.3 Production/Output Volume
- 6.3.4 Facility Locations & Capacity Map
- 6.3.5 Planned Capacity Additions
- 6.4 Brachytherapy Devices Competitive Benchmarking Matrix
- 6.4.1 Revenue, Volume, CAGR & Profitability Comparison
- 6.4.2 Channel Revenue Mix
- 6.4.3 Geographic Revenue Exposure
- 6.4.4 R&D Intensity
- 6.4.5 Sustainability Maturity
- 6.5 Strategic Developments in Brachytherapy Devices (Last 24 Months)
- 6.5.1 Mergers, Acquisitions & Divestments
- 6.5.2 New Brachytherapy Devices Launches
- 6.5.3 Facility Expansions
- 6.5.4 Strategic Alliances, Joint Ventures & Partnerships
- 6.5.5 Distribution Expansion & Market Entry
- 6.5.6 Sustainability & ESG Initiatives
- 6.6 Competitive Strategy Mapping
- 6.6.1 Leader, Challenger, Follower & Niche Classification
- 6.6.2 Pricing Strategy Comparison
- 6.6.3 Channel Strategy Matrix
Note: Strategic developments are included based on their materiality and the availability of reliable information.
Chapter 7. Global Brachytherapy Devices Market – By Distribution Channel
- 7.1 Segment Overview
- 7.1.1 Volume & Revenue Split by Channel (2025 & 2032)
- 7.1.2 Channel Mix Evolution (2025-2032)
Chapter 8. Regional Market Analysis – Global Overview
- 8.1 Global Regional Overview
- 8.1.1 Regional Volume Share
- 8.1.2 Regional Revenue Share
- 8.1.3 Regional Volume by Region
- 8.1.4 Regional Revenue by Region
- 8.1.5 Regional Forecast Through 2032
- 8.2 Cross-Regional Segment Analysis
- 8.2.1 By Distribution Channel
- 8.2.2 By Brand/Price Tier
Chapter 9. North America Brachytherapy Devices Market
- 9.1 United States
- 9.2 Canada
- 9.3 Mexico
Chapter 10. Europe Brachytherapy Devices Market
- 10.1 Germany
- 10.2 France
- 10.3 Italy
- 10.4 United Kingdom
- 10.5 Spain
- 10.6 Poland
- 10.7 Russia
- 10.8 Netherlands
- 10.9 Belgium
- 10.10 Sweden
- 10.11 Denmark
- 10.12 Norway
- 10.13 Rest of Europe
Chapter 11. Asia Pacific Brachytherapy Devices Market
- 11.1 China
- 11.2 India
- 11.3 Japan
- 11.4 South Korea
- 11.5 Thailand
- 11.6 Indonesia
- 11.7 Vietnam
- 11.8 Malaysia
- 11.9 Australia
- 11.10 Rest of Asia Pacific
Chapter 12. Latin America Brachytherapy Devices Market
- 12.1 Brazil
- 12.2 Argentina
- 12.3 Colombia
- 12.4 Chile
- 12.5 Rest of Latin America
Chapter 13. Middle East Brachytherapy Devices Market
- 13.1 Saudi Arabia
- 13.2 United Arab Emirates
- 13.3 Turkey
- 13.4 Israel
- 13.5 Iran
- 13.6 Rest of the Middle East
Chapter 14. Africa Brachytherapy Devices Market
- 14.1 South Africa
- 14.2 Egypt
- 14.3 Nigeria
- 14.4 Morocco
- 14.5 Rest of Africa
Chapter 15. Brachytherapy Devices Company Profiles
- 15.1 [Company 01]
- 15.1.1 Company Overview
- 15.1.2 Key Management Personnel
- 15.1.3 Products & Services Portfolio
- 15.1.4 Financial Performance
- 15.1.5 Key Market Focus & Geographic Presence
- 15.1.6 Recent Developments & Strategic Initiatives
Note: The company profile list is preliminary and may change based on research findings, market developments, data availability, and client requirements.
Chapter 16. Appendices
- Appendix A – List of Abbreviations & Acronyms
- Appendix B – Industry Classification Code Reference – Full Series
- Appendix C – Production & Capacity Data Tables
- Appendix D – End-Use & Demand Base Tables
- Appendix E – Consumption & Replacement Rate Assumptions
- Appendix F – ASP Reference Tables
- Appendix G – Manufacturing & Facility Database
- Appendix H – Import-Export Data Tables
- Appendix I – Regulatory Summary Tables
- Appendix J – Primary Research Participant List (Anonymized)
- Appendix K – Primary Research Questionnaire Framework
- Appendix L – Data Sources & Bibliography
- Appendix M – Market Size Divergence & Source Comparison
Chapter 17. Research Methodology
- 17.1 Research Framework & Philosophy
- 17.2 Secondary Research – Sources, Hierarchy & Data Extraction
- 17.3 Data Modeling – Bottom-Up & Top-Down Market Sizing
- 17.4 Primary Research – Stakeholder Framework, LOI & Sample Sizes
- 17.5 Forecast Methodology – Regression, Scenario & Sensitivity Analysis
- 17.6 Quality Control – Four-Layer Validation Framework
- 17.7 Limitations & Standard Assumptions
- 17.8 Disclaimer
