
Glucose Monitoring Devices Market Overview:
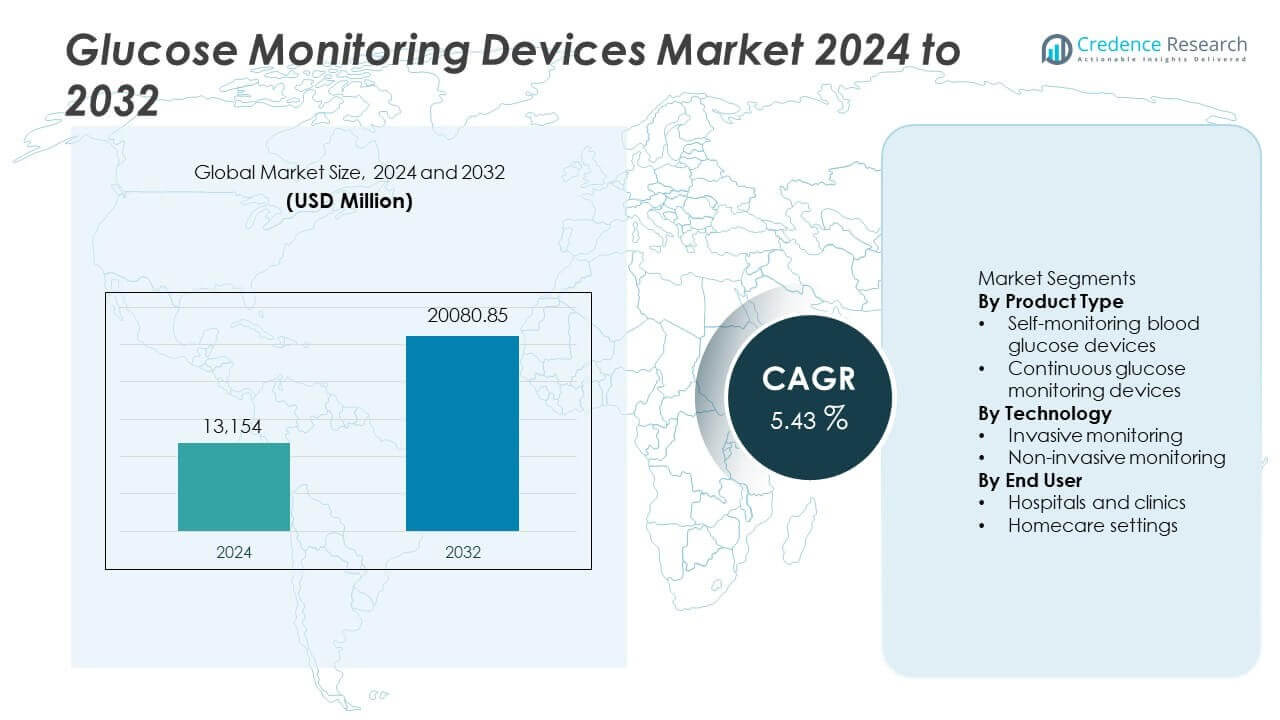
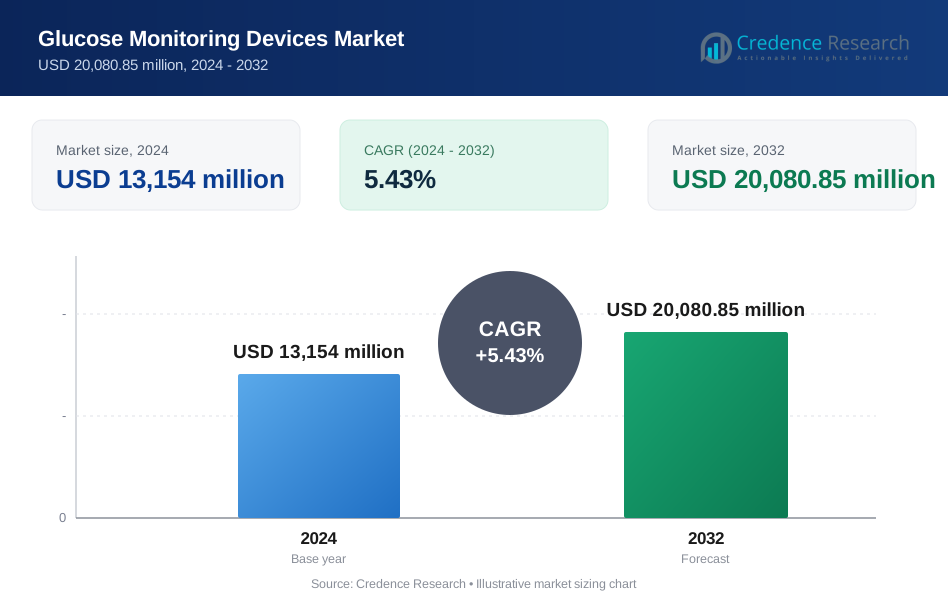
The glucose monitoring devices market was valued at USD 13,154 million in 2024. The market is projected to reach USD 20,080.85 million by 2032. Growth is expected at a CAGR of 5.43% during the forecast period.
| REPORT ATTRIBUTE | DETAILS |
|---|---|
| Historical Period | 2020-2023 |
| Base Year | 2024 |
| Forecast Period | 2025-2032 |
| Glucose Monitoring Devices Market Size 2024 | USD 13,154 million |
| Glucose Monitoring Devices Market, CAGR | 5.43% |
| Glucose Monitoring Devices Market Size 2032 | USD 20,080.85 million |
Glucose Monitoring Devices Market Insights
- Rising diabetes prevalence, aging populations, and emphasis on regular self-monitoring fuel glucose monitoring devices market growth worldwide.
- Self-monitoring blood glucose devices lead with a 58% segment share, supported by affordability, ease of use, and wide availability.
- Competition centers on accuracy, sensor longevity, mobile connectivity, and reimbursement access, while cost pressures restrain premium adoption.
- North America leads with a 37% regional share, followed by Europe at 29% and Asia Pacific at 24%, reflecting healthcare access, guideline-driven testing, and growing homecare monitoring.
Glucose Monitoring Devices Market Segmentation Analysis:
By Product Type
Self-monitoring blood glucose devices lead the glucose monitoring devices market with a 58% segment share. Widespread availability and affordability support strong adoption. Patients rely on fingerstick testing for routine glucose checks. Clinical familiarity strengthens physician recommendations. Insurance coverage supports consistent usage. Continuous glucose monitoring devices hold a 42% share, driven by real-time tracking and improved glycemic control. SMBG devices dominate due to lower costs and ease of access. High diabetes prevalence sustains daily testing needs. Ongoing device accuracy improvements further support SMBG demand across home and clinical settings.
- For instance, Roche Diagnostics’ Accu-Chek Guide system delivers laboratory-aligned accuracy within ±10 mg/dL at low glucose ranges, based on ISO 15197:2013 standards.
By Technology
Invasive monitoring dominates with a 73% market share in the glucose monitoring devices market. Proven accuracy and regulatory approval support strong trust. Fingerstick and sensor-based methods remain clinical standards. Non-invasive monitoring accounts for a 27% share, driven by patient comfort and reduced pain. Technology maturity limits large-scale adoption for non-invasive options. Invasive dominance reflects reliability and established reimbursement. Healthcare providers prioritize precise readings for treatment decisions. Continuous improvements in sensor comfort and lifespan further reinforce invasive monitoring leadership.
- For instance, Dexcom’s G7 CGM system uses a 10-day wearable sensor with an automated applicator that inserts the filament in under one second, improving placement consistency and user comfort.
By End User
Homecare settings represent the largest end-user segment with a 61% market share. Rising self-management of diabetes supports home use. User-friendly devices enable frequent monitoring. Growing elderly population increases homecare reliance. Hospitals and clinics hold a 39% share, driven by diagnosis and treatment initiation. Homecare dominance reflects shift toward patient-centered care. Telehealth integration supports remote monitoring. Convenience and cost savings strengthen adoption in home environments. Long-term disease management trends continue driving demand in homecare settings.
Key Growth Drivers
Rising Global Prevalence of Diabetes
Diabetes prevalence continues increasing across all age groups. Lifestyle changes and aging populations raise disease incidence. Regular glucose monitoring remains essential for disease management. Physicians emphasize frequent testing to prevent complications. Homecare adoption supports daily monitoring routines. Early diagnosis increases device usage rates. Public health programs promote screening initiatives. Urbanization influences dietary habits and diabetes risk. This driver sustains consistent demand for glucose monitoring devices across developed and emerging healthcare systems.
- For instance, Abbott Laboratories reports that its FreeStyle Libre systems generate one glucose reading every minute, producing 1,440 readings per day per user, supporting tighter glycemic tracking.
Shift Toward Self-Monitoring and Homecare Management
Patients increasingly manage diabetes at home. User-friendly devices simplify daily glucose tracking. Homecare reduces hospital visits and treatment costs. Telehealth integration supports remote data sharing. Elderly patients benefit from convenient monitoring solutions. Caregivers rely on easy-to-use devices. Insurance coverage supports home-based testing. Patient education improves compliance. This driver accelerates demand for personal glucose monitoring devices globally.
- For instance, Roche Diagnostics’ Accu-Chek Instant meter delivers test results in under 4 seconds and stores up to 720 readings with date and time stamps, improving long-term monitoring continuity.
Technological Advancements in Monitoring Accuracy
Device accuracy improves with sensor innovation. Enhanced calibration reduces measurement errors. Faster result delivery supports timely treatment decisions. Continuous monitoring improves glycemic control. Data connectivity enables trend analysis. Software integration supports personalized care plans. Manufacturers invest in R&D continuously. Improved reliability builds patient and physician trust. This driver strengthens adoption across both clinical and homecare environments.
Key Trends & Opportunities
Growth of Continuous Glucose Monitoring Adoption
Continuous monitoring gains acceptance among patients. Real-time alerts improve safety and compliance. Reduced fingerstick testing enhances comfort. Integration with mobile apps improves usability. Physicians value continuous data insights. Pediatric and insulin-dependent patients show strong adoption. Technology upgrades extend sensor life. This trend creates strong opportunities for premium device expansion.
- For instance, Dexcom’s G7 system captures glucose readings every 5 minutes, generating 288 data points per day to support detailed glycemic profiling.
Integration with Digital Health Platforms
Devices connect seamlessly with smartphones and wearables. Cloud-based data sharing supports remote care. AI-driven analytics enhance glucose insights. Digital dashboards improve patient engagement. Healthcare providers access real-time data. Personalized alerts support lifestyle adjustments. This trend opens opportunities for data-driven diabetes management solutions.
- For instance, Medtronic’s Guardian Connect platform uploads glucose data automatically to CareLink software, enabling clinicians to review up to 30 days of continuous readings per patient session.
Key Challenges
High Cost of Advanced Monitoring Devices
Advanced devices carry higher upfront costs. Limited reimbursement affects accessibility. Cost sensitivity remains high in emerging markets. Sensor replacement adds recurring expenses. Budget constraints limit adoption. Pricing pressure affects manufacturer margins. This challenge slows penetration of premium glucose monitoring technologies.
Accuracy and Reliability Concerns in New Technologies
New monitoring methods face validation challenges. Inconsistent readings reduce user confidence. Environmental factors affect performance. Regulatory approval timelines remain lengthy. Clinical acceptance requires extensive testing. Device calibration increases complexity. This challenge delays adoption of next-generation monitoring solutions.
Regional Analysis
North America
North America holds a 37% market share in the glucose monitoring devices market. High diabetes prevalence drives routine monitoring demand. Strong insurance coverage supports device access. Continuous glucose monitoring adoption remains high among insulin users. Digital health integration improves care coordination. Homecare monitoring dominates usage patterns. Robust regulatory frameworks ensure device reliability. Innovation pipelines remain active across leading manufacturers. The United States leads regional demand due to advanced healthcare infrastructure and strong patient education programs.
Europe
Europe accounts for a 29% market share in the glucose monitoring devices market. Public healthcare systems support broad access to monitoring tools. Aging populations increase diabetes management needs. Clinical guidelines promote regular testing. Continuous monitoring grows steadily through reimbursement expansion. Pharmacies and clinics serve as key distribution points. Regulatory emphasis ensures quality and safety. Western Europe drives volume through established care pathways and technology adoption.
Asia Pacific
Asia Pacific represents a 24% market share in the glucose monitoring devices market. Rapid urbanization raises diabetes incidence. Large patient populations drive volume demand. Homecare adoption grows with awareness programs. Cost-effective SMBG devices dominate usage. Digital platforms expand access and education. Government initiatives improve screening rates. China and India contribute significantly due to scale and improving healthcare access.
Rest of the World
The rest of the world holds a 10% market share in the glucose monitoring devices market. Latin America and the Middle East lead regional demand. Public health initiatives support screening and monitoring. Price sensitivity influences device choice. SMBG remains the primary method. Distribution improves through pharmacies and clinics. Gradual reimbursement expansion supports adoption. Growth opportunities rise as awareness and access improve.
Glucose Monitoring Devices Market Segmentations:
By Product Type
- Self-monitoring blood glucose devices
- Continuous glucose monitoring devices
By Technology
- Invasive monitoring
- Non-invasive monitoring
By End User
- Hospitals and clinics
- Homecare settings
By Geography
- North America
- U.S.
- Canada
- Mexico
- Europe
- Germany
- France
- U.K.
- Italy
- Spain
- Rest of Europe
- Asia Pacific
- China
- Japan
- India
- South Korea
- South-east Asia
- Rest of Asia Pacific
- Latin America
- Brazil
- Argentina
- Rest of Latin America
- Middle East & Africa
- GCC Countries
- South Africa
- Rest of the Middle East and Africa
Competitive Landscape
Competitive landscape analysis highlights Abbott Laboratories, Dexcom, Medtronic, Roche Diagnostics, and Ascensia Diabetes Care as leading participants in the glucose monitoring devices market. These companies compete through technology innovation, product accuracy, and strong global distribution. Market leaders focus on continuous glucose monitoring systems with real-time alerts and data connectivity. Integration with mobile apps and digital health platforms strengthens differentiation. Established players leverage reimbursement coverage and clinician trust to defend market share. Ongoing investment in sensor longevity and user comfort improves adoption. Strategic partnerships with digital health providers expand ecosystem capabilities. Competitive pressure remains high as companies balance affordability with advanced features. Regulatory compliance, data reliability, and patient outcomes remain critical factors shaping competitive positioning across global markets.
Key Player Analysis
- Abbott Laboratories
- Dexcom
- Medtronic
- Roche Diagnostics
- Ascensia Diabetes Care
- LifeScan
- Senseonics
- Ypsomed
- Braun
- ARKRAY
Recent Developments
- In April 2025, Dexcom received U.S. FDA clearance for the Dexcom G7 15-Day Continuous Glucose Monitoring (CGM) System.
- In 2024, Roche Diagnostics maintained efforts to enhance connected glucose monitoring, continuing integration of blood glucose data with digital management platforms and apps.
Report Coverage
The research report offers an in-depth analysis based on Product Type, Technology, End User and Geography. It details leading market players, providing an overview of their business, product offerings, investments, revenue streams, and key applications. Additionally, the report includes insights into the competitive environment, SWOT analysis, current market trends, as well as the primary drivers and constraints. Furthermore, it discusses various factors that have driven market expansion in recent years. The report also explores market dynamics, regulatory scenarios, and technological advancements that are shaping the industry. It assesses the impact of external factors and global economic changes on market growth. Lastly, it provides strategic recommendations for new entrants and established companies to navigate the complexities of the market.
Request a Free Sample
Fill in your details and we'll send you a free sample report.
- Sample data tables & charts
- Research methodology
Need a Custom Version of This Report?
Tailor the scope, geography, or segments to your exact requirements.
- Custom geography or segment scope
- Direct access to our analyst team
Frequently Asked Questions
What is the current market size for Glucose Monitoring Devices market, and what is its projected size in 2032?
At what Compound Annual Growth Rate is the Glucose Monitoring Devices market projected to grow between 2024 and 2032?
Which Glucose Monitoring Devices market segment held the largest share in 2024?
What are the primary factors fueling the growth of the Glucose Monitoring Devices market?
Who are the leading companies in the Glucose Monitoring Devices market?
Which region commanded the largest share of the Glucose Monitoring Devices market in 2024?
Table of Content
Chapter 1. Report Introduction
- 1.1 Report Description & Purpose
- 1.1.1 Report Title & Market Definition
- 1.1.2 Unique Selling Propositions (USP) & Key Differentiators
- 1.1.3 Value Proposition for Stakeholders
- 1.2 Research Objectives
- 1.2.1 Market Sizing Objectives (Volume & Revenue) (Volume Where Applicable)
- 1.2.2 Segmentation Objectives
- 1.2.3 Competitive Intelligence Objectives
- 1.2.4 Forecast & Scenario Objectives
- 1.3 Report Scope
- 1.3.1 Glucose Monitoring Devices Scope – Segments & Subsegments Covered
- 1.3.2 Geographic Scope – Regions & Countries Covered
- 1.3.3 Historical Period, Base Year & Forecast Period (2024; forecast to 2032)
- 1.3.4 Inclusions & Exclusions
- 1.4 Industry Classification & Applicable Codes
- 1.5 Currency, Measurement Units & Valuation Basis
- 1.6 Target Stakeholders
- 1.7 Limitations & Assumptions
Chapter 2. Executive Summary
- 2.1 Global Glucose Monitoring Devices Market Snapshot
- 2.1.1 Market Size – Historical (2024) & Forecast (2024-2032) (2024: USD 13,154 million → 2032: USD 20,080.85 million)
- 2.1.2 Volume & Revenue – Global Totals (Volume Where Applicable)
- 2.1.3 Key Market Highlights – Top Five Facts
- 2.2 Glucose Monitoring Devices Market Segmentation Snapshot
- 2.2.1 Market Split by Region – 2024 vs. 2032
- 2.3 Competitive Snapshot
- 2.3.1 Top 10 Players by Revenue Share – 2024
- 2.3.2 Top 10 Players by Volume Share – 2024 (Volume Where Applicable)
- 2.3.3 Recent Strategic Developments (18-Month Summary)
- 2.4 Key Investment Highlights & Strategic Conclusions
Chapter 3. Glucose Monitoring Devices Market Dynamics & Industry Analysis
- 3.1 Market Overview & Context
- 3.1.1 Glucose Monitoring Devices Market Position in the Broader Industry Value Chain
- 3.1.2 Demand Structure & Purchasing Dynamics
- 3.1.3 Market Maturity & Development Stage by Region
- 3.2 Glucose Monitoring Devices Market Drivers
- 3.3 Glucose Monitoring Devices Market Restraints & Challenges
- 3.4 Glucose Monitoring Devices Market Opportunities
- 3.5 Porter's Five Forces Analysis
- 3.5.1 Threat of New Entrants
- 3.5.2 Bargaining Power of Suppliers
- 3.5.3 Bargaining Power of Buyers
- 3.5.4 Threat of Substitutes
- 3.5.5 Competitive Rivalry – Intensity Assessment
- 3.6 Glucose Monitoring Devices Value Chain Analysis
- 3.6.1 Upstream – Key Inputs, Resources & Suppliers
- 3.6.1.1 Key Input/Resource 1
- 3.6.1.2 Key Input/Resource 2
- 3.6.1.3 Key Input/Resource 3
- 3.6.2 Midstream – Core Operations & Value Creation
- 3.6.2.1 Operating Model & Process Overview
- 3.6.2.2 Key Operating Locations & Capabilities by Company
- 3.6.3 Downstream – Market Channels & End Users
- 3.6.3.1 Direct Sales & Customer Engagement Channels
- 3.6.3.2 Indirect Sales, Intermediaries & Partner Channels
- 3.6.4 Value Chain Profitability Analysis
- 3.6.1 Upstream – Key Inputs, Resources & Suppliers
- 3.7 PESTEL Analysis
- 3.7.1 Political Factors
- 3.7.2 Economic Factors
- 3.7.3 Social Factors
- 3.7.4 Technological Factors
- 3.7.5 Environmental Factors
- 3.7.6 Legal Factors
- 3.8 Glucose Monitoring Devices Supply Chain Analysis
- 3.8.1 Critical Input & Resource Availability Risk Assessment
- 3.8.2 Supplier & Operational Concentration Risk (Geographic Exposure)
- 3.8.3 Supply & Service Disruption Impact Analysis
- 3.9 Regulatory & Policy Landscape
Note: The regulatory and policy landscape section covers regulations based on their applicability to the market, Glucose Monitoring Devices category, geography, and scope of the study. Only regulatory frameworks with a material impact on operations, compliance, trade, sustainability, or market access are analyzed in detail.
Chapter 4. Key Investment Pockets & Opportunity Analysis
- 4.1 Glucose Monitoring Devices Market Attractiveness Analysis
- 4.1.1 By Region – Investment Attractiveness Matrix (Market Size × CAGR)
- 4.2 Absolute Revenue Growth Opportunity
- 4.2.1 By Region – Absolute Revenue Growth Through 2032
- 4.3 Incremental Demand Opportunity
- 4.3.1 By Region – Incremental Demand Through 2032
- 4.3.2 Segment – Incremental Demand
- 4.4 Emerging Submarket Opportunity Deep Dive (Subject to Applicability)
- 4.5 Priority Market Opportunity Scorecards
- 4.5.1 United States
- 4.5.2 Europe
- 4.5.3 Asia
- 4.5.4 Middle East & Africa
Note: Priority market opportunity scorecards reflect the geographic scope and strategic relevance of the study. Listed markets are indicative and may be adapted to the industry.
Chapter 5. Glucose Monitoring Devices Cross-Border Trade & Market Access Analysis
- 5.1 International Trade & Cross-Border Activity Overview
- 5.1.1 Global Export Value by Country (2024)
- 5.1.2 Global Export Volume by Country (2024) (Volume Where Applicable)
- 5.1.3 Global Import Value by Country (2024)
- 5.1.4 Global Import Volume by Country (2024) (Volume Where Applicable)
- 5.1.5 Net Trade Balance by Country (2024)
- 5.2 Export Analysis – Segment
- 5.2.1 Category 1 (Applicable Classification Code)
- 5.2.2 Category 2 (Applicable Classification Code)
- 5.2.3 Category 3 (Applicable Classification Code)
- 5.2.4 Category 4 (Applicable Classification Code)
- 5.2.5 Category 5 (Applicable Classification Code)
- 5.3 Import Analysis – Segment
- 5.3.1 Category 1 (Applicable Classification Code)
- 5.3.2 Category 2 (Applicable Classification Code)
- 5.3.3 Category 3 (Applicable Classification Code)
- 5.3.4 Category 4 (Applicable Classification Code)
- 5.3.5 Category 5 (Applicable Classification Code)
- 5.4 Cross-Border Pricing & Transaction Benchmarks
- 5.4.1 Export Pricing – Segment & Country
- 5.4.2 Import Pricing – Segment & Source Country
- 5.4.3 Price Trends (2024)
- 5.5 Key Cross-Border Trade & Delivery Routes
- 5.5.1 Cross-Border Trade/Delivery Route 1
- 5.5.2 Cross-Border Trade/Delivery Route 2
- 5.5.3 Cross-Border Trade/Delivery Route 3
- 5.5.4 Cross-Border Trade/Delivery Route 4
- 5.5.5 Cross-Border Trade/Delivery Route 5
- 5.6 Trade Policy & Market Access Impact Assessment
- 5.6.1 Tariff & Non-Tariff Barriers
- 5.6.2 Regional Trade & Economic Integration Frameworks
- 5.6.3 Bilateral & Multilateral Trade Agreements
- 5.6.4 Cross-Border Operating, Licensing & Localization Requirements
Note: This chapter applies where cross-border trade or delivery is relevant to Glucose Monitoring Devices. Goods, services, and digital offerings are assessed using applicable classifications and transaction measures. Import-export volumes, trade balances, and route analyses are included only where meaningful to the market.
Chapter 6. Competitive Landscape & Company Benchmarking
- 6.1 Glucose Monitoring Devices Market Concentration & Structure
- 6.1.1 Herfindahl-Hirschman Index (HHI) – vs. 2024
- 6.1.2 Leading, Mid-Sized & Emerging Player Structure
- 6.1.3 Global, Regional & Local Player Dynamics
- 6.2 Glucose Monitoring Devices Market Share Analysis – 2024
- 6.2.1 Global Revenue Share by Company
- 6.2.2 Global Volume Share by Company (Volume Where Applicable)
- 6.2.3 Regional Revenue Share
- 6.2.4 Market Share Evolution ( vs. 2024)
- 6.2.5 Company Market Share by Key Segment
- 6.2.6 Company Market Share by Customer Group
- 6.3 Operating Scale, Capacity & Infrastructure Analysis
- 6.3.1 Global Operating Scale & Supply Capacity
- 6.3.2 Resource Utilization & Operating Efficiency
- 6.3.3 Output, Service Delivery & Activity Metrics
- 6.3.4 Operating Footprint & Infrastructure Map
- 6.3.5 Planned Operational & Capacity Expansion
- 6.4 Glucose Monitoring Devices Competitive Benchmarking Matrix
- 6.4.1 Revenue, Growth, Profitability & Operating Metric Comparison
- 6.4.2 Channel Revenue Mix
- 6.4.3 Geographic Revenue Exposure
- 6.4.4 R&D Intensity
- 6.4.5 Sustainability Maturity
- 6.5 Strategic Developments in Glucose Monitoring Devices (Last 24 Months)
- 6.5.1 Mergers, Acquisitions & Divestments
- 6.5.2 New Products, Services & Solutions in Glucose Monitoring Devices
- 6.5.3 Operational & Infrastructure Expansions
- 6.5.4 Strategic Alliances, Joint Ventures & Partnerships
- 6.5.5 Distribution Expansion & Market Entry
- 6.5.6 Sustainability & ESG Initiatives
- 6.6 Competitive Strategy Mapping
- 6.6.1 Leader, Challenger, Follower & Niche Classification
- 6.6.2 Pricing Strategy Comparison
- 6.6.3 Channel Strategy Matrix
Note: Strategic developments are included based on their materiality and the availability of reliable information.
Chapter 7. Global Glucose Monitoring Devices Market – By Sales & Delivery Channel
- 7.1 Segment Overview
- 7.1.1 Volume & Revenue Split by Channel (2024 & 2032) (Volume Where Applicable)
- 7.1.2 Channel Mix Evolution (2024-2032)
Chapter 8. Regional Market Analysis – Global Overview
- 8.1 Global Regional Overview
- 8.1.1 Regional Volume Share (Volume Where Applicable)
- 8.1.2 Regional Revenue Share
- 8.1.3 Regional Volume by Region (Volume Where Applicable)
- 8.1.4 Regional Revenue by Region
- 8.1.5 Regional Forecast Through 2032
- 8.2 Cross-Regional Segment Analysis
- 8.2.1 By Sales & Delivery Channel
- 8.2.2 By Competitive Positioning & Price Tier
Chapter 9. North America Glucose Monitoring Devices Market
- 9.1 United States
- 9.2 Canada
- 9.3 Mexico
Chapter 10. Europe Glucose Monitoring Devices Market
- 10.1 Germany
- 10.2 France
- 10.3 Italy
- 10.4 United Kingdom
- 10.5 Spain
- 10.6 Poland
- 10.7 Russia
- 10.8 Netherlands
- 10.9 Belgium
- 10.10 Sweden
- 10.11 Denmark
- 10.12 Norway
- 10.13 Rest of Europe
Chapter 11. Asia Pacific Glucose Monitoring Devices Market
- 11.1 China
- 11.2 India
- 11.3 Japan
- 11.4 South Korea
- 11.5 Thailand
- 11.6 Indonesia
- 11.7 Vietnam
- 11.8 Malaysia
- 11.9 Australia
- 11.10 Rest of Asia Pacific
Chapter 12. Latin America Glucose Monitoring Devices Market
- 12.1 Brazil
- 12.2 Argentina
- 12.3 Colombia
- 12.4 Chile
- 12.5 Rest of Latin America
Chapter 13. Middle East Glucose Monitoring Devices Market
- 13.1 Saudi Arabia
- 13.2 United Arab Emirates
- 13.3 Turkey
- 13.4 Israel
- 13.5 Iran
- 13.6 Rest of the Middle East
Chapter 14. Africa Glucose Monitoring Devices Market
- 14.1 South Africa
- 14.2 Egypt
- 14.3 Nigeria
- 14.4 Morocco
- 14.5 Rest of Africa
Chapter 15. Glucose Monitoring Devices Company Profiles
- 15.1 [Company 01]
- 15.1.1 Company Overview
- 15.1.2 Key Management Personnel
- 15.1.3 Products & Services Portfolio
- 15.1.4 Financial Performance
- 15.1.5 Key Market Focus & Geographic Presence
- 15.1.6 Recent Developments & Strategic Initiatives
Note: The company profile list is preliminary and may change based on research findings, market developments, data availability, and client requirements.
Chapter 16. Appendices
- Appendix A – List of Abbreviations & Acronyms
- Appendix B – Industry Classification Code Reference – Full Series
- Appendix C – Supply, Output & Operating Capacity Data Tables
- Appendix D – End-Use & Demand Base Tables
- Appendix E – Demand, Adoption & Usage Assumptions
- Appendix F – Pricing & Revenue Metric Reference Tables
- Appendix G – Company Operations & Infrastructure Database
- Appendix H – Cross-Border Trade & Activity Data Tables (Where Applicable)
- Appendix I – Regulatory Summary Tables
- Appendix J – Primary Research Participant List (Anonymized)
- Appendix K – Primary Research Questionnaire Framework
- Appendix L – Data Sources & Bibliography
- Appendix M – Market Size Divergence & Source Comparison
Chapter 17. Research Methodology
- 17.1 Research Framework & Philosophy
- 17.2 Secondary Research – Sources, Hierarchy & Data Extraction
- 17.3 Data Modeling – Bottom-Up & Top-Down Market Sizing
- 17.4 Primary Research – Stakeholder Framework, LOI & Sample Sizes
- 17.5 Forecast Methodology – Regression, Scenario & Sensitivity Analysis
- 17.6 Quality Control – Four-Layer Validation Framework
- 17.7 Limitations & Standard Assumptions
- 17.8 Disclaimer
