
| REPORT ATTRIBUTE | DETAILS |
|---|---|
| Historical Period | 2020-2023 |
| Base Year | 2024 |
| Forecast Period | 2025-2032 |
| Burger Boxes Market Size 2024 | USD 4,038.67 million |
| Burger Boxes Market, CAGR | 4.71% |
| Burger Boxes Market Size 2032 | USD 6,007.68 million |
Market Overview
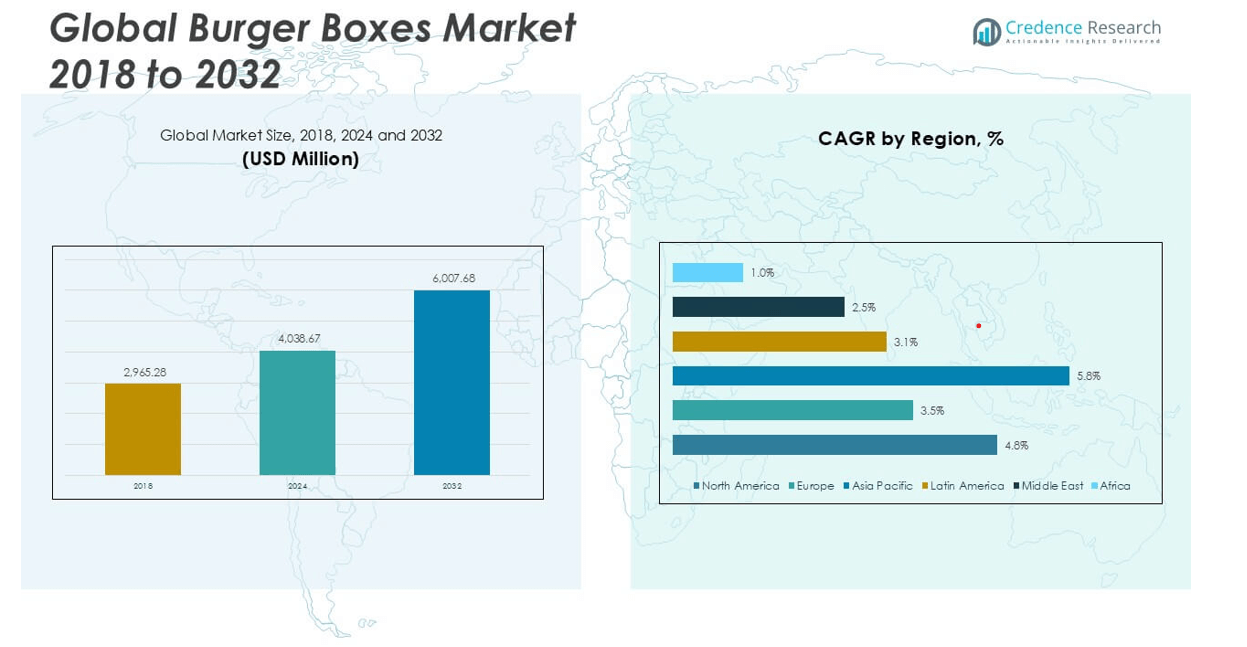
The Burger Boxes market size was valued at USD 2,965.28 million in 2018, reached USD 4,038.67 million in 2024, and is anticipated to reach USD 6,007.68 million by 2032, at a CAGR of 4.74% during the forecast period.
The burger boxes market is led by prominent players such as BioPak, SHANGHAI CHUNKAI GROUP, Welm Supply Chain, and ZEE Packaging, all of which offer innovative, eco-friendly, and customizable packaging solutions tailored to quick-service restaurants and delivery platforms. Regional players like Viraj Packers, Ajay Packers, and Mahalaxmi Flexible Packaging maintain strong domestic presence by offering cost-effective, paper-based alternatives. These companies compete on sustainability, design flexibility, and supply reliability. Geographically, North America dominates the global market, holding a 41.8% share in 2024, driven by a high concentration of fast-food chains and strong demand for sustainable packaging. Asia Pacific follows as the fastest-growing region, fueled by urbanization, rising disposable incomes, and a growing fast-food culture in countries like India and China. The combination of environmental regulations and rising consumer expectations continues to shape competition and regional expansion strategies across the industry.
Market Insights
- The burger boxes market was valued at USD 4,038.67 million in 2024 and is projected to reach USD 6,007.68 million by 2032, growing at a CAGR of 4.74% during the forecast period.
- Growing demand from quick-service restaurants (QSRs), food trucks, and delivery platforms is driving market growth, alongside the rising preference for convenient and hygienic packaging.
- Key trends include increased adoption of sustainable materials like paper and cardboard and a growing focus on custom-printed boxes for brand promotion.
- The market is moderately fragmented, with players such as BioPak, SHANGHAI CHUNKAI GROUP, and Viraj Packers competing through innovation, cost-effectiveness, and eco-friendly product portfolios.
- North America holds the largest share at 41.8%, followed by Asia Pacific with 31.4%, while paper-based burger boxes lead the material segment due to regulatory support and environmental awareness.
Market Segmentation Analysis:
By Material
The Burger Boxes market, when segmented by material, is dominated by the paper-based sub-segment, accounting for the largest market share in 2024. The increasing consumer preference for eco-friendly and biodegradable packaging solutions has significantly driven the demand for paper burger boxes. Governments and regulatory bodies promoting sustainable packaging alternatives have also played a crucial role in accelerating this trend. While plastic boxes offer durability and resistance to moisture, environmental concerns and strict regulations regarding plastic usage have limited their adoption. Cardboard, another rising segment, is gaining popularity due to its rigidity and recyclable nature.
- For instance, BioPak has produced over 1.2 billion paper-based food packaging units, including burger boxes, using FSC-certified materials, significantly replacing plastic-based offerings in fast food chains across Australia and New Zealand.
By Shape
In terms of shape, square burger boxes hold the dominant market share across global markets. Their stackability, ease of production, and efficient space utilization in storage and transportation contribute to their popularity among food service providers. Square boxes also provide better structural integrity and are preferred for branding and printing purposes. On the other hand, round boxes, though gaining traction in niche segments due to their aesthetic appeal, remain limited in usage, especially in large-scale operations, due to higher production costs and less efficient packaging logistics.
- For instance, SHANGHAI CHUNKAI GROUP has optimized its square burger box production line to deliver up to 400,000 units per day, significantly reducing turnaround time for bulk QSR orders while minimizing material waste.
By Size
The medium-sized burger boxes segment leads the market in terms of size, capturing the highest share in 2024. This dominance stems from the widespread use of medium boxes in standard burger servings across quick-service restaurants, cafes, and food trucks. They offer a balanced solution between portion control and packaging efficiency. Large-sized boxes, although witnessing increasing demand in gourmet and double-patty burger segments, remain a secondary choice due to higher material costs and limited compatibility with mainstream menu offerings. The growing trend of combo meals and large servings is expected to gradually uplift the demand for large-sized burger boxes.
Market Overview
Rising Demand from Quick-Service Restaurants (QSRs)
The rapid expansion of quick-service restaurants globally is a major driver for the burger boxes market. As fast food consumption rises, especially among urban and younger populations, the need for efficient, hygienic, and disposable packaging grows. Burger chains like McDonald’s, Burger King, and regional QSRs heavily rely on burger boxes to maintain food quality and ensure brand presentation. The convenience factor, coupled with increasing takeaway and delivery orders, further amplifies demand, making burger boxes an essential component of the food service supply chain.
- For instance, WestRock supplies over 600 million corrugated burger boxes annually to global QSR brands, integrating grease-resistant coatings to support extended delivery timelines.
Increased Focus on Sustainable Packaging
Consumer awareness around environmental sustainability has prompted a shift toward eco-friendly burger box materials. This has significantly driven the adoption of recyclable, biodegradable, and compostable packaging solutions, particularly paper and cardboard variants. Regulatory initiatives banning single-use plastics in many countries have accelerated this transition. Packaging manufacturers are responding by innovating in sustainable materials and designs, enabling food service providers to meet both environmental compliance and consumer expectations, thus supporting long-term market growth.
- For instance, BioPak has diverted more than 28,000 tonnes of packaging waste from landfills through its compostable burger box solutions, supported by over 7,000 partnered venues using its closed-loop composting program.
Growth in Online Food Delivery Services
The booming food delivery ecosystem, fueled by platforms like Uber Eats, Zomato, and DoorDash, has directly contributed to the rising need for secure, tamper-proof burger packaging. With more consumers ordering burgers online, there is growing emphasis on maintaining food integrity during transit. Burger boxes that offer heat retention, structural stability, and effective branding have become critical. This demand from food delivery services is encouraging packaging manufacturers to develop versatile and durable box formats that enhance customer experience and brand visibility.
Key Trends & Opportunities
Customization and Branding in Packaging
There is a strong trend toward personalized and branded burger boxes as food businesses aim to strengthen brand identity and consumer recall. Custom-printed boxes not only serve packaging needs but also act as marketing tools. Businesses are leveraging this opportunity to display logos, promotional messages, and QR codes, enhancing consumer engagement. This trend is particularly prominent among local burger chains and food trucks, offering packaging vendors significant scope to deliver innovative and cost-effective customization options.
- For instance, GuPrint has developed over 12,000 unique burger box designs for independent food chains, using UV digital printing that allows full-color branding with lead times under 72 hours for bulk orders.
Technological Advancements in Packaging Materials
Advances in packaging technologies are enabling the development of burger boxes with enhanced features such as moisture resistance, thermal insulation, and anti-leak coatings. These innovations improve food safety and consumer satisfaction, especially for delivery-based consumption. Moreover, the integration of smart packaging elements like freshness indicators is gaining momentum. As R&D efforts continue to evolve material quality and functionality, manufacturers and QSRs can explore new designs that cater to emerging consumption patterns and regulatory standards.
- For instance, Stora Enso introduced burger boxes embedded with food-safe moisture barriers using polymer-free dispersion coating, now used in over 110 million food packaging units across Europe.
Key Challenges
Volatility in Raw Material Prices
Fluctuating costs of raw materials such as paper pulp, cardboard, and bioplastics present a major challenge for burger box manufacturers. Price instability affects production budgets and often results in higher costs for end-users, including QSRs and food vendors. Small and medium enterprises (SMEs), in particular, struggle to absorb these increases without impacting profitability. This challenge emphasizes the need for strategic sourcing and long-term supplier partnerships to ensure pricing stability and uninterrupted supply.
Stringent Regulatory Compliance
Packaging manufacturers face increasing pressure to comply with regional and international regulations focused on environmental protection and food safety. Compliance with guidelines on recyclability, chemical composition, and biodegradability requires continuous product testing and certification, which can increase operational complexity and costs. Navigating differing regulations across countries also poses challenges for global brands. Non-compliance can lead to legal consequences and brand reputation damage, making regulatory alignment a critical operational focus in the burger boxes market.
Regional Analysis
North America
North America held the largest share in the burger boxes market, accounting for approximately 41.8% of the global market in 2024. The market size increased from USD 1,252.03 million in 2018 to USD 1,686.93 million in 2024, and it is projected to reach USD 2,516.59 million by 2032, growing at a CAGR of 4.8%. This growth is driven by the widespread presence of major quick-service restaurants, high consumption of fast food, and growing demand for eco-friendly packaging solutions. The region also benefits from advanced packaging technologies and a strong emphasis on brand-driven packaging formats.
Europe
Europe accounted for 18.2% of the global burger boxes market in 2024, with the market valued at USD 735.49 million, up from USD 570.34 million in 2018. It is expected to reach USD 997.95 million by 2032, registering a CAGR of 3.5% during the forecast period. The region’s growth is supported by rising awareness of sustainable packaging and strong regulatory pressure to eliminate plastic waste. European consumers prefer recyclable and biodegradable packaging, especially in Western Europe. Additionally, the expansion of local fast-food chains and innovative packaging formats tailored to regional preferences contributes to steady market progress.
Asia Pacific
Asia Pacific is the fastest-growing region in the burger boxes market, with a CAGR of 5.8%, and contributed 31.4% to the global market in 2024. The market grew from USD 882.02 million in 2018 to USD 1,266.46 million in 2024, and is forecasted to reach USD 2,049.97 million by 2032. Growth is fueled by urbanization, a rapidly expanding middle class, and increasing adoption of Western fast-food culture in countries like China, India, and Southeast Asia. The rise of online food delivery platforms and demand for convenient, hygienic packaging are key drivers, alongside a growing shift toward paper-based packaging.
Latin America
Latin America captured a 4.7% share of the burger boxes market in 2024, with a market value of USD 188.84 million, rising from USD 140.39 million in 2018. The region is expected to reach USD 248.70 million by 2032, growing at a CAGR of 3.1%. The market is driven by the steady expansion of fast-food outlets, especially in Brazil and Mexico, and the growing trend of food delivery services. However, economic variability and limited investment in packaging innovation remain challenges. Nonetheless, increasing awareness of sustainable materials and brand-oriented packaging solutions are gradually improving market prospects
Middle East
The Middle East burger boxes market stood at USD 103.86 million in 2024, up from USD 83.39 million in 2018, and is projected to reach USD 130.47 million by 2032, at a CAGR of 2.5%. The region held a modest 2.6% share of the global market in 2024. Growth is supported by rising urbanization, increasing food consumption outside the home, and the presence of global fast-food franchises, especially in the Gulf Cooperation Council (GCC) countries. Despite logistical and regulatory challenges, the demand for customized and hygienic packaging is growing in alignment with the expansion of the foodservice industry.
Africa
Africa contributed the smallest share to the global burger boxes market in 2024, accounting for 1.4%, with a market value of USD 57.08 million, rising from USD 37.10 million in 2018. It is expected to reach USD 64.00 million by 2032, growing at a CAGR of 1.0%. Market development remains slow due to limited fast-food infrastructure and economic challenges in many parts of the continent. However, urban centers in countries like South Africa, Nigeria, and Kenya are witnessing increased adoption of Western food habits, creating incremental opportunities for burger box manufacturers, particularly those offering low-cost, sustainable options.
Market Segmentations:
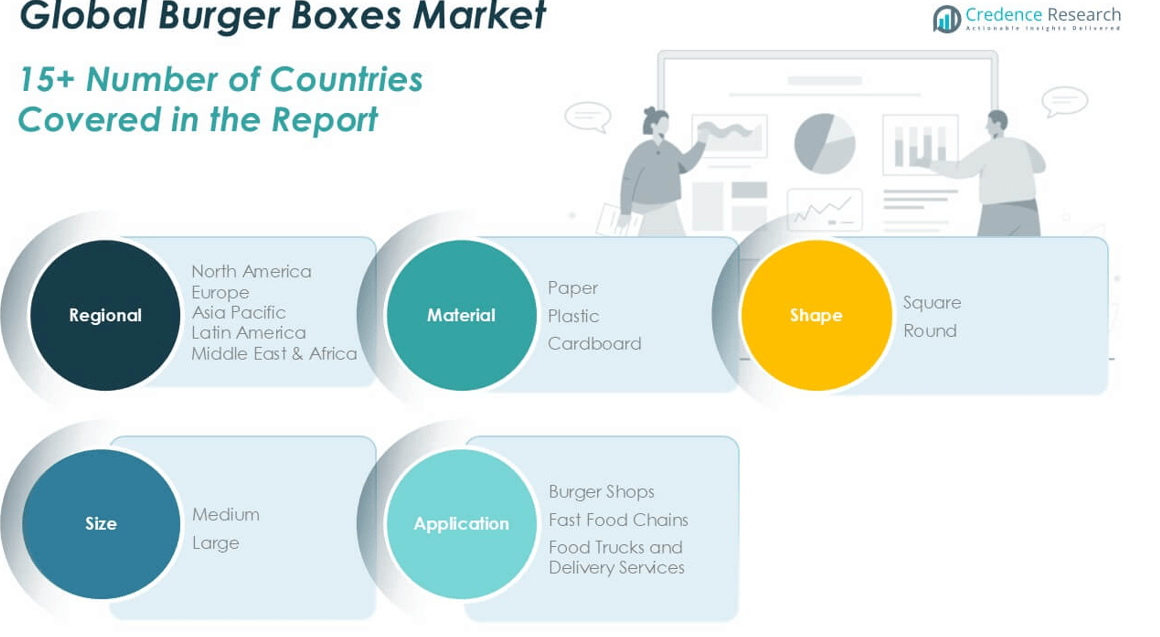
By Material
- Paper
- Plastic
- Cardboard
By Shape
- Square
- Round
By Size
- Medium
- Large
By Application
- Burger Shops
- Fast Food Chains
- Food Trucks and Delivery Services
By Geography
- North America
- U.S.
- Canada
- Mexico
- Europe
- Germany
- France
- U.K.
- Italy
- Spain
- Rest of Europe
- Asia Pacific
- China
- Japan
- India
- South Korea
- South-east Asia
- Rest of Asia Pacific
- Latin America
- Brazil
- Argentina
- Rest of Latin America
- Middle East & Africa
- GCC Countries
- South Africa
- Rest of the Middle East and Africa
Competitive Landscape
The burger boxes market is moderately fragmented, with a mix of regional players and international packaging companies competing on product quality, pricing, sustainability, and customization. Key players such as BioPak, SHANGHAI CHUNKAI GROUP, and Welm Supply Chain have established strong global footprints by offering eco-friendly and innovative packaging solutions tailored to fast food and delivery services. Regional firms like Viraj Packers, Ajay Packers, and Mahalaxmi Flexible Packaging cater to localized demand through cost-effective, flexible packaging offerings. Companies are increasingly investing in sustainable materials, digital printing technologies, and automation to enhance product appeal and operational efficiency. Strategic partnerships with quick-service restaurants and food delivery platforms remain a critical approach to market expansion. Moreover, players are focused on enhancing brand identity for clients through customizable and branded packaging. As environmental regulations tighten and consumer preferences shift toward recyclable and biodegradable options, the competitive focus is expected to center around innovation in sustainable and functional packaging formats.
Key Player Analysis
- Viraj Packers
- Ajay Packers
- ZEE Packaging
- Mahalaxmi Flexible Packaging
- Heaven Praise
- Fibona Exim
- Welm Supply Chain
- SHANGHAI CHUNKAI GROUP
- BFT Packaging
- GuPrint
- Akalbatu
- BioPak
Recent Developments
- In 2025, Ajay Packers is still providing corrugated and paper burger boxes, emphasizing cost-effectiveness and eco-friendliness. Their burger boxes, primarily square, cater to food service businesses in India. They focus on delivering quality and innovative packaging solutions, particularly for the food industry.
- In 2025, BFT Packaging is recognized for its innovative sustainable packaging for burger boxes, shifting towards recyclable and compostable options made from kraft and paper materials instead of plastics. This focus aligns with growing environmental regulations and consumer preferences for eco-friendly products. BFT Packaging is actively pursuing product development and strategic collaborations to expand its market presence.
- In March 2025, Mahalaxmi Flexible Packaging, a company specializing in sustainable food packaging, highlighted their paper-based, eco-friendly, and customizable burger boxes and other food packaging solutions at industry events. Their focus is on providing options for restaurants, QSRs, and delivery businesses.
Market Concentration & Characteristics
The Burger Boxes Market exhibits moderate market concentration, characterized by the presence of both global and regional players competing across quality, price, and sustainability metrics. It remains highly responsive to trends in the quick-service restaurant sector, where demand for hygienic, durable, and eco-friendly packaging continues to shape product innovation. The market shows strong adaptability to environmental regulations, driving the shift from plastic to paper and cardboard materials. It features a high level of customization, with brands demanding packaging that enhances visibility and aligns with sustainability commitments. Leading companies such as BioPak, SHANGHAI CHUNKAI GROUP, and Welm Supply Chain operate across multiple regions, leveraging advanced manufacturing and logistics capabilities. Regional firms focus on cost-effective solutions tailored to local preferences. It demonstrates price sensitivity in developing regions, while developed markets emphasize design and compliance. The structure supports steady innovation cycles and ongoing investment in sustainable packaging technologies to meet evolving regulatory and consumer requirements.
Report Coverage
The research report offers an in-depth analysis based on Material, Shape, Size, Application and Geography. It details leading market players, providing an overview of their business, product offerings, investments, revenue streams, and key applications. Additionally, the report includes insights into the competitive environment, SWOT analysis, current market trends, as well as the primary drivers and constraints. Furthermore, it discusses various factors that have driven market expansion in recent years. The report also explores market dynamics, regulatory scenarios, and technological advancements that are shaping the industry. It assesses the impact of external factors and global economic changes on market growth. Lastly, it provides strategic recommendations for new entrants and established companies to navigate the complexities of the market.
Future Outlook
- The burger boxes market is expected to grow steadily driven by increasing demand from quick-service restaurants and food delivery platforms.
- Sustainability will remain a central focus, with rising adoption of biodegradable and recyclable packaging materials.
- Regulatory pressure against single-use plastics will accelerate the shift toward paper and cardboard-based burger boxes.
- Customization and branding features will gain traction as food businesses seek stronger customer engagement.
- Technological advancements in moisture-resistant and thermal-insulated packaging will improve product performance.
- E-commerce and cloud kitchens will create new demand for tamper-proof and durable packaging solutions.
- Emerging markets in Asia and Latin America will present strong growth opportunities due to expanding fast-food consumption.
- Packaging automation and smart logistics will enhance production efficiency and supply chain responsiveness.
- Strategic partnerships between packaging firms and foodservice brands will shape market dynamics.
- Consumer preference for eco-conscious brands will continue to influence packaging innovation and purchasing decisions.

Request a Free Sample
Fill in your details and we'll send you a free sample report.
- Sample data tables & charts
- Research methodology
Need a Custom Version of This Report?
Tailor the scope, geography, or segments to your exact requirements.
- Custom geography or segment scope
- Direct access to our analyst team
Frequently Asked Questions
What is the current size of the Burger Boxes Market?
What are the key segments within the Burger Boxes Market?
What are some challenges faced by the Burger Boxes Market?
Who are the major players in the Burger Boxes Market?
Table of Content
Chapter 1. Report Introduction
- 1.1 Report Description & Purpose
- 1.1.1 Report Title & Market Definition
- 1.1.2 Unique Selling Propositions (USP) & Key Differentiators
- 1.1.3 Value Proposition for Stakeholders
- 1.2 Research Objectives
- 1.2.1 Market Sizing Objectives (Volume & Revenue) (Volume Where Applicable)
- 1.2.2 Segmentation Objectives
- 1.2.3 Competitive Intelligence Objectives
- 1.2.4 Forecast & Scenario Objectives
- 1.3 Report Scope
- 1.3.1 Burger Boxes Scope – Segments & Subsegments Covered
- 1.3.2 Geographic Scope – Regions & Countries Covered
- 1.3.3 Historical Period, Base Year & Forecast Period (2024; forecast to 2032)
- 1.3.4 Inclusions & Exclusions
- 1.4 Industry Classification & Applicable Codes
- 1.5 Currency, Measurement Units & Valuation Basis
- 1.6 Target Stakeholders
- 1.7 Limitations & Assumptions
Chapter 2. Executive Summary
- 2.1 Global Burger Boxes Market Snapshot
- 2.1.1 Market Size – Historical (2024) & Forecast (2024-2032) (2024: USD 4,038.67 million → 2032: USD 6,007.68 million)
- 2.1.2 Volume & Revenue – Global Totals (Volume Where Applicable)
- 2.1.3 Key Market Highlights – Top Five Facts
- 2.2 Burger Boxes Market Segmentation Snapshot
- 2.2.1 Market Split by Region – 2024 vs. 2032
- 2.3 Competitive Snapshot
- 2.3.1 Top 10 Players by Revenue Share – 2024
- 2.3.2 Top 10 Players by Volume Share – 2024 (Volume Where Applicable)
- 2.3.3 Recent Strategic Developments (18-Month Summary)
- 2.4 Key Investment Highlights & Strategic Conclusions
Chapter 3. Burger Boxes Market Dynamics & Industry Analysis
- 3.1 Market Overview & Context
- 3.1.1 Burger Boxes Market Position in the Broader Industry Value Chain
- 3.1.2 Demand Structure & Purchasing Dynamics
- 3.1.3 Market Maturity & Development Stage by Region
- 3.2 Burger Boxes Market Drivers
- 3.3 Burger Boxes Market Restraints & Challenges
- 3.4 Burger Boxes Market Opportunities
- 3.5 Porter's Five Forces Analysis
- 3.5.1 Threat of New Entrants
- 3.5.2 Bargaining Power of Suppliers
- 3.5.3 Bargaining Power of Buyers
- 3.5.4 Threat of Substitutes
- 3.5.5 Competitive Rivalry – Intensity Assessment
- 3.6 Burger Boxes Value Chain Analysis
- 3.6.1 Upstream – Key Inputs, Resources & Suppliers
- 3.6.1.1 Key Input/Resource 1
- 3.6.1.2 Key Input/Resource 2
- 3.6.1.3 Key Input/Resource 3
- 3.6.2 Midstream – Core Operations & Value Creation
- 3.6.2.1 Operating Model & Process Overview
- 3.6.2.2 Key Operating Locations & Capabilities by Company
- 3.6.3 Downstream – Market Channels & End Users
- 3.6.3.1 Direct Sales & Customer Engagement Channels
- 3.6.3.2 Indirect Sales, Intermediaries & Partner Channels
- 3.6.4 Value Chain Profitability Analysis
- 3.6.1 Upstream – Key Inputs, Resources & Suppliers
- 3.7 PESTEL Analysis
- 3.7.1 Political Factors
- 3.7.2 Economic Factors
- 3.7.3 Social Factors
- 3.7.4 Technological Factors
- 3.7.5 Environmental Factors
- 3.7.6 Legal Factors
- 3.8 Burger Boxes Supply Chain Analysis
- 3.8.1 Critical Input & Resource Availability Risk Assessment
- 3.8.2 Supplier & Operational Concentration Risk (Geographic Exposure)
- 3.8.3 Supply & Service Disruption Impact Analysis
- 3.9 Regulatory & Policy Landscape
Note: The regulatory and policy landscape section covers regulations based on their applicability to the market, Burger Boxes category, geography, and scope of the study. Only regulatory frameworks with a material impact on operations, compliance, trade, sustainability, or market access are analyzed in detail.
Chapter 4. Key Investment Pockets & Opportunity Analysis
- 4.1 Burger Boxes Market Attractiveness Analysis
- 4.1.1 By Region – Investment Attractiveness Matrix (Market Size × CAGR)
- 4.2 Absolute Revenue Growth Opportunity
- 4.2.1 By Region – Absolute Revenue Growth Through 2032
- 4.3 Incremental Demand Opportunity
- 4.3.1 By Region – Incremental Demand Through 2032
- 4.3.2 Segment – Incremental Demand
- 4.4 Emerging Submarket Opportunity Deep Dive (Subject to Applicability)
- 4.5 Priority Market Opportunity Scorecards
- 4.5.1 United States
- 4.5.2 Europe
- 4.5.3 Asia
- 4.5.4 Middle East & Africa
Note: Priority market opportunity scorecards reflect the geographic scope and strategic relevance of the study. Listed markets are indicative and may be adapted to the industry.
Chapter 5. Burger Boxes Cross-Border Trade & Market Access Analysis
- 5.1 International Trade & Cross-Border Activity Overview
- 5.1.1 Global Export Value by Country (2024)
- 5.1.2 Global Export Volume by Country (2024) (Volume Where Applicable)
- 5.1.3 Global Import Value by Country (2024)
- 5.1.4 Global Import Volume by Country (2024) (Volume Where Applicable)
- 5.1.5 Net Trade Balance by Country (2024)
- 5.2 Export Analysis – Segment
- 5.2.1 Category 1 (Applicable Classification Code)
- 5.2.2 Category 2 (Applicable Classification Code)
- 5.2.3 Category 3 (Applicable Classification Code)
- 5.2.4 Category 4 (Applicable Classification Code)
- 5.2.5 Category 5 (Applicable Classification Code)
- 5.3 Import Analysis – Segment
- 5.3.1 Category 1 (Applicable Classification Code)
- 5.3.2 Category 2 (Applicable Classification Code)
- 5.3.3 Category 3 (Applicable Classification Code)
- 5.3.4 Category 4 (Applicable Classification Code)
- 5.3.5 Category 5 (Applicable Classification Code)
- 5.4 Cross-Border Pricing & Transaction Benchmarks
- 5.4.1 Export Pricing – Segment & Country
- 5.4.2 Import Pricing – Segment & Source Country
- 5.4.3 Price Trends (2024)
- 5.5 Key Cross-Border Trade & Delivery Routes
- 5.5.1 Cross-Border Trade/Delivery Route 1
- 5.5.2 Cross-Border Trade/Delivery Route 2
- 5.5.3 Cross-Border Trade/Delivery Route 3
- 5.5.4 Cross-Border Trade/Delivery Route 4
- 5.5.5 Cross-Border Trade/Delivery Route 5
- 5.6 Trade Policy & Market Access Impact Assessment
- 5.6.1 Tariff & Non-Tariff Barriers
- 5.6.2 Regional Trade & Economic Integration Frameworks
- 5.6.3 Bilateral & Multilateral Trade Agreements
- 5.6.4 Cross-Border Operating, Licensing & Localization Requirements
Note: This chapter applies where cross-border trade or delivery is relevant to Burger Boxes. Goods, services, and digital offerings are assessed using applicable classifications and transaction measures. Import-export volumes, trade balances, and route analyses are included only where meaningful to the market.
Chapter 6. Competitive Landscape & Company Benchmarking
- 6.1 Burger Boxes Market Concentration & Structure
- 6.1.1 Herfindahl-Hirschman Index (HHI) – the historical period vs. 2024
- 6.1.2 Leading, Mid-Sized & Emerging Player Structure
- 6.1.3 Global, Regional & Local Player Dynamics
- 6.2 Burger Boxes Market Share Analysis – 2024
- 6.2.1 Global Revenue Share by Company
- 6.2.2 Global Volume Share by Company (Volume Where Applicable)
- 6.2.3 Regional Revenue Share
- 6.2.4 Market Share Evolution (the historical period vs. 2024)
- 6.2.5 Company Market Share by Key Segment
- 6.2.6 Company Market Share by Customer Group
- 6.3 Operating Scale, Capacity & Infrastructure Analysis
- 6.3.1 Global Operating Scale & Supply Capacity
- 6.3.2 Resource Utilization & Operating Efficiency
- 6.3.3 Output, Service Delivery & Activity Metrics
- 6.3.4 Operating Footprint & Infrastructure Map
- 6.3.5 Planned Operational & Capacity Expansion
- 6.4 Burger Boxes Competitive Benchmarking Matrix
- 6.4.1 Revenue, Growth, Profitability & Operating Metric Comparison
- 6.4.2 Channel Revenue Mix
- 6.4.3 Geographic Revenue Exposure
- 6.4.4 R&D Intensity
- 6.4.5 Sustainability Maturity
- 6.5 Strategic Developments in Burger Boxes (Last 24 Months)
- 6.5.1 Mergers, Acquisitions & Divestments
- 6.5.2 New Products, Services & Solutions in Burger Boxes
- 6.5.3 Operational & Infrastructure Expansions
- 6.5.4 Strategic Alliances, Joint Ventures & Partnerships
- 6.5.5 Distribution Expansion & Market Entry
- 6.5.6 Sustainability & ESG Initiatives
- 6.6 Competitive Strategy Mapping
- 6.6.1 Leader, Challenger, Follower & Niche Classification
- 6.6.2 Pricing Strategy Comparison
- 6.6.3 Channel Strategy Matrix
Note: Strategic developments are included based on their materiality and the availability of reliable information.
Chapter 7. Global Burger Boxes Market – By Sales & Delivery Channel
- 7.1 Segment Overview
- 7.1.1 Volume & Revenue Split by Channel (2024 & 2032) (Volume Where Applicable)
- 7.1.2 Channel Mix Evolution (2024-2032)
Chapter 8. Regional Market Analysis – Global Overview
- 8.1 Global Regional Overview
- 8.1.1 Regional Volume Share (Volume Where Applicable)
- 8.1.2 Regional Revenue Share
- 8.1.3 Regional Volume by Region (Volume Where Applicable)
- 8.1.4 Regional Revenue by Region
- 8.1.5 Regional Forecast Through 2032
- 8.2 Cross-Regional Segment Analysis
- 8.2.1 By Sales & Delivery Channel
- 8.2.2 By Competitive Positioning & Price Tier
Chapter 9. North America Burger Boxes Market
- 9.1 United States
- 9.2 Canada
- 9.3 Mexico
Chapter 10. Europe Burger Boxes Market
- 10.1 Germany
- 10.2 France
- 10.3 Italy
- 10.4 United Kingdom
- 10.5 Spain
- 10.6 Poland
- 10.7 Russia
- 10.8 Netherlands
- 10.9 Belgium
- 10.10 Sweden
- 10.11 Denmark
- 10.12 Norway
- 10.13 Rest of Europe
Chapter 11. Asia Pacific Burger Boxes Market
- 11.1 China
- 11.2 India
- 11.3 Japan
- 11.4 South Korea
- 11.5 Thailand
- 11.6 Indonesia
- 11.7 Vietnam
- 11.8 Malaysia
- 11.9 Australia
- 11.10 Rest of Asia Pacific
Chapter 12. Latin America Burger Boxes Market
- 12.1 Brazil
- 12.2 Argentina
- 12.3 Colombia
- 12.4 Chile
- 12.5 Rest of Latin America
Chapter 13. Middle East Burger Boxes Market
- 13.1 Saudi Arabia
- 13.2 United Arab Emirates
- 13.3 Turkey
- 13.4 Israel
- 13.5 Iran
- 13.6 Rest of the Middle East
Chapter 14. Africa Burger Boxes Market
- 14.1 South Africa
- 14.2 Egypt
- 14.3 Nigeria
- 14.4 Morocco
- 14.5 Rest of Africa
Chapter 15. Burger Boxes Company Profiles
- 15.1 [Company 01]
- 15.1.1 Company Overview
- 15.1.2 Key Management Personnel
- 15.1.3 Products & Services Portfolio
- 15.1.4 Financial Performance
- 15.1.5 Key Market Focus & Geographic Presence
- 15.1.6 Recent Developments & Strategic Initiatives
Note: The company profile list is preliminary and may change based on research findings, market developments, data availability, and client requirements.
Chapter 16. Appendices
- Appendix A – List of Abbreviations & Acronyms
- Appendix B – Industry Classification Code Reference – Full Series
- Appendix C – Supply, Output & Operating Capacity Data Tables
- Appendix D – End-Use & Demand Base Tables
- Appendix E – Demand, Adoption & Usage Assumptions
- Appendix F – Pricing & Revenue Metric Reference Tables
- Appendix G – Company Operations & Infrastructure Database
- Appendix H – Cross-Border Trade & Activity Data Tables (Where Applicable)
- Appendix I – Regulatory Summary Tables
- Appendix J – Primary Research Participant List (Anonymized)
- Appendix K – Primary Research Questionnaire Framework
- Appendix L – Data Sources & Bibliography
- Appendix M – Market Size Divergence & Source Comparison
Chapter 17. Research Methodology
- 17.1 Research Framework & Philosophy
- 17.2 Secondary Research – Sources, Hierarchy & Data Extraction
- 17.3 Data Modeling – Bottom-Up & Top-Down Market Sizing
- 17.4 Primary Research – Stakeholder Framework, LOI & Sample Sizes
- 17.5 Forecast Methodology – Regression, Scenario & Sensitivity Analysis
- 17.6 Quality Control – Four-Layer Validation Framework
- 17.7 Limitations & Standard Assumptions
- 17.8 Disclaimer
