Market Overview
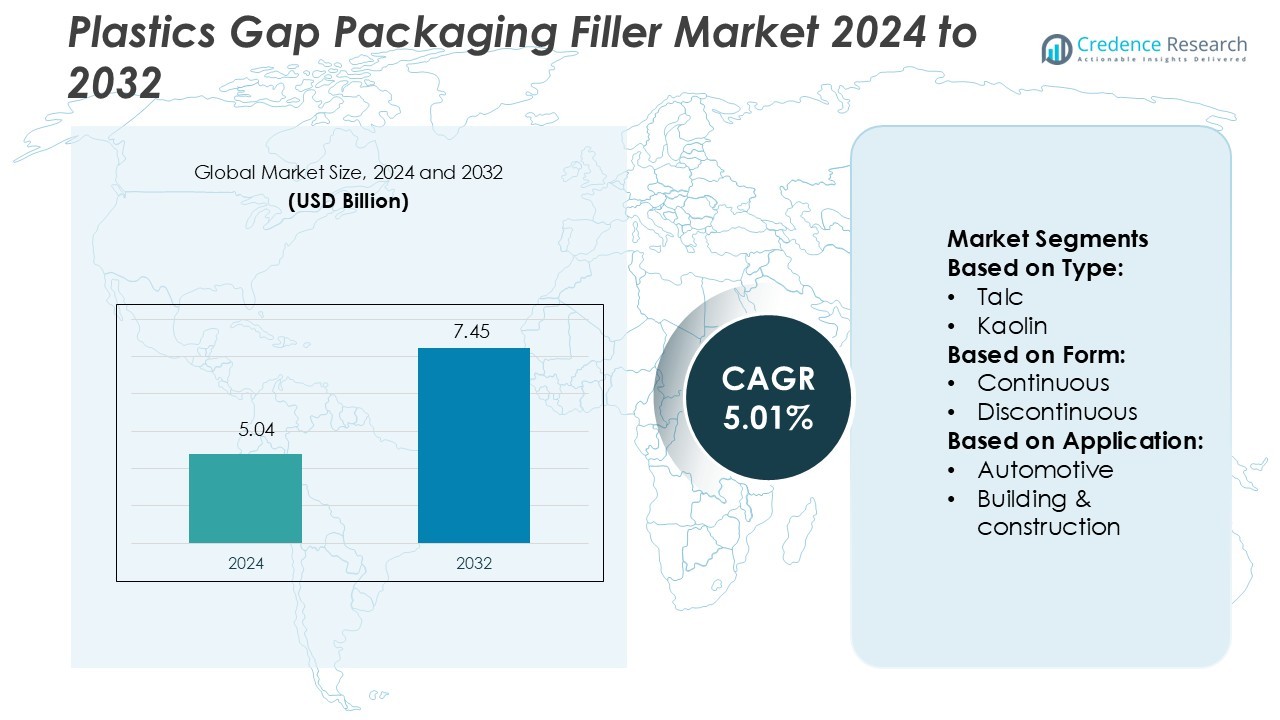
Plastics Gap Packaging Filler Market size was valued USD 5.04 billion in 2024 and is anticipated to reach USD 7.45 billion by 2032, at a CAGR of 5.01% during the forecast period.
| REPORT ATTRIBUTE |
DETAILS |
| Historical Period |
2020-2023 |
| Base Year |
2024 |
| Forecast Period |
2025-2032 |
| Plastics Gap Packaging Filler Market Size 2024 |
USD 5.04 Billion |
| Plastics Gap Packaging Filler Market, CAGR |
5.01% |
| Plastics Gap Packaging Filler Market Size 2032 |
USD 7.45 Billion |
The Plastics Gap Packaging Filler Market features strong participation from leading players such as BASF SE, Huber Engineered Materials, The Dow Chemical Company, Johnson & Johnson, LKAB Group, Avient Corporation, Hoffman Minerals, Imerys, Mineral Technologies Inc., and Omya AG. These companies compete through advancements in filler performance, sustainable material innovation, and strategic partnerships with packaging manufacturers. Their focus on product optimization, lightweight formulations, and eco-efficient solutions strengthens their global presence. Among all regions, Asia-Pacific leads the market with a 38% share, driven by rapid industrialization, high packaging consumption, and expanding manufacturing infrastructure in countries such as China, India, and Japan. The region’s strong investment in sustainable packaging solutions and cost-effective production technologies continues to reinforce its dominance in the global market.
Access crucial information at unmatched prices!
Request your sample report today & start making informed decisions powered by Credence Research Inc.!
Download Sample
Market Insights
- The Plastics Gap Packaging Filler Market was valued at USD 5.04 billion in 2024 and is projected to reach USD 7.45 billion by 2032, registering a CAGR of 5.01%.
- Rising demand for lightweight and sustainable packaging solutions drives market growth across industries such as food, consumer goods, and construction.
- Increasing investment in nanofiller technology and bio-based materials shapes key market trends, enhancing filler strength, recyclability, and thermal stability.
- The market is competitive, with companies focusing on innovation, eco-efficient formulations, and strategic partnerships to expand global reach.
- Asia-Pacific dominates with a 38% market share, supported by strong manufacturing infrastructure in China, India, and Japan, while the packaging segment leads with the largest share due to growing demand for cost-efficient and high-strength fillers.
Market Segmentation Analysis:
By Type
Calcium carbonate dominated the plastics gap packaging filler market, accounting for the largest share in 2025 due to its cost efficiency, easy dispersion, and ability to improve mechanical strength. Ground calcium carbonate remains the most preferred sub-type, offering enhanced rigidity and smooth surface finish in packaging materials. The precipitated form supports high-purity applications that require superior whiteness and uniform particle size. Demand for lightweight fillers such as talc and kaolin continues to grow as manufacturers focus on reducing resin content and improving recyclability in polymer-based packaging solutions.
- For instance, Huber Engineered Materials’ Hubercarb® W Series (from Quincy, Illinois) offers a typical CaCO₃ content of 99.3 % and crystalline silica at 0.02 %. One grade (M3T from their M Series) provides a median particle size of 3.3 µm and a brightness of 89 (Hunter reflectance).
By Form
Continuous fillers held the dominant market share, driven by their superior uniformity, structural stability, and ease of processing in high-speed extrusion and molding applications. These fillers enhance tensile strength and impact resistance, making them suitable for rigid packaging formats. Discontinuous fillers are gaining adoption in cost-sensitive and flexible packaging uses. Nanofillers are emerging as the fastest-growing form, supported by their ability to improve barrier performance, flame resistance, and overall thermal stability in lightweight plastic composites.
- For instance, Dow’s VORAFORCE™ TL series systems support filler loading up to 80 % calcium carbonate by weight, enabling structural-resin composites with densities as low as 950 g/L.
By Application
The packaging segment led the market share, propelled by the rising demand for sustainable and high-strength packaging materials across consumer goods and food sectors. Plastic fillers improve dimensional stability, stiffness, and opacity, ensuring durability and product protection. The automotive and construction sectors follow closely, utilizing fillers to enhance component strength and cost efficiency. Electrical and electronics applications are expanding as fillers support heat dissipation and flame retardancy. The growing preference for recyclable and performance-optimized materials continues to reinforce filler usage across packaging innovations.
Key Growth Drivers
Expanding Demand from the Packaging Industry
The rise in e-commerce and food delivery services is fueling demand for effective gap fillers to protect fragile items during transport. Lightweight plastic fillers provide high cushioning performance, reducing breakage and packaging costs. Manufacturers are adopting advanced extrusion and molding processes to enhance filler strength and flexibility. Increasing use of recyclable and bio-based materials further supports market expansion. Innovation in lightweight polymer blends allows higher product protection efficiency and reduced waste, strengthening the packaging industry’s reliance on plastic gap fillers.
- For instance, J&J’s MedTech division reports recycling over 25,000 single-use device components in its circular economy programme across Europe in 2021–2022. The company also pursues separate initiatives focused on improving the sustainability of device packaging.
Technological Advancements in Polymer Engineering
Continuous advancements in polymer science have enabled manufacturers to design fillers with enhanced performance and sustainability. Improved melt-flow properties and high impact resistance ensure superior packaging protection under stress. The development of nanocomposite fillers offers enhanced structural integrity and heat resistance. These innovations reduce material consumption while maintaining high mechanical strength. The integration of advanced compounding systems and 3D modeling tools allows precision in filler design and faster production cycles, driving overall market competitiveness.
- For instance, LKAB Minerals’ MagniF® magnetite-based filler achieves compound densities of over 3.0 g/cm³ in polypropylene and can reach 3.5 g/cm³ with inline compounding, enabling high weight and vibration-damping polymer parts.
Rising Adoption of Sustainable and Recyclable Materials
Growing environmental awareness and stricter waste regulations are pushing industries toward eco-friendly packaging materials. Recyclable and bio-based plastic fillers, such as polylactic acid (PLA) and polyethylene terephthalate (PET), are gaining popularity. These materials lower carbon emissions and align with circular economy goals. Packaging manufacturers are investing in R&D to create biodegradable fillers that match traditional plastic durability. Such sustainability-driven innovations enhance brand reputation and appeal to environmentally conscious consumers, accelerating adoption across multiple end-use sectors.
Key Trends & Opportunities
Integration of Automation and Smart Manufacturing
Automation and Industry 4.0 technologies are transforming production efficiency in filler manufacturing. Robotic extrusion lines and automated quality control systems reduce errors and improve consistency. Smart sensors track moisture, density, and composition, ensuring uniform output. Data analytics supports predictive maintenance, minimizing downtime and enhancing cost efficiency. The adoption of digital monitoring also allows companies to meet large-scale custom orders faster, providing a strong competitive edge in the global market.
- For instance, Avient’s ColorMatrix™ FlexOne™ liquid-metering system features an integrated gravimetric metering pump and automated calibration system, delivering a 99%+ yield of contents from its recyclable PlanetPak™ container.
Growing Focus on Circular Economy Initiatives
Many packaging producers are aligning with global sustainability goals by promoting circular economy practices. Recycled polymers and reusable fillers are becoming mainstream, reducing raw material dependency. Governments and corporations are investing in advanced recycling infrastructure to support closed-loop production. This shift opens new opportunities for companies developing innovative reprocessing techniques. Partnerships between resin producers and packaging firms are enabling efficient material recovery, boosting demand for recyclable filler materials.
- For instance, Hoffmann Mineral conducted a Life Cycle Assessment for its “Aktifit® AM” filler, which was certified under ISO 14040:2021 / 14044:2021 and analyzed the product’s energy input and CO₂ emissions across extraction, production, and packaging phases.
Expansion in Emerging Economies
Rapid industrialization and urbanization across Asia-Pacific, Latin America, and Africa are creating new growth avenues. Increasing consumption of packaged goods and rising disposable incomes are driving higher packaging volumes. Local manufacturing hubs are emerging due to favorable trade policies and low production costs. Global companies are expanding regional presence through joint ventures and new facilities. This geographic diversification strengthens supply chains and enhances accessibility to cost-efficient raw materials.
Key Challenges
Environmental Concerns and Regulatory Pressure
The use of conventional plastic fillers raises environmental concerns related to pollution and waste disposal. Governments worldwide are imposing strict regulations on single-use plastics and non-recyclable packaging materials. Compliance with these standards increases operational costs for manufacturers. The transition to bio-based materials also demands heavy investment in R&D and process modification. Companies failing to adapt may face penalties or reduced market access, challenging long-term profitability.
Fluctuating Raw Material Prices
The market heavily depends on petroleum-based polymers such as polyethylene and polypropylene. Volatility in crude oil prices directly impacts production costs, creating uncertainty for manufacturers. Sudden price hikes can disrupt supply chains and reduce profit margins. To counter this, companies are diversifying suppliers and exploring bio-derived alternatives. However, high initial costs and limited scalability of sustainable options continue to pose a challenge to consistent production efficiency and pricing stability.
Regional Analysis
North America
North America holds the largest share of 32% in the Plastics Gap Packaging Filler Market, driven by robust e-commerce, retail, and logistics industries. The U.S. leads regional demand, supported by high packaging consumption in consumer goods and electronics. Sustainable packaging initiatives and advanced recycling infrastructure strengthen market growth. Key companies are investing in lightweight, biodegradable fillers to meet corporate sustainability goals. Technological advancements and automation in manufacturing processes enhance production efficiency. The presence of leading packaging firms and strong regulatory frameworks promoting circular economy practices further support North America’s market leadership.
Europe
Europe accounts for 28% of the global market, propelled by stringent environmental regulations and strong adoption of eco-friendly packaging materials. Countries like Germany, France, and the UK are leading in sustainable filler innovations. The region’s focus on recyclable and bio-based polymers drives consistent market development. The rise of e-commerce logistics and food delivery services also boosts consumption of gap fillers. European manufacturers are expanding R&D activities for lightweight and energy-efficient production. Policies such as the EU Green Deal and packaging waste directives encourage sustainable manufacturing practices, reinforcing Europe’s position as a sustainability-driven market.
Asia-Pacific
Asia-Pacific commands 25% of the market share, fueled by rapid industrialization and growing consumer demand for packaged products. China, Japan, and India are major contributors, supported by expanding manufacturing and retail sectors. Increasing internet penetration and online shopping accelerate packaging filler consumption. Cost-efficient labor and abundant raw material availability attract global manufacturers to set up local production facilities. Government support for green packaging technologies is also strengthening regional competitiveness. Rising awareness of environmental issues and large-scale investments in polymer innovation are expected to position Asia-Pacific as the fastest-growing regional market.
Latin America
Latin America represents 9% of the Plastics Gap Packaging Filler Market, driven by the growth of retail, food delivery, and personal care sectors. Brazil and Mexico lead regional demand, supported by expanding consumer markets and local manufacturing bases. The adoption of lightweight and recyclable packaging materials is increasing due to environmental awareness. However, limited recycling infrastructure and price volatility of raw materials remain challenges. Regional initiatives promoting circular economy principles are gradually improving sustainable production. International companies are partnering with local firms to introduce biodegradable fillers, fostering innovation and regional competitiveness.
Middle East & Africa
The Middle East & Africa region accounts for 6% of the global market, supported by expanding industrial and logistics sectors. The United Arab Emirates and South Africa lead regional growth due to strong retail and export-oriented packaging activities. Investments in smart manufacturing and sustainable materials are gradually reshaping production processes. Demand for cost-efficient and durable packaging fillers continues to rise with rapid urbanization. However, dependence on imported raw materials and low recycling rates limit large-scale adoption. Ongoing infrastructure development and sustainability-driven initiatives are expected to enhance the region’s future market potential.
Market Segmentations:
By Type:
By Form:
By Application:
- Automotive
- Building & construction
By Geography
- North America
- Europe
- Germany
- France
- U.K.
- Italy
- Spain
- Rest of Europe
- Asia Pacific
- China
- Japan
- India
- South Korea
- South-east Asia
- Rest of Asia Pacific
- Latin America
- Brazil
- Argentina
- Rest of Latin America
- Middle East & Africa
- GCC Countries
- South Africa
- Rest of the Middle East and Africa
Competitive Landscape
The Plastics Gap Packaging Filler Market is characterized by strong competition among leading players such as BASF SE, Huber Engineered Materials, The Dow Chemical Company, Johnson & Johnson, LKAB Group, Avient Corporation, Hoffman Minerals, Imerys, Mineral Technologies Inc., and Omya AG. The Plastics Gap Packaging Filler Market is highly competitive, driven by continuous innovation and sustainability initiatives. Manufacturers are investing in advanced filler technologies that enhance packaging durability, reduce material consumption, and improve cost efficiency. The market is witnessing growing demand for lightweight and recyclable fillers, encouraging research in bio-based and mineral-based materials. Companies are prioritizing product customization to meet specific performance requirements across industries such as food, consumer goods, and industrial packaging. Strategic partnerships and technological advancements are reshaping the competitive landscape, with a strong focus on improving barrier properties, thermal resistance, and environmental compliance. The integration of automation and digital quality control further strengthens production efficiency and product consistency, positioning the market for long-term growth.
Key Player Analysis
- BASF SE
- Huber Engineered Materials
- The Dow Chemical Company
- Johnson & Johnson
- LKAB Group
- Avient Corporation
- Hoffman Minerals
- Imerys
- Mineral Technologies Inc.
- Omya AG
Recent Developments
- In September 2025, Mitsui Chemicals, Idemitsu Kosan, and Sumitomo Chemical entered into a Memorandum of Understanding to integrate Sumitomo Chemical’s polypropylene (PP) and linear low-density polyethylene (LLDPE) businesses in Japan into Prime Polymer, a joint venture owned by Mitsui and Idemitsu.
- In April 2025, Ube Industries completed the acquisition of Lanxess’s polyurethane (PU) business. The purchase included production facilities in the US, Europe, and Asia, expanding Ube’s global footprint in PU materials.
- In November 2024, Symphony Environmental launched a biodegradable resin for plastics. The company says its new resin reduces the fossil content of plastic and can be recycled but biodegrades within months if it escapes into the natural environment.
- In January 2024, LyondellBasell Industries Holdings B.V. agreed to acquire a 35% stake in Saudi Arabia-based National Petrochemical Industrial Company (Natpet) from Alujain Corporation. Natpet, a longtime user of LyondellBasell’s Spheripol polypropylene (PP) technology, has an annual PP production capacity of about 400,000 tons.
Shape Your Report to Specific Countries or Regions & Enjoy 30% Off!
Report Coverage
The research report offers an in-depth analysis based on Type, Form, Application and Geography. It details leading market players, providing an overview of their business, product offerings, investments, revenue streams, and key applications. Additionally, the report includes insights into the competitive environment, SWOT analysis, current market trends, as well as the primary drivers and constraints. Furthermore, it discusses various factors that have driven market expansion in recent years. The report also explores market dynamics, regulatory scenarios, and technological advancements that are shaping the industry. It assesses the impact of external factors and global economic changes on market growth. Lastly, it provides strategic recommendations for new entrants and established companies to navigate the complexities of the market.
Future Outlook
- Manufacturers will increasingly adopt eco-friendly fillers to meet sustainability and regulatory goals.
- Demand for lightweight fillers will grow due to rising focus on cost and material efficiency.
- Technological advancements will enhance filler compatibility with diverse plastic resins.
- Bio-based filler development will gain traction as industries shift toward green packaging.
- Automation and AI-driven quality control will improve production precision and consistency.
- Partnerships between packaging and chemical firms will expand to accelerate innovation.
- Rising demand from food and consumer goods sectors will drive large-scale adoption.
- Advanced surface treatment technologies will improve filler dispersion and performance.
- Regional expansion in Asia-Pacific will strengthen global production and supply networks.
- Increased R&D investments will lead to next-generation fillers with higher functionality and recyclability.


