
C Resin Market Overview:
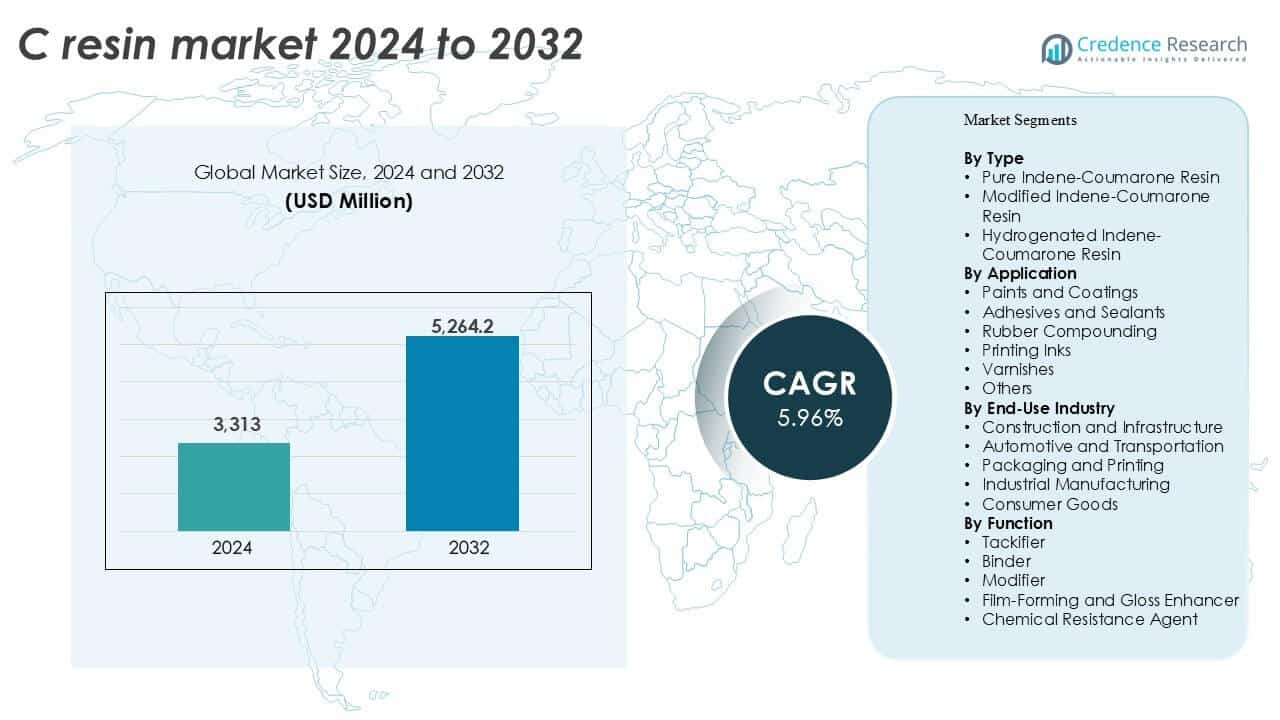
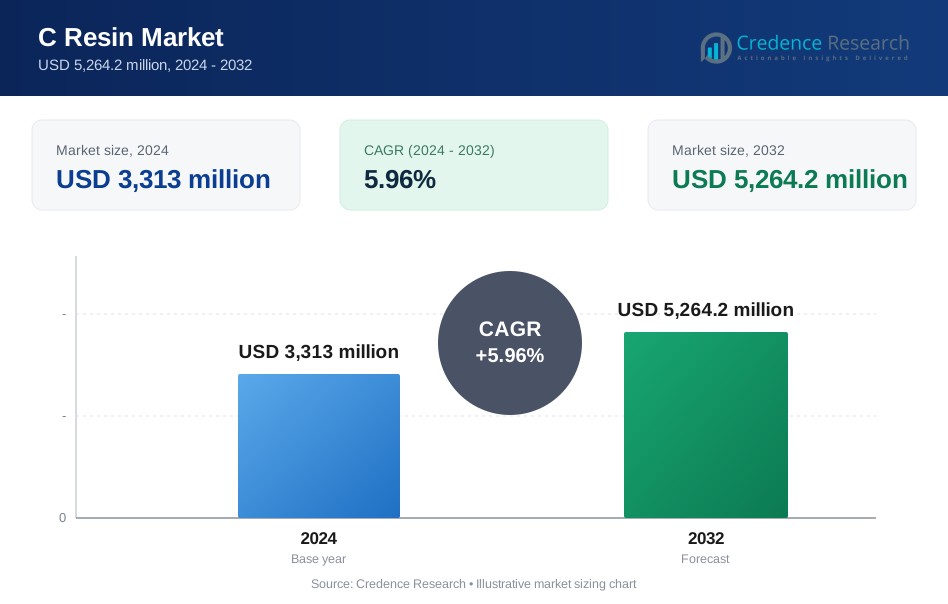
C Resin market size was valued at USD 3,313 million in 2024 and is anticipated to reach USD 5,264.2 million by 2032, at a CAGR of 5.96% during the forecast period.
| REPORT ATTRIBUTE | DETAILS |
|---|---|
| Historical Period | 2020-2023 |
| Base Year | 2024 |
| Forecast Period | 2025-2032 |
| C Resin Market Size 2024 | USD 3,313 million |
| C Resin Market, CAGR | 5.96% |
| C Resin Market Size 2032 | USD 5,264.2 million |
Top players in the C resin market include Kolon Industries, Neville Chemical Company, Cray Valley (TotalEnergies), Arakawa Chemical Industries, and Eastman Chemical Company (indirectly via specialty resins). These companies lead through diverse product portfolios, global reach, and strong ties to end-use industries such as construction, automotive, and packaging. Chinese manufacturers like Zibo Luhua Hongjin and Shanghai Jinsen are expanding their global presence with cost-competitive offerings. In 2024, Asia Pacific held the largest regional market share at 45%, driven by high industrial output, infrastructure projects, and growing automotive production. North America and Europe followed with 21% and 18% respectively, benefiting from technological innovation and sustainability-focused resin formulations.
C Resin Market Insights
- The C resin market was valued at USD 3,313 million in 2024 and is projected to reach USD 5,264.2 million by 2032, growing at a CAGR of 5.96% during the forecast period.
- Demand from construction and automotive sectors continues to drive market growth due to wide usage in coatings, adhesives, and rubber applications.
- Sustainability trends are pushing manufacturers toward low-VOC and hydrogenated resin formulations, creating new opportunities in developed regions.
- Competitive landscape includes Kolon Industries, Neville Chemical, Cray Valley (TotalEnergies), and several emerging Asian players with cost-effective supply capabilities.
- Asia Pacific holds the largest regional share at 45%, followed by North America at 21% and Europe at 18%; paints and coatings lead by application segment with over 38% share, while pure indene-coumarone resin dominates type segment with over 45% share.
C Resin Market Segmentation Analysis:
By Type
Pure indene-coumarone resin leads the C resin market, accounting for over 45% share in 2024. Its dominance stems from consistent demand in rubber and tire manufacturing due to excellent tackifying properties. Modified indene-coumarone resin follows closely, supported by custom formulations required in specialty coatings and sealants. Hydrogenated indene-coumarone resin remains a niche but growing segment, valued for its enhanced UV resistance and lower odor in sensitive applications. Demand across all types is driven by performance versatility, thermal stability, and compatibility with a range of polymers in industrial formulations.
- For instance, Rütgers Group supplies pure indene-coumarone resin with a softening point of 95 °C. Technical sheets list a number-average molecular weight close to 900 g/mol.
By Application
Paints and coatings represent the largest application segment, holding around 38% of the total market in 2024. The segment benefits from C resin’s strong adhesion, gloss enhancement, and durability features in protective and decorative finishes. Adhesives and sealants follow as another key segment due to resin compatibility with rubber and elastomers. Rubber compounding continues to show steady uptake in tire and conveyor belt production. Printing inks and varnishes segments also see consistent demand. Growth across applications is propelled by rapid infrastructure expansion and evolving end-user performance requirements.
- For instance, Neville Chemical reports C-resin-based coatings achieving pencil hardness of HB to H. Cross-cut adhesion tests reach ISO Class 0 on steel panels.
By End-Use Industry
Construction and infrastructure emerge as the dominant end-use industry, capturing nearly 36% market share in 2024. High-volume demand for paints, coatings, and sealants drives C resin consumption in commercial and residential building projects. Automotive and transportation is the second-largest segment, relying on C resin for tire production, soundproofing, and adhesive applications. Packaging and printing industries benefit from improved print clarity and surface finish enabled by C resins. Industrial manufacturing and consumer goods contribute moderate growth, supported by product durability and visual appeal needs across end-user applications.
C Resin Market Key Growth Drivers
Rising Demand from the Construction and Infrastructure Sector
The construction and infrastructure industry plays a critical role in driving the C resin market. C resins are widely used in paints, coatings, sealants, and adhesives essential for civil structures. With rapid urbanization in developing countries and renovation activities in developed regions, demand continues to rise. These resins enhance adhesion, water resistance, and durability in building applications, supporting long-lasting performance. Government investments in public infrastructure, including roads, airports, and housing, further expand usage. For instance, Asia-Pacific’s infrastructure spending remains robust, boosting demand for performance coatings. This structural demand keeps C resin consumption stable across large-volume applications. In addition, environmental regulations push manufacturers to adopt high-performance but compliant formulations, in which C resins find increased relevance. Their chemical stability, cost efficiency, and versatility make them a staple in construction-related product formulations, supporting strong market fundamentals.
- For instance, Rütgers Group (now part of Rain Carbon Inc.) supplies aromatic hydrocarbon resins for protective coatings used on steel bridges. Product data shows water absorption is typically below 0.1% (by weight) after 24-hour immersion tests, a key factor in providing strong corrosion resistance.
Expanding Automotive Production and Aftermarket Consumption
The automotive industry remains a key growth engine for the C resin market, particularly through its applications in tire manufacturing, automotive adhesives, sealants, and noise-dampening materials. C resins provide strong tackifying properties, temperature stability, and weather resistance needed for vehicle components. Rising automotive production, especially in emerging markets like India, China, and Southeast Asia, is fueling the demand. In the aftermarket segment, replacement parts such as tires, belts, and vibration dampers also use C resin-based compounds extensively. OEMs are adopting lightweight materials and high-performance adhesives, in which C resins are a crucial ingredient. With electric vehicles gaining traction, noise-reduction materials using resins are seeing higher adoption. The sector’s global footprint ensures consistent consumption and reinforces C resins as a vital industrial input in both manufacturing and servicing activities.
- For instance, Kolon Industries provides C5 and C9 hydrocarbon resins, such as the HIKOREZ® and HIKOTACK® series, for tire bonding compounds. These resins enhance initial tack and processing; however, while they offer high heat stability, consistent tack retention is typically measured through standard rubber aging tests (such as 72 hours at 70 °C or shorter cycles at 100 °C).
Increasing Usage in Adhesives, Sealants, and Industrial Coatings
The growing demand for high-performance adhesives and industrial coatings is another major growth driver. C resins act as tackifiers and viscosity modifiers that improve formulation performance in multiple end-use sectors. Packaging, woodworking, footwear, and textiles increasingly use adhesive products that incorporate C resins due to their ability to bond diverse substrates and withstand environmental stress. Industrial coatings such as anti-corrosion, marine, or machinery coatings also benefit from C resins’ chemical resistance and film-forming capability. The surge in manufacturing activities and export-oriented production in Asia is creating new demand for such resins. Flexible packaging growth, led by e-commerce and food safety regulations, supports further expansion in the adhesives sector. These resins offer a balance of price and performance, making them suitable for diverse adhesive formulations used across industries.
C Resin Market Key Trends & Opportunities
Shift Toward Eco-Friendly and Low-VOC Resin Formulations
Environmental regulations and customer awareness are shaping a shift toward eco-friendly C resin-based products. Manufacturers are investing in formulations with lower volatile organic compounds (VOCs), aligning with tightening global emission norms. Water-based and low-VOC adhesives and coatings are gaining market share across construction, automotive, and packaging sectors. This trend creates opportunities for companies to differentiate through sustainability, especially in Europe and North America where regulations are strict. Hydrogenated indene-coumarone resins are seeing rising interest due to their cleaner profiles and low odor. Brands focusing on “green chemistry” are finding stronger traction among B2B buyers. As environmental compliance becomes central to procurement decisions, manufacturers with R&D capabilities to innovate low-VOC solutions will gain a competitive edge in long-term contracts and global sourcing partnerships.
- For instance, Rütgers Group developed hydrogenated indene-coumarone resins with VOC content below 10 grams per liter in coating
Innovation in Resin Customization for High-Performance Applications
Advances in formulation technology are enabling more tailored C resin solutions to meet specific industry needs. Custom resin grades with enhanced thermal stability, chemical resistance, or optical clarity are being developed to target niche applications. For instance, hydrogenated variants now serve electronics, medical packaging, and automotive interiors due to their low yellowing and excellent UV resistance. Customers are also demanding precise flow properties and compatibility with newer polymers, which drives product customization. This trend supports the entry of premium product lines with higher profit margins. The ability to offer customized formulations for hybrid adhesives or functional coatings represents a strong growth opportunity. Resin manufacturers investing in process innovation and collaborative product development with end-users will benefit most from this trend.
C Resin Market Key Challenges
Price Volatility of Raw Materials
Fluctuating prices of raw materials such as petroleum derivatives significantly impact C resin production costs. Indene and coumarone monomers are by-products of coal tar and petroleum cracking, making them highly sensitive to crude oil price fluctuations and refining output. This volatility affects profit margins and planning for resin producers, especially smaller firms with limited inventory and hedging capacity. Global disruptions—such as refinery shutdowns, supply chain blockages, or geopolitical tensions—can cause sudden price spikes. Moreover, the competition with other petroleum-based resin systems further tightens margins. Manufacturers often struggle to pass on increased costs to end-users quickly, particularly in price-sensitive markets. Managing long-term supply contracts and diversifying feedstock sources remain critical to minimizing this risk.
Environmental Compliance and Regulatory Pressure
Stringent environmental and safety regulations present significant challenges for C resin producers. These resins are often used in solvent-based formulations that may release VOCs, drawing regulatory scrutiny. Compliance with REACH in Europe, EPA standards in the U.S., and similar frameworks in Asia requires constant monitoring, reformulation, and documentation. The costs associated with registration, testing, and process changes burden manufacturers—especially those operating in multiple markets. Regulatory shifts may also restrict specific applications or require phase-outs of older grades. Customers are increasingly demanding certifications and third-party testing, raising the technical and financial barriers for small and mid-sized players. Firms need to invest in sustainable practices, eco-certifications, and R&D to maintain long-term market access.
C Resin Market Regional Analysis
Asia Pacific
Asia Pacific dominates the global C resin market with a share of over 45% in 2024. Strong industrial output, large-scale construction, and rapid urbanization drive high demand across paints, adhesives, and rubber applications. China leads regional consumption due to its expansive tire and construction chemical sectors. India, South Korea, and Southeast Asian nations show rising usage from packaging and automotive industries. Competitive manufacturing costs and growing exports make the region a global production hub. Regional players benefit from cost-effective supply chains and local raw material availability, strengthening Asia Pacific’s leadership in both volume and revenue.
North America
North America holds approximately 21% share of the global C resin market in 2024. Demand is supported by mature construction and automotive industries and the shift toward eco-friendly adhesives and coatings. The U.S. leads regional consumption, driven by stringent environmental regulations favoring low-VOC formulations. Technological advancements and high R&D investment support product innovation in hydrogenated resin variants. Adoption in road infrastructure, aerospace components, and noise-reducing materials in electric vehicles adds to growth. Established supply chains and strong end-user industries help maintain steady regional performance despite pricing pressures from raw material imports.
Europe
Europe accounted for around 18% of the C resin market share in 2024, with strong demand from industrial coatings, construction adhesives, and specialty printing inks. Germany, France, and Italy remain top contributors due to their advanced manufacturing base and regulatory alignment. The European Green Deal and REACH policies push demand for sustainable resin alternatives, accelerating the shift to hydrogenated and low-VOC variants. Automotive and packaging industries continue to be major consumers, backed by OEM innovation and eco-labeling standards. European producers also benefit from high-quality standards, product customization, and integration into value-added end-use applications.
Latin America
Latin America represents about 8% of the global C resin market share in 2024, driven primarily by demand from Brazil and Mexico. Urban development and infrastructure upgrades fuel paints, coatings, and sealant applications. Local tire and footwear industries also support resin consumption. However, limited domestic production capacity results in reliance on imports, increasing price sensitivity. Currency fluctuations and regulatory gaps remain hurdles, but rising automotive aftermarket activity and packaging demand offer growth opportunities. Gradual modernization in manufacturing processes is expected to increase the adoption of customized resin formulations in the coming years.
Middle East & Africa (MEA)
The Middle East & Africa holds a 5% share of the global C resin market in 2024, with growth driven by construction and industrial maintenance sectors. Gulf countries, including the UAE and Saudi Arabia, are key markets due to large-scale infrastructure and commercial development projects. Paints and coatings are the primary application segments, while adhesives and rubber applications grow steadily. Africa shows gradual growth through packaging and consumer goods. However, limited local production and weaker regulatory enforcement constrain wider adoption. Import dependency and cost barriers challenge market expansion but long-term construction demand offers steady traction.
C Resin Market Segmentations:
By Type
- Pure Indene-Coumarone Resin
- Modified Indene-Coumarone Resin
- Hydrogenated Indene-Coumarone Resin
By Application
- Paints and Coatings
- Adhesives and Sealants
- Rubber Compounding
- Printing Inks
- Varnishes
- Others
By End-Use Industry
- Construction and Infrastructure
- Automotive and Transportation
- Packaging and Printing
- Industrial Manufacturing
- Consumer Goods
By Function
- Tackifier
- Binder
- Modifier
- Film-Forming and Gloss Enhancer
- Chemical Resistance Agent
By Geography
- North America
- U.S.
- Canada
- Mexico
- Europe
- Germany
- France
- U.K.
- Italy
- Spain
- Rest of Europe
- Asia Pacific
- China
- Japan
- India
- South Korea
- South-east Asia
- Rest of Asia Pacific
- Latin America
- Brazil
- Argentina
- Rest of Latin America
- Middle East & Africa
- GCC Countries
- South Africa
- Rest of the Middle East and Africa
Competitive Landscape
The C resin market features a mix of global chemical manufacturers and regional producers competing across price, product range, and customization. Leading players such as Kolon Industries, Neville Chemical Company, Arakawa Chemical Industries, and Cray Valley (TotalEnergies) maintain a strong presence through integrated production, global distribution, and diversified resin grades. Asian companies like Zibo Luhua Hongjin, Shanghai Jinsen, and Guangdong Komo are gaining global traction due to cost-efficient operations and increasing exports. Companies are investing in hydrogenated and modified resin development to meet demand for low-VOC and high-performance applications. Strategic moves include joint ventures, product launches, and capacity expansions to secure long-term contracts in automotive, construction, and industrial sectors. Environmental compliance and innovation in eco-friendly formulations are emerging as key differentiators. Market dynamics are shaped by raw material cost fluctuations, technological upgrades, and the ability to offer tailored solutions to end-use industries. Competitive intensity remains high, with regional players challenging established global brands.
Key Player Analysis
- Arakawa Chemical Industries, Ltd.
- Cray Valley (TotalEnergies)
- Eastman Chemical Company (Indirect – Specialty Resins)
- Foreverest Resources Ltd.
- Guangdong Komo Co., Ltd.
- Henan Anglxxon Chemical Co., Ltd.
- Kolon Industries, Inc.
- Lesco Chemical Limited
- Neville Chemical Company
- Shandong Landun New Material Co., Ltd.
- Shanghai Jinsen Hydrocarbon Resins Co., Ltd.
- Zibo Luhua Hongjin New Material Co., Ltd.
Recent Developments
- In March 2025, Westlake Epoxy launched new products at the European Coatings Show (ECS) in Germany. These innovations aim to enhance robustness, safety, and sustainability. The EpoVIVE™ portfolio introduces low-emission, bio-circular alternatives, including the new EPIKOTE™ Resins 901 and 902 for flooring, and AQUAREOUS™ epoxy systems for coatings, all designed to minimize environmental impact.
- In February 2025, Sumitomo Chemical acquired LCP technology from Syensqo, enhancing its capabilities in the liquid crystal polymer (LCP) business, particularly for ICT and mobility applications. LCPs are renowned for their excellent heat resistance and dimensional accuracy and are widely used in electronic components.
- In January 2024, Covestro developed Apec 2045, a high-heat copolycarbonate that significantly reduces production time and costs for molders and medical OEMs, enabling clients to improve production volumes through shorter cycle times
Report Coverage
The research report offers an in-depth analysis based on Type, Application, End-Use Industry, Function and Geography. It details leading market players, providing an overview of their business, product offerings, investments, revenue streams, and key applications. Additionally, the report includes insights into the competitive environment, SWOT analysis, current market trends, as well as the primary drivers and constraints. Furthermore, it discusses various factors that have driven market expansion in recent years. The report also explores market dynamics, regulatory scenarios, and technological advancements that are shaping the industry. It assesses the impact of external factors and global economic changes on market growth. Lastly, it provides strategic recommendations for new entrants and established companies to navigate the complexities of the market.
Future Outlook
- Demand for low-VOC and eco-friendly C resins is expected to grow steadily across industries.
- Asia Pacific will continue leading global consumption due to expanding construction and automotive sectors.
- Manufacturers will invest in hydrogenated and modified resin technologies to meet performance needs.
- Infrastructure modernization in emerging markets will support long-term demand for coatings and sealants.
- Automotive lightweighting and EV growth will boost resin use in adhesives and noise-reducing materials.
- Innovation in custom formulations will create niche opportunities in packaging and electronics applications.
- Regulatory compliance will push companies to reformulate existing products with sustainable ingredients.
- Strategic partnerships and capacity expansions will shape the competitive landscape over the next decade.
- Import dependency and raw material price swings may affect profitability in cost-sensitive regions.
- Growth in industrial coatings and flexible packaging will remain strong contributors to future market expansion.
Request a Free Sample
Fill in your details and we'll send you a free sample report.
- Sample data tables & charts
- Research methodology
Need a Custom Version of This Report?
Tailor the scope, geography, or segments to your exact requirements.
- Custom geography or segment scope
- Direct access to our analyst team
Frequently Asked Questions
What is the current market size for C resin market, and what is its projected size in 2032?
At what Compound Annual Growth Rate is the C resin market projected to grow between 2024 and 2032?
Which C resin market segment held the largest share in 2024?
What are the primary factors fueling the growth of the C resin market?
Who are the leading companies in the C resin market?
Which region commanded the largest share of the C resin market in 2024?
Table of Content
Chapter 1. Report Introduction
- 1.1 Report Description & Purpose
- 1.1.1 Report Title & Market Definition
- 1.1.2 Unique Selling Propositions (USP) & Key Differentiators
- 1.1.3 Value Proposition for Stakeholders
- 1.2 Research Objectives
- 1.2.1 Market Sizing Objectives (Volume & Revenue)
- 1.2.2 Segmentation Objectives
- 1.2.3 Competitive Intelligence Objectives
- 1.2.4 Forecast & Scenario Objectives
- 1.3 Report Scope
- 1.3.1 C Resin Scope – Types & Subtypes Covered
- 1.3.2 Geographic Scope – Regions & Countries Covered
- 1.3.3 Historical Period, Base Year & Forecast Period (2024; forecast to 2032)
- 1.3.4 Inclusions & Exclusions
- 1.4 HS Code & Classification Framework
- 1.5 Currency, Units & Pricing Basis
- 1.6 Target Stakeholders
- 1.7 Limitations & Assumptions
Chapter 2. Executive Summary
- 2.1 Global C Resin Market Snapshot
- 2.1.1 Market Size – Historical (2024) & Forecast (2024-2032) (2024: USD 3,313 million → 2032: USD 5,264.2 million)
- 2.1.2 Volume & Revenue – Global Totals
- 2.1.3 Key Market Highlights – Top Five Facts
- 2.2 C Resin Market Segmentation Snapshot
- 2.2.1 Market Split by Region – 2024 vs. 2032
- 2.3 Competitive Snapshot
- 2.3.1 Top 10 Players by Revenue Share – 2024
- 2.3.2 Top 10 Players by Volume Share – 2024
- 2.3.3 Recent Strategic Developments (18-Month Summary)
- 2.4 Key Investment Highlights & Strategic Conclusions
Chapter 3. C Resin Market Dynamics & Industry Analysis
- 3.1 Market Overview & Context
- 3.1.1 C Resin Market Position in the Broader Automotive Value Chain
- 3.1.2 OEM vs. Replacement Market Dynamics
- 3.1.3 Market Maturity & Development Stage by Region
- 3.2 C Resin Market Drivers
- 3.3 C Resin Market Restraints & Challenges
- 3.4 C Resin Market Opportunities
- 3.5 Porter's Five Forces Analysis
- 3.5.1 Threat of New Entrants
- 3.5.2 Bargaining Power of Suppliers
- 3.5.3 Bargaining Power of Buyers
- 3.5.4 Threat of Substitutes
- 3.5.5 Competitive Rivalry – Intensity Assessment
- 3.6 C Resin Value Chain Analysis
- 3.6.1 Upstream – Raw Material/Input Suppliers
- 3.6.1.1 Raw Material/Input 1
- 3.6.1.2 Raw Material/Input 2
- 3.6.1.3 Raw Material/Input 3
- 3.6.2 Midstream – Production/Manufacturing/Service Delivery
- 3.6.2.1 Production/Process Overview
- 3.6.2.2 Key Facility Locations & Capacity by Manufacturer
- 3.6.3 Downstream – Distribution & End Consumer
- 3.6.3.1 Primary Channel – B2B/OEM
- 3.6.3.2 Secondary Channels – Dealer, Retail, Online, Direct
- 3.6.4 Value Chain Profitability Analysis
- 3.6.1 Upstream – Raw Material/Input Suppliers
- 3.7 PESTEL Analysis
- 3.7.1 Political Factors
- 3.7.2 Economic Factors
- 3.7.3 Social Factors
- 3.7.4 Technological Factors
- 3.7.5 Environmental Factors
- 3.7.6 Legal Factors
- 3.8 C Resin Supply Chain Analysis
- 3.8.1 Raw Material/Input Supply Risk Assessment
- 3.8.2 Manufacturing Concentration Risk (Geographic Exposure)
- 3.8.3 Trade Disruption Impact Analysis
- 3.9 Regulatory & Policy Landscape
Note: The regulatory and policy landscape section covers regulations based on their applicability to the market, C Resin category, geography, and scope of the study. Only regulatory frameworks with a material impact on operations, compliance, trade, sustainability, or market access are analyzed in detail.
Chapter 4. Key Investment Pockets & Opportunity Analysis
- 4.1 C Resin Market Attractiveness Analysis
- 4.1.1 By Region – Investment Attractiveness Matrix (Volume × CAGR)
- 4.2 Absolute Revenue Growth Opportunity
- 4.2.1 By Region – Absolute USD Growth Through 2032
- 4.3 Incremental Volume Opportunity
- 4.3.1 By Region – Incremental Volume Through 2032
- 4.3.2 Segment – Incremental Volume
- 4.4 Emerging Submarket Opportunity Deep Dive (Subject to Applicability)
- 4.5 Emerging Market Opportunity Scorecards
- 4.5.1 United States
- 4.5.2 Europe
- 4.5.3 Asia
- 4.5.4 Middle East & Africa
Note: Emerging Market Opportunity Scorecards will be included based on relevance and strategic importance. Regions listed are indicative and may vary depending on data availability and market dynamics.
Chapter 5. C Resin Import-Export Analysis & Trade Flows
- 5.1 Global Trade Overview
- 5.1.1 Global Export Value by Country (2024)
- 5.1.2 Global Export Volume by Country (2024)
- 5.1.3 Global Import Value by Country (2024)
- 5.1.4 Global Import Volume by Country (2024)
- 5.1.5 Net Trade Balance by Country (2024)
- 5.2 Export Analysis – Segment
- 5.2.1 Type 1 (HS Code)
- 5.2.2 Type 2 (HS Code)
- 5.2.3 Type 3 (HS Code)
- 5.2.4 Type 4 (HS Code)
- 5.2.5 Type 5 (HS Code)
- 5.3 Import Analysis – Segment
- 5.3.1 Type 1 (HS Code)
- 5.3.2 Type 2 (HS Code)
- 5.3.3 Type 3 (HS Code)
- 5.3.4 Type 4 (HS Code)
- 5.3.5 Type 5 (HS Code)
- 5.4 Average Unit Trade Prices
- 5.4.1 Average Export Price – Segment & Country
- 5.4.2 Average Import Price – Segment & Source Country
- 5.4.3 Price Trends (2024)
- 5.5 Key Trade Route Analysis
- 5.5.1 Trade Route 1
- 5.5.2 Trade Route 2
- 5.5.3 Trade Route 3
- 5.5.4 Trade Route 4
- 5.5.5 Trade Route 5
- 5.6 Trade Policy Impact Assessment
- 5.6.1 US Anti-Dumping & Section 301 Tariffs
- 5.6.2 EU Customs Union Impact
- 5.6.3 Major Free Trade Agreements
- 5.6.4 USMCA Rules of Origin
Note: Trade policy analysis will be included only where relevant to the C Resin market.
Chapter 6. Competitive Landscape & Company Benchmarking
- 6.1 C Resin Market Concentration & Structure
- 6.1.1 Herfindahl-Hirschman Index (HHI) – vs. 2024
- 6.1.2 Tier 1, Tier 2 & Tier 3 Market Structure
- 6.1.3 Global, Regional & Local Player Dynamics
- 6.2 C Resin Market Share Analysis – 2024
- 6.2.1 Global Revenue Share by Company
- 6.2.2 Global Volume Share by Company
- 6.2.3 Regional Revenue Share
- 6.2.4 Market Share Evolution ( vs. 2024)
- 6.2.5 OEM Segment Share by Company
- 6.2.6 Replacement Segment Share by Company
- 6.3 Production/Delivery Capacity & Facility Analysis
- 6.3.1 Global Installed Capacity
- 6.3.2 Capacity Utilization Rates
- 6.3.3 Production/Output Volume
- 6.3.4 Facility Locations & Capacity Map
- 6.3.5 Planned Capacity Additions
- 6.4 C Resin Competitive Benchmarking Matrix
- 6.4.1 Revenue, Volume, CAGR & Profitability Comparison
- 6.4.2 Channel Revenue Mix
- 6.4.3 Geographic Revenue Exposure
- 6.4.4 R&D Intensity
- 6.4.5 Sustainability Maturity
- 6.5 Strategic Developments in C Resin (Last 24 Months)
- 6.5.1 Mergers, Acquisitions & Divestments
- 6.5.2 New C Resin Launches
- 6.5.3 Facility Expansions
- 6.5.4 Strategic Alliances, Joint Ventures & Partnerships
- 6.5.5 Distribution Expansion & Market Entry
- 6.5.6 Sustainability & ESG Initiatives
- 6.6 Competitive Strategy Mapping
- 6.6.1 Leader, Challenger, Follower & Niche Classification
- 6.6.2 Pricing Strategy Comparison
- 6.6.3 Channel Strategy Matrix
Note: Strategic developments are included based on their materiality and the availability of reliable information.
Chapter 7. Global C Resin Market – By Distribution Channel
- 7.1 Segment Overview
- 7.1.1 Volume & Revenue Split by Channel (2024 & 2032)
- 7.1.2 Channel Mix Evolution (2024-2032)
Chapter 8. Regional Market Analysis – Global Overview
- 8.1 Global Regional Overview
- 8.1.1 Regional Volume Share
- 8.1.2 Regional Revenue Share
- 8.1.3 Regional Volume by Region
- 8.1.4 Regional Revenue by Region
- 8.1.5 Regional Forecast Through 2032
- 8.2 Cross-Regional Segment Analysis
- 8.2.1 By Distribution Channel
- 8.2.2 By Brand/Price Tier
Chapter 9. North America C Resin Market
- 9.1 United States
- 9.2 Canada
- 9.3 Mexico
Chapter 10. Europe C Resin Market
- 10.1 Germany
- 10.2 France
- 10.3 Italy
- 10.4 United Kingdom
- 10.5 Spain
- 10.6 Poland
- 10.7 Russia
- 10.8 Netherlands
- 10.9 Belgium
- 10.10 Sweden
- 10.11 Denmark
- 10.12 Norway
- 10.13 Rest of Europe
Chapter 11. Asia Pacific C Resin Market
- 11.1 China
- 11.2 India
- 11.3 Japan
- 11.4 South Korea
- 11.5 Thailand
- 11.6 Indonesia
- 11.7 Vietnam
- 11.8 Malaysia
- 11.9 Australia
- 11.10 Rest of Asia Pacific
Chapter 12. Latin America C Resin Market
- 12.1 Brazil
- 12.2 Argentina
- 12.3 Colombia
- 12.4 Chile
- 12.5 Rest of Latin America
Chapter 13. Middle East C Resin Market
- 13.1 Saudi Arabia
- 13.2 United Arab Emirates
- 13.3 Turkey
- 13.4 Israel
- 13.5 Iran
- 13.6 Rest of the Middle East
Chapter 14. Africa C Resin Market
- 14.1 South Africa
- 14.2 Egypt
- 14.3 Nigeria
- 14.4 Morocco
- 14.5 Rest of Africa
Chapter 15. C Resin Company Profiles
- 15.1 [Company 01]
- 15.1.1 Company Overview
- 15.1.2 Key Management Personnel
- 15.1.3 Products & Services Portfolio
- 15.1.4 Financial Performance
- 15.1.5 Key Market Focus & Geographic Presence
- 15.1.6 Recent Developments & Strategic Initiatives
Note: The company profile list is preliminary and may change based on research findings, market developments, data availability, and client requirements.
Chapter 16. Appendices
- Appendix A – List of Abbreviations & Acronyms
- Appendix B – Industry Classification Code Reference – Full Series
- Appendix C – Production & Capacity Data Tables
- Appendix D – End-Use & Demand Base Tables
- Appendix E – Consumption & Replacement Rate Assumptions
- Appendix F – ASP Reference Tables
- Appendix G – Manufacturing & Facility Database
- Appendix H – Import-Export Data Tables
- Appendix I – Regulatory Summary Tables
- Appendix J – Primary Research Participant List (Anonymized)
- Appendix K – Primary Research Questionnaire Framework
- Appendix L – Data Sources & Bibliography
- Appendix M – Market Size Divergence & Source Comparison
Chapter 17. Research Methodology
- 17.1 Research Framework & Philosophy
- 17.2 Secondary Research – Sources, Hierarchy & Data Extraction
- 17.3 Data Modeling – Bottom-Up & Top-Down Market Sizing
- 17.4 Primary Research – Stakeholder Framework, LOI & Sample Sizes
- 17.5 Forecast Methodology – Regression, Scenario & Sensitivity Analysis
- 17.6 Quality Control – Four-Layer Validation Framework
- 17.7 Limitations & Standard Assumptions
- 17.8 Disclaimer
