
Capsicum Market Overview:
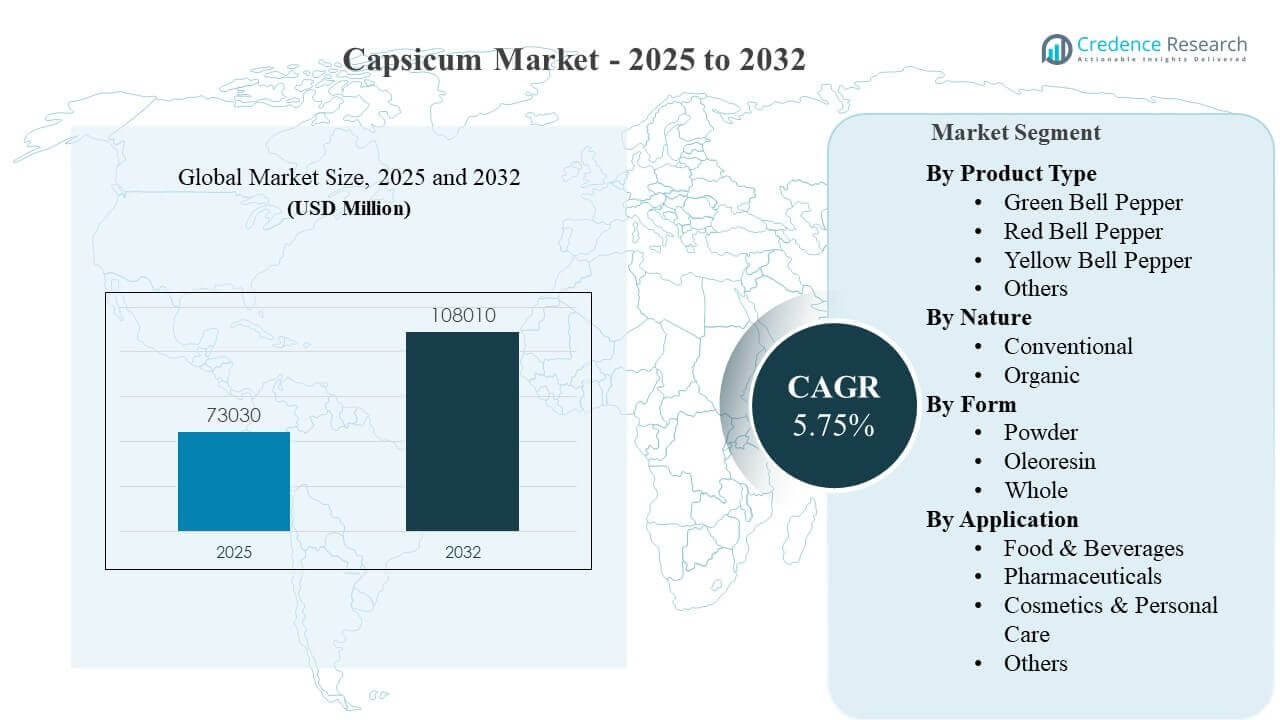
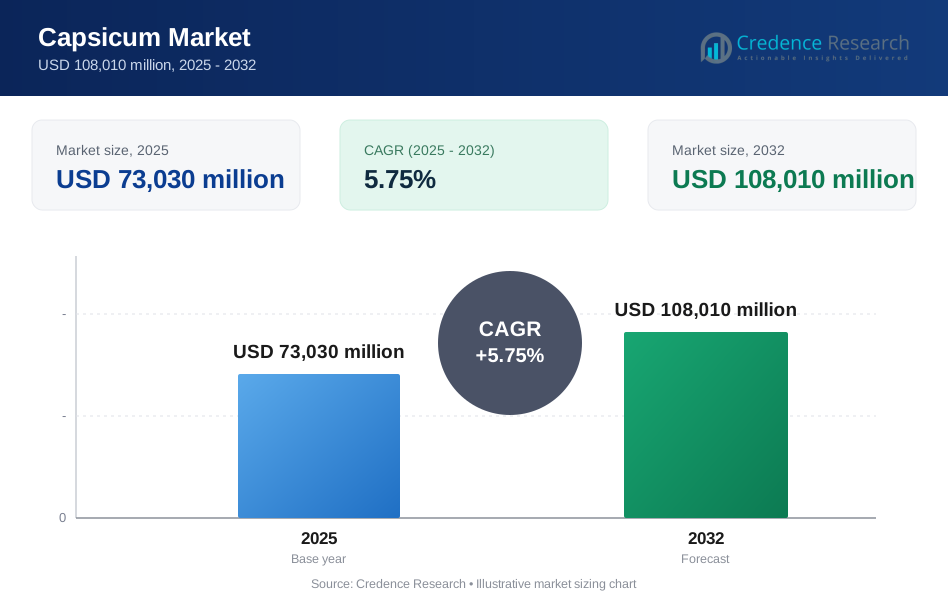
The global Capsicum Market size was estimated at USD 73,030 million in 2025 and is expected to reach USD 108,010 million by 2032, growing at a CAGR of 5.75% from 2025 to 2032. Demand expansion is primarily driven by rising year-round consumption of fresh peppers and increasing use of capsicum as a flavor, color, and functional ingredient in packaged foods and foodservice menus. Broader adoption of protected cultivation and improved cold-chain logistics is also supporting more consistent quality and availability across major importing markets, strengthening category penetration in modern retail and expanding downstream processing use.
| REPORT ATTRIBUTE | DETAILS |
|---|---|
| Historical Period | 2020-2024 |
| Base Year | 2025 |
| Forecast Period | 2026-2032 |
| Capsicum Market Size 2025 | USD 73,030 million |
| Capsicum Market, CAGR | 5.75% |
| Capsicum Market Size 2032 | USD 108,010 million |
Key Market Trends & Insights
- Asia Pacific accounted for the largest regional share of 50.90% in 2025, supported by large-scale consumption and supply depth across key producing countries.
- Europe represented 19.30% of 2025 revenue, reflecting higher-value retail channels and strong protected cultivation footprints.
- Green Bell Pepper held the leading product-type share at 34.60% in 2025, benefiting from cost competitiveness and high-volume culinary usage.
- Conventional capsicum dominated the nature segment with 84.20% share in 2025 due to yield advantages and broader availability across price-sensitive channels.
- Whole form contributed 62.70% share in 2025 as fresh consumption and minimally processed preferences sustained higher throughput in retail and foodservice.
Segment Analysis
Capsicum demand is supported by its broad culinary versatility across home cooking, quick-service restaurants, and packaged food formulations. Fresh peppers remain a staple in salads, stir-fries, sauces, and regional cuisines, while processors leverage capsicum powders and oleoresins to standardize flavor intensity and color across snacks, seasonings, and ready-to-eat products. Growth is also reinforced by expanded protected cultivation and improved post-harvest handling, which help reduce seasonality and quality variability for premium channels.
The market’s structure reflects a strong fresh-first consumption pattern, with value uplift coming from differentiated varieties, consistent size/appearance, and supply assurance programs serving modern retailers. In parallel, ingredient-grade forms such as powders and oleoresins provide stable input formats for manufacturers, enabling year-round production planning. Application breadth across food, personal care, and pharma-adjacent uses supports a diversified demand base, while price sensitivity and supply volatility remain key variables shaping near-term purchasing behavior.
By Product Type Insights
Green Bell Pepper accounted for the largest share of 34.60% in 2025. The segment leads because it is typically positioned as the most cost-accessible bell pepper option, supporting higher household penetration and consistent foodservice usage. Earlier harvest cycles and more stable supply programs improve availability across retail and wholesale channels. Strong suitability for everyday cooking applications also sustains repeat purchases, especially in value-driven markets.
By Nature Insights
Conventional accounted for the largest share of 84.20% in 2025. The segment’s dominance is linked to higher yields, broader acreage coverage, and lower unit costs versus organic cultivation, which supports mass-market distribution. Conventional supply chains are better scaled for year-round demand, enabling consistent quality and pricing for large retailers and foodservice buyers. The segment also benefits from stronger procurement flexibility and faster replenishment cycles across wholesale networks.
By Form Insights
Whole accounted for the largest share of 62.70% in 2025. The segment leads because fresh capsicum is preferred for perceived nutrition retention, texture, and culinary versatility across home and restaurant kitchens. Whole peppers also align well with modern retail merchandising, including convenience packs and mixed-color assortments. Strong cold-chain adoption and improved packaging help reduce wastage and support stable weekly volumes, reinforcing the segment’s throughput leadership.
By Application Insights
Food & Beverages accounted for the largest share of 79.40% in 2025. The segment leads because capsicum is widely consumed as a fresh vegetable and is also a core ingredient for flavor and color in processed foods. Manufacturers value capsicum derivatives for consistent sensory profiles across packaged products, while foodservice operators rely on steady supply for menu continuity. The segment’s scale is further strengthened by growing demand for convenience foods and expanding global cuisine influence.
Capsicum Market Drivers
Expansion of year-round fresh consumption
Fresh capsicum consumption is rising as consumers incorporate peppers into everyday meals for taste, color, and perceived wellness benefits. Increased availability through protected cultivation and improved import logistics is reducing seasonal gaps and stabilizing shelf presence. Modern retail formats are expanding assortments with multi-color packs and convenience options, improving purchase frequency. Foodservice demand also supports steady volumes as peppers remain common across salads, grills, and sauces. These factors collectively strengthen baseline demand across both mature and emerging markets.
- For instance, Nature Fresh Farms says it operates and markets over 2,500 acres of greenhouses across Canada, the United States, and Mexico, ships more than 300 million pounds of fresh produce annually, and uses vertical growing systems that can fit the equivalent of up to 15 acres of field-grown farmland into one acre of greenhouse space, illustrating how controlled-environment production can support steadier year-round shelf supply for greenhouse vegetables, including peppers.
Growth of processed foods and seasoning ecosystems
Capsicum powders and oleoresins are increasingly used to standardize flavor intensity and color in snacks, sauces, ready meals, and seasoning blends. Manufacturers prefer ingredient formats that reduce variability and support predictable production outputs. The rise of convenience food consumption and quick-service restaurant expansion further lifts usage in industrial kitchens. Additionally, product innovation in spicy and ethnic flavor profiles is widening capsicum inclusion across categories. This driver supports both volume growth and value-added processing demand.
- For instance, Synthite’s capsicum oleoresin is marketed in a 0.5 million SHU specification with 2,500-6,000 CU, showing how processors source quantified heat and color inputs rather than relying on the natural variability of raw chili material.
Scaling of protected cultivation and supply assurance programs
Greenhouse and controlled-environment cultivation improves yield stability, appearance consistency, and export-grade quality. These capabilities support premium retail programs that prioritize visual uniformity and reduced shrink. Supply assurance is especially important for large retailers and foodservice chains that require continuous availability across geographies. Producers that diversify sourcing regions and invest in post-harvest infrastructure can better manage climatic disruptions. As supply reliability improves, downstream demand becomes less constrained by seasonality and spot shortages.
Wider non-food utilization and functional positioning
Capsicum-based inputs are used beyond food, including personal care formulations and pharma-adjacent applications that leverage sensory and functional attributes. This broadens the addressable demand base and improves resilience when fresh pricing fluctuates. Ingredient suppliers can capture value through standardized extracts, application support, and customer-specific formulations. As brands emphasize differentiated experiences such as warming or stimulating effects, capsicum-linked ingredients gain relevance in selected niches. These pathways add incremental growth alongside the dominant food channel.
Capsicum Market Challenges
Capsicum markets remain exposed to supply volatility driven by weather variability, pest pressure, and yield swings, which can translate into rapid price movements. Fresh produce categories also face wastage risk due to perishability, requiring strong cold-chain and inventory discipline across distributors and retailers. Quality inconsistency across seasons can reduce buyer confidence, particularly for premium programs that demand uniformity. These issues can pressure margins for growers and create procurement uncertainty for foodservice and retailers.
- For instance, thrips (Scirtothrips dorsalis) infestations in capsicum and chilli cultivation have been documented to cause yield losses of 30–50% in affected plots, while combined insect pest pressure including whitefly (Bemisia tabaci) and aphids can push total crop yield losses to between 50% and 90% depending on agro-climatic conditions.
Regulatory and compliance burdens can raise costs, particularly around pesticide residues, traceability, and certifications demanded by large retailers and import markets. Organic cultivation faces additional complexity from stricter input controls and higher production risk. Logistics costs and border frictions can also impact trade-dependent regions, increasing landed prices and reducing affordability. Competitive intensity among suppliers can lead to price-based competition, especially in commoditized fresh segments with limited differentiation.
Capsicum Market Trends and Opportunities
Premiumization is emerging through variety innovation, mixed-color packs, snack-sized peppers, and convenience-oriented packaging that supports higher per-unit value. Retailers are increasingly optimizing shelf presentation and promoting differentiated pepper offerings, strengthening category value growth beyond basic volume expansion. Protected cultivation and varietal improvements are also enabling more consistent size, sweetness profiles, and color intensity, which supports premium positioning. These trends favor suppliers that can deliver uniform quality at scale with reliable weekly programs.
- For instance, Rijk Zwaan's Ilanga F1 sweet pepper variety developed through the company's dedicated high-tech pepper breeding program for protected and greenhouse cultivation achieves an average yield potential of up to 30 tonnes per acre under controlled growing conditions, a stark contrast to conventional open-field capsicum yields of 20–40 t/ha, providing the volume consistency and uniform sizing that sustained premium retail programs depend on.
B2B opportunities are expanding in ingredient formats as manufacturers seek standardized powders and oleoresins for consistent color and taste delivery. Product developers are also increasing focus on bold, spicy, and global cuisine-inspired flavors, lifting capsicum inclusion across multiple packaged food categories. Investments in post-harvest handling, grading, and cold storage can unlock improved export readiness and reduce shrink. In emerging markets, modern retail growth and urbanization continue to expand the addressable consumer base for fresh peppers.
Regional Insights
North America
North America held an estimated 17.10% share in 2025, supported by strong retail penetration, year-round consumption, and established import flows that stabilize supply. Demand is reinforced by foodservice usage and consumer preference for fresh produce variety. Procurement programs increasingly emphasize quality consistency, packaging formats, and reliable weekly deliveries. Growth is supported by cold-chain capabilities and diversified sourcing across domestic production and imports.
Europe
Europe accounted for an estimated 19.30% share in 2025, reflecting the region’s higher-value retail channels and strong protected cultivation ecosystems. Consistency of size, appearance, and shelf life is a key purchasing driver for large retailers and wholesalers. Trade networks enable broad availability, and premium packaging formats support value uplift. Sustainability and compliance expectations also influence supplier selection and cost structures.
Asia Pacific
Asia Pacific led the market with an estimated 50.90% share in 2025, underpinned by large consumption bases and extensive production across multiple climates. Culinary integration across diverse cuisines sustains high baseline demand, while rapid urbanization supports modern retail expansion. Growth is also supported by increased adoption of protected cultivation in select markets and improvements in logistics. The region’s scale supports both fresh consumption and processing demand for powders and extracts.
Latin America
Latin America represented an estimated 7.80% share in 2025, supported by meaningful production and growing trade participation. Local consumption is supported by culinary usage and expanding urban retail. However, value share remains moderated by pricing variability and uneven cold-chain penetration across markets. Export-oriented programs and investments in post-harvest infrastructure can improve stability and value realization.
Middle East & Africa
Middle East & Africa accounted for an estimated 4.90% share in 2025, with demand shaped by import reliance, retail expansion in key hubs, and rising foodservice activity. Climatic constraints and supply variability make continuity and shelf-life management important considerations. Premium demand exists in higher-income markets, while affordability remains a constraint in price-sensitive areas. Continued investments in logistics and controlled-environment cultivation can strengthen supply reliability.
Competitive Landscape
Competition is shaped by supply assurance capabilities, buyer relationships with large retailers and foodservice accounts, and differentiation through quality consistency, packaging formats, and varietal programs. Grower-shippers and distributors compete on year-round availability, grading standards, and logistics execution that reduce shrink. Ingredient-oriented suppliers differentiate through standardized inputs, application expertise, and dependable specifications for industrial buyers. Strategic focus increasingly includes protected cultivation, diversification of sourcing regions, and targeted expansion into value-added formats.
Lipman Family Farms is positioned as a large-scale grower-shipper that benefits from diversified production programs and strong retail relationships in fresh produce categories. The company’s approach typically emphasizes supply continuity, quality control, and retail-ready packaging formats aligned with modern merchandising needs. Continued innovation in varieties and protected cultivation trials can support differentiation in a competitive fresh market. Program reliability and operational scale can be leveraged to secure repeat contracts with retailers and foodservice buyers.
The industry research and growth report includes detailed analyses of the competitive landscape of the market and information about key companies, including:
- Lipman Family Farms
- Levarht
- J&J Family of Farms Corporate
- Pero Family Farms Inc.
- Oakes Farms
- Southern Paprika Limited
- Fruit Farm Group
- GK Fresh Greens
- Titan Farms Inc.
- Lewis Taylor Farms, Inc.
- Neo Foods
- Mane Kancor Ingredients
- Lange
- BD Agro Foods
Qualitative and quantitative analysis of companies has been conducted to help clients understand the wider business environment as well as the strengths and weaknesses of key industry players. Data is qualitatively analyzed to categorize companies as pure play, category-focused, industry-focused, and diversified; it is quantitatively analyzed to categorize companies as dominant, leading, strong, tentative, and weak.
Recent Developments
- In January 2026, WorldVeg announced that its pepper breeding program released 37 new chili and sweet pepper varieties during 2025, making it the program’s strongest year on record. This is a meaningful new-product update for the capsicum market because it expands the pipeline of commercially relevant pepper varieties for growers across multiple regions.
- In March 2026, Rijk Zwaan India launched a new sweet pepper e-learning course in Hindi aimed at supporting growers in India. While this is not an acquisition, it reflects fresh commercial activity around sweet pepper cultivation, grower engagement, and market development in an important capsicum-producing country.
- In June 2025, ASP launched Defender LE, a new line of OC sprays, inert training sprays, and post-exposure decontamination products. Since OC products are based on oleoresin capsicum, this launch highlights downstream commercialization tied to the broader capsicum and capsaicin value chain.
- In March 2025, the Cornelio premium pepper project under Valfrutta Fresco and the Alegra Group reported growth through new varieties, increased production, and targeted marketing strategies. This update signals ongoing product development and brand expansion within the sweet pepper segment of the capsicum market.
Report Scope
| Report Attribute | Details |
| Market size value in 2025 | USD 73030 million |
| Revenue forecast in 2032 | USD 108010 million |
| Growth rate (CAGR) | 5.75% (2025–2032) |
| Base year | 2025 |
| Forecast period | 2026-2032 |
| Quantitative units | USD million |
| Segments covered | By Product Type; By Nature; By Form; By Application |
| Regional scope | North America, Europe, Asia Pacific, Latin America, Middle East & Africa |
| Key companies profiled | Lipman Family Farms; Levarht; J&J Family of Farms Corporate; Pero Family Farms Inc.; Oakes Farms; Southern Paprika Limited; Fruit Farm Group; GK Fresh Greens; Titan Farms Inc.; Lewis Taylor Farms, Inc.; Neo Foods; Mane Kancor Ingredients; Lange; BD Agro Foods |
| No. of Pages | 326 |
Segmentation
By Product Type
- Green Bell Pepper
- Red Bell Pepper
- Yellow Bell Pepper
- Others
By Nature
- Conventional
- Organic
By Form
- Powder
- Oleoresin
- Whole
By Application
- Food & Beverages
- Pharmaceuticals
- Cosmetics & Personal Care
- Others
By Region
- North America
- U.S.
- Canada
- Mexico
- Europe
- Germany
- France
- U.K.
- Italy
- Spain
- Rest of Europe
- Asia Pacific
- China
- Japan
- India
- South Korea
- South-east Asia
- Rest of Asia Pacific
- Latin America
- Brazil
- Argentina
- Rest of Latin America
- Middle East & Africa
- GCC Countries
- South Africa
- Rest of the Middle East and Africa
Request a Free Sample
Fill in your details and we'll send you a free sample report.
- Sample data tables & charts
- Research methodology
Need a Custom Version of This Report?
Tailor the scope, geography, or segments to your exact requirements.
- Custom geography or segment scope
- Direct access to our analyst team
Frequently Asked Questions
What is the market size of the Capsicum Market in 2025 and its forecast for 2032?
What is the CAGR of the Capsicum Market during 2025–2032?
Which segment is the largest in the Capsicum Market?
What factors are driving growth in the Capsicum Market?
Who are the leading companies in the Capsicum Market?
Which region leads the Capsicum Market in 2025?
Table of Content
Chapter 1. Report Introduction
- 1.1 Report Description & Purpose
- 1.1.1 Report Title & Market Definition
- 1.1.2 Unique Selling Propositions (USP) & Key Differentiators
- 1.1.3 Value Proposition for Stakeholders
- 1.2 Research Objectives
- 1.2.1 Market Sizing Objectives (Volume & Revenue)
- 1.2.2 Segmentation Objectives
- 1.2.3 Competitive Intelligence Objectives
- 1.2.4 Forecast & Scenario Objectives
- 1.3 Report Scope
- 1.3.1 Capsicum Scope – Types & Subtypes Covered
- 1.3.2 Geographic Scope – Regions & Countries Covered
- 1.3.3 Historical Period, Base Year & Forecast Period (2025; forecast to 2032)
- 1.3.4 Inclusions & Exclusions
- 1.4 HS Code & Classification Framework
- 1.5 Currency, Units & Pricing Basis
- 1.6 Target Stakeholders
- 1.7 Limitations & Assumptions
Chapter 2. Executive Summary
- 2.1 Global Capsicum Market Snapshot
- 2.1.1 Market Size – Historical (2025) & Forecast (2025-2032) (2025: USD 73,030 million → 2032: USD 108,010 million)
- 2.1.2 Volume & Revenue – Global Totals
- 2.1.3 Key Market Highlights – Top Five Facts
- 2.2 Capsicum Market Segmentation Snapshot
- 2.2.1 Market Split by Region – 2025 vs. 2032
- 2.3 Competitive Snapshot
- 2.3.1 Top 10 Players by Revenue Share – 2025
- 2.3.2 Top 10 Players by Volume Share – 2025
- 2.3.3 Recent Strategic Developments (18-Month Summary)
- 2.4 Key Investment Highlights & Strategic Conclusions
Chapter 3. Capsicum Market Dynamics & Industry Analysis
- 3.1 Market Overview & Context
- 3.1.1 Capsicum Market Position in the Broader Automotive Value Chain
- 3.1.2 OEM vs. Replacement Market Dynamics
- 3.1.3 Market Maturity & Development Stage by Region
- 3.2 Capsicum Market Drivers
- 3.3 Capsicum Market Restraints & Challenges
- 3.4 Capsicum Market Opportunities
- 3.5 Porter's Five Forces Analysis
- 3.5.1 Threat of New Entrants
- 3.5.2 Bargaining Power of Suppliers
- 3.5.3 Bargaining Power of Buyers
- 3.5.4 Threat of Substitutes
- 3.5.5 Competitive Rivalry – Intensity Assessment
- 3.6 Capsicum Value Chain Analysis
- 3.6.1 Upstream – Raw Material/Input Suppliers
- 3.6.1.1 Raw Material/Input 1
- 3.6.1.2 Raw Material/Input 2
- 3.6.1.3 Raw Material/Input 3
- 3.6.2 Midstream – Production/Manufacturing/Service Delivery
- 3.6.2.1 Production/Process Overview
- 3.6.2.2 Key Facility Locations & Capacity by Manufacturer
- 3.6.3 Downstream – Distribution & End Consumer
- 3.6.3.1 Primary Channel – B2B/OEM
- 3.6.3.2 Secondary Channels – Dealer, Retail, Online, Direct
- 3.6.4 Value Chain Profitability Analysis
- 3.6.1 Upstream – Raw Material/Input Suppliers
- 3.7 PESTEL Analysis
- 3.7.1 Political Factors
- 3.7.2 Economic Factors
- 3.7.3 Social Factors
- 3.7.4 Technological Factors
- 3.7.5 Environmental Factors
- 3.7.6 Legal Factors
- 3.8 Capsicum Supply Chain Analysis
- 3.8.1 Raw Material/Input Supply Risk Assessment
- 3.8.2 Manufacturing Concentration Risk (Geographic Exposure)
- 3.8.3 Trade Disruption Impact Analysis
- 3.9 Regulatory & Policy Landscape
Note: The regulatory and policy landscape section covers regulations based on their applicability to the market, Capsicum category, geography, and scope of the study. Only regulatory frameworks with a material impact on operations, compliance, trade, sustainability, or market access are analyzed in detail.
Chapter 4. Key Investment Pockets & Opportunity Analysis
- 4.1 Capsicum Market Attractiveness Analysis
- 4.1.1 By Region – Investment Attractiveness Matrix (Volume × CAGR)
- 4.2 Absolute Revenue Growth Opportunity
- 4.2.1 By Region – Absolute USD Growth Through 2032
- 4.3 Incremental Volume Opportunity
- 4.3.1 By Region – Incremental Volume Through 2032
- 4.3.2 Segment – Incremental Volume
- 4.4 Emerging Submarket Opportunity Deep Dive (Subject to Applicability)
- 4.5 Emerging Market Opportunity Scorecards
- 4.5.1 United States
- 4.5.2 Europe
- 4.5.3 Asia
- 4.5.4 Middle East & Africa
Note: Emerging Market Opportunity Scorecards will be included based on relevance and strategic importance. Regions listed are indicative and may vary depending on data availability and market dynamics.
Chapter 5. Capsicum Import-Export Analysis & Trade Flows
- 5.1 Global Trade Overview
- 5.1.1 Global Export Value by Country (2025)
- 5.1.2 Global Export Volume by Country (2025)
- 5.1.3 Global Import Value by Country (2025)
- 5.1.4 Global Import Volume by Country (2025)
- 5.1.5 Net Trade Balance by Country (2025)
- 5.2 Export Analysis – Segment
- 5.2.1 Type 1 (HS Code)
- 5.2.2 Type 2 (HS Code)
- 5.2.3 Type 3 (HS Code)
- 5.2.4 Type 4 (HS Code)
- 5.2.5 Type 5 (HS Code)
- 5.3 Import Analysis – Segment
- 5.3.1 Type 1 (HS Code)
- 5.3.2 Type 2 (HS Code)
- 5.3.3 Type 3 (HS Code)
- 5.3.4 Type 4 (HS Code)
- 5.3.5 Type 5 (HS Code)
- 5.4 Average Unit Trade Prices
- 5.4.1 Average Export Price – Segment & Country
- 5.4.2 Average Import Price – Segment & Source Country
- 5.4.3 Price Trends (2025)
- 5.5 Key Trade Route Analysis
- 5.5.1 Trade Route 1
- 5.5.2 Trade Route 2
- 5.5.3 Trade Route 3
- 5.5.4 Trade Route 4
- 5.5.5 Trade Route 5
- 5.6 Trade Policy Impact Assessment
- 5.6.1 US Anti-Dumping & Section 301 Tariffs
- 5.6.2 EU Customs Union Impact
- 5.6.3 Major Free Trade Agreements
- 5.6.4 USMCA Rules of Origin
Note: Trade policy analysis will be included only where relevant to the Capsicum market.
Chapter 6. Competitive Landscape & Company Benchmarking
- 6.1 Capsicum Market Concentration & Structure
- 6.1.1 Herfindahl-Hirschman Index (HHI) – vs. 2025
- 6.1.2 Tier 1, Tier 2 & Tier 3 Market Structure
- 6.1.3 Global, Regional & Local Player Dynamics
- 6.2 Capsicum Market Share Analysis – 2025
- 6.2.1 Global Revenue Share by Company
- 6.2.2 Global Volume Share by Company
- 6.2.3 Regional Revenue Share
- 6.2.4 Market Share Evolution ( vs. 2025)
- 6.2.5 OEM Segment Share by Company
- 6.2.6 Replacement Segment Share by Company
- 6.3 Production/Delivery Capacity & Facility Analysis
- 6.3.1 Global Installed Capacity
- 6.3.2 Capacity Utilization Rates
- 6.3.3 Production/Output Volume
- 6.3.4 Facility Locations & Capacity Map
- 6.3.5 Planned Capacity Additions
- 6.4 Capsicum Competitive Benchmarking Matrix
- 6.4.1 Revenue, Volume, CAGR & Profitability Comparison
- 6.4.2 Channel Revenue Mix
- 6.4.3 Geographic Revenue Exposure
- 6.4.4 R&D Intensity
- 6.4.5 Sustainability Maturity
- 6.5 Strategic Developments in Capsicum (Last 24 Months)
- 6.5.1 Mergers, Acquisitions & Divestments
- 6.5.2 New Capsicum Launches
- 6.5.3 Facility Expansions
- 6.5.4 Strategic Alliances, Joint Ventures & Partnerships
- 6.5.5 Distribution Expansion & Market Entry
- 6.5.6 Sustainability & ESG Initiatives
- 6.6 Competitive Strategy Mapping
- 6.6.1 Leader, Challenger, Follower & Niche Classification
- 6.6.2 Pricing Strategy Comparison
- 6.6.3 Channel Strategy Matrix
Note: Strategic developments are included based on their materiality and the availability of reliable information.
Chapter 7. Global Capsicum Market – By Distribution Channel
- 7.1 Segment Overview
- 7.1.1 Volume & Revenue Split by Channel (2025 & 2032)
- 7.1.2 Channel Mix Evolution (2025-2032)
Chapter 8. Regional Market Analysis – Global Overview
- 8.1 Global Regional Overview
- 8.1.1 Regional Volume Share
- 8.1.2 Regional Revenue Share
- 8.1.3 Regional Volume by Region
- 8.1.4 Regional Revenue by Region
- 8.1.5 Regional Forecast Through 2032
- 8.2 Cross-Regional Segment Analysis
- 8.2.1 By Distribution Channel
- 8.2.2 By Brand/Price Tier
Chapter 9. North America Capsicum Market
- 9.1 United States
- 9.2 Canada
- 9.3 Mexico
Chapter 10. Europe Capsicum Market
- 10.1 Germany
- 10.2 France
- 10.3 Italy
- 10.4 United Kingdom
- 10.5 Spain
- 10.6 Poland
- 10.7 Russia
- 10.8 Netherlands
- 10.9 Belgium
- 10.10 Sweden
- 10.11 Denmark
- 10.12 Norway
- 10.13 Rest of Europe
Chapter 11. Asia Pacific Capsicum Market
- 11.1 China
- 11.2 India
- 11.3 Japan
- 11.4 South Korea
- 11.5 Thailand
- 11.6 Indonesia
- 11.7 Vietnam
- 11.8 Malaysia
- 11.9 Australia
- 11.10 Rest of Asia Pacific
Chapter 12. Latin America Capsicum Market
- 12.1 Brazil
- 12.2 Argentina
- 12.3 Colombia
- 12.4 Chile
- 12.5 Rest of Latin America
Chapter 13. Middle East Capsicum Market
- 13.1 Saudi Arabia
- 13.2 United Arab Emirates
- 13.3 Turkey
- 13.4 Israel
- 13.5 Iran
- 13.6 Rest of the Middle East
Chapter 14. Africa Capsicum Market
- 14.1 South Africa
- 14.2 Egypt
- 14.3 Nigeria
- 14.4 Morocco
- 14.5 Rest of Africa
Chapter 15. Capsicum Company Profiles
- 15.1 [Company 01]
- 15.1.1 Company Overview
- 15.1.2 Key Management Personnel
- 15.1.3 Products & Services Portfolio
- 15.1.4 Financial Performance
- 15.1.5 Key Market Focus & Geographic Presence
- 15.1.6 Recent Developments & Strategic Initiatives
Note: The company profile list is preliminary and may change based on research findings, market developments, data availability, and client requirements.
Chapter 16. Appendices
- Appendix A – List of Abbreviations & Acronyms
- Appendix B – Industry Classification Code Reference – Full Series
- Appendix C – Production & Capacity Data Tables
- Appendix D – End-Use & Demand Base Tables
- Appendix E – Consumption & Replacement Rate Assumptions
- Appendix F – ASP Reference Tables
- Appendix G – Manufacturing & Facility Database
- Appendix H – Import-Export Data Tables
- Appendix I – Regulatory Summary Tables
- Appendix J – Primary Research Participant List (Anonymized)
- Appendix K – Primary Research Questionnaire Framework
- Appendix L – Data Sources & Bibliography
- Appendix M – Market Size Divergence & Source Comparison
Chapter 17. Research Methodology
- 17.1 Research Framework & Philosophy
- 17.2 Secondary Research – Sources, Hierarchy & Data Extraction
- 17.3 Data Modeling – Bottom-Up & Top-Down Market Sizing
- 17.4 Primary Research – Stakeholder Framework, LOI & Sample Sizes
- 17.5 Forecast Methodology – Regression, Scenario & Sensitivity Analysis
- 17.6 Quality Control – Four-Layer Validation Framework
- 17.7 Limitations & Standard Assumptions
- 17.8 Disclaimer
