Market Overview
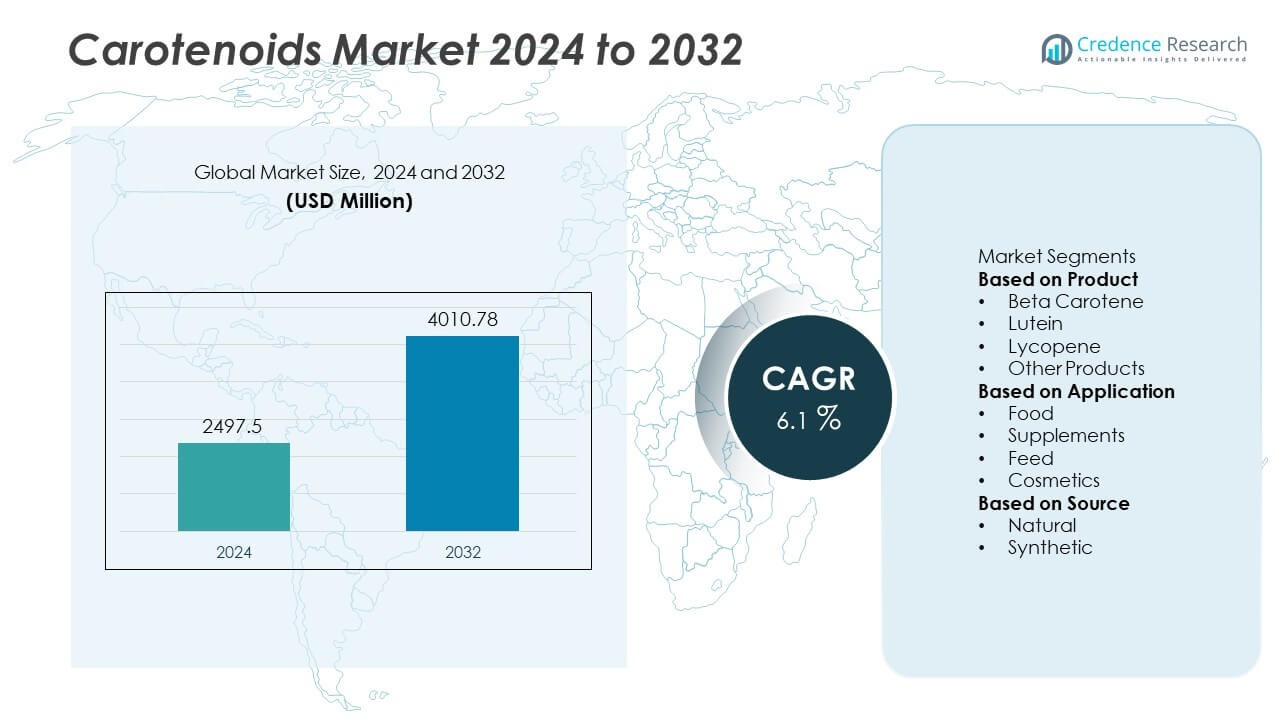
The Carotenoids Market reached USD 2,497.5 million in 2024 and is projected to rise to USD 4,010.78 million by 2032, registering a CAGR of 6.1% during the forecast period.
| REPORT ATTRIBUTE |
DETAILS |
| Historical Period |
2020-2023 |
| Base Year |
2024 |
| Forecast Period |
2025-2032 |
| Carotenoids Market Size 2024 |
USD 2,497.5 Million |
| Carotenoids Market, CAGR |
6.1% |
| Carotenoids Market Size 2032 |
USD 4,010.78 Million |
The Carotenoids market is driven by major players such as BioExtract, Kemin Industries, NHU, Allied Biotech Corporation, Cyanotech Corporation, Lycored, Divi’s Nutraceuticals, BASF, Döhler GmbH, and Sensient Colors LLC. These companies strengthen their positions through advanced extraction methods, microalgae cultivation, and clean-label ingredient development to meet rising demand across food, supplements, feed, and cosmetics. Asia Pacific leads the market with a 35% share due to large-scale food production, expanding aquaculture, and growing supplement consumption. North America follows with a 31% share driven by strong nutraceutical demand, while Europe holds a 29% share supported by strict clean-label regulations and high adoption of natural colorants.
Market Insights
- The Carotenoids market reached USD 2,497.5 million in 2024 and will grow at a CAGR of 6.1% through 2032.
- Demand rises as natural colorants replace synthetic dyes, with beta-carotene leading the product segment at 34% and natural sources holding a 56% share.
- Trends strengthen around algae-derived carotenoids, microencapsulation technologies, and expanding use in supplements, cosmetics, and feed, with the feed segment dominating at 41%.
- Competition grows among BioExtract, Kemin, NHU, Allied Biotech, Cyanotech, Lycored, BASF, Döhler, Divi’s, and Sensient as they invest in natural extraction, fermentation, and sustainable production despite restraints tied to high extraction costs and regulatory variations.
- Asia Pacific leads with a 35% share, followed by North America at 31%, Europe at 29%, Latin America at 3%, and the Middle East & Africa at 2%, supported by strong demand across food, supplements, and aquaculture feed applications.
Access crucial information at unmatched prices!
Request your sample report today & start making informed decisions powered by Credence Research Inc.!
Download Sample
Market Segmentation Analysis:
By Product
Beta-carotene leads the Carotenoids market with a 34% share due to its strong demand in food fortification, dietary supplements, and functional beverages. Its role as a provitamin A source and antioxidant supports high usage across health-focused applications. Lutein holds a growing share as eye-health awareness increases, while lycopene expands steadily for its cardiovascular and skin-health benefits. Other carotenoids, including astaxanthin and zeaxanthin, gain traction in premium nutrition and cosmetic formulations. Rising consumer interest in natural antioxidants and preventive health solutions drives sustained adoption across all product categories.
- For instance, BASF produces a range of beta-carotene formulations, such as Lucarotin 10% or 20% products, and provides detailed stability data for these additives.
By Application
The feed segment dominates the market with a 41% share, driven by high usage in poultry, aquaculture, and livestock nutrition to enhance pigmentation, immunity, and overall health performance. Food applications follow closely as carotenoids serve as natural colorants in bakery, dairy, beverages, and processed foods. Supplements show robust growth as consumers seek antioxidant and eye-health benefits through lutein, astaxanthin, and beta-carotene formulations. Cosmetic applications continue to expand due to increasing adoption of carotenoid-based anti-aging and skin-brightening products. Rising demand for natural additives across industries supports strong market expansion.
- For instance, Kemin Industries uses advanced manufacturing technology for its carotenoid products, such as ORO GLO® from marigolds and KEM GLO™ from paprika, to ensure uniform distribution of pigments in poultry feed for consistent egg yolk and broiler skin coloration.
By Source
Natural carotenoids dominate with a 56% share, supported by strong consumer preference for plant-derived and algae-extracted ingredients that meet clean-label and organic certification standards. Increasing adoption of natural food colors and rising awareness of chemical-free supplements further strengthen demand. Synthetic carotenoids maintain relevance due to cost efficiency and consistent supply for large-scale feed and food manufacturing. However, regulatory support for natural colorants and expanding microalgae cultivation accelerate the shift toward bio-based production. Growing interest in sustainability and natural wellness keeps natural carotenoids at the forefront of market growth.
Key Growth Drivers
Rising Demand for Natural Colorants and Clean-Label Ingredients
The market expands as food and beverage manufacturers replace synthetic dyes with natural carotenoid-based colorants to meet clean-label and regulatory expectations. Beta-carotene, lutein, and astaxanthin gain strong traction due to their stability, safety profile, and versatility across bakery, beverages, dairy, and processed foods. Consumers increasingly favor plant-derived additives that align with natural, organic, and chemical-free product claims. Growing awareness of health benefits linked to carotenoids further accelerates adoption in functional foods. Supportive regulations across major markets strengthen the shift toward natural ingredients, driving sustained demand for carotenoid formulations.
- For instance, Lycored increased its tomato-derived lycopene output through a patented extraction unit, an investment that enhanced efficiency and improved the quality and content of their lycopene oleoresin, a process suitable for continuous, large-scale production.
Growing Use in Dietary Supplements and Preventive Health Products
Carotenoids play a vital role in eye health, immunity, and antioxidant protection, fueling significant growth in the supplements category. Lutein and zeaxanthin see rising inclusion in vision-support products, while beta-carotene and lycopene gain demand for immune and cardiovascular health. The shift toward preventive healthcare and rising intake of nutraceuticals drive strong market expansion. Aging populations across Europe, North America, and Asia increase demand for targeted formulations. Manufacturers invest in microencapsulation technologies to enhance bioavailability, supporting broader supplement applications and long-term market growth.
- For instance, OmniActive Technologies offers Lutemax® 2020 as a patented, clinically studied extract that provides all three macular carotenoids (lutein, RR-zeaxanthin, and RS [meso]-zeaxanthin) in a 5:1 ratio, similar to what is found in the natural diet.
Expanding Adoption in Animal Feed and Aquaculture
High use of carotenoids in animal feed strengthens market growth as producers prioritize pigmentation and immune support in poultry, aquaculture, and livestock. Astaxanthin and canthaxanthin remain essential for enhancing egg yolk color, salmon flesh pigmentation, and overall health performance. Rising global demand for premium poultry and seafood increases reliance on carotenoid-enriched feed formulations. Feed producers adopt carotenoids to improve antioxidant status and reduce stress-related losses. Growing investments in aquaculture and livestock production in Asia and Latin America further boost consumption.
Key Trends & Opportunities
Growth of Algae-Derived and Fermentation-Based Carotenoids
Microalgae cultivation and precision fermentation create new opportunities for sustainable, high-purity carotenoid production. Algae-derived astaxanthin, beta-carotene, and lutein gain traction due to their natural origin and superior antioxidant properties. Fermentation-based manufacturing offers consistent quality and reduced environmental impact compared to synthetic extraction. Companies invest in biotechnology platforms to scale natural carotenoid production and serve growing demand across supplements, food, and cosmetics. This trend aligns with sustainability commitments and promotes innovation in bio-based production technologies.
- For instance, Cyanotech expanded its astaxanthin production capacity at its Kona microalgae farm by converting spirulina culture ponds to astaxanthin culture ponds. The facility uses both open raceway ponds and closed systems in a multistage process to grow Haematococcus pluvialis and induce astaxanthin accumulation.
Increasing Use in Beauty, Skincare, and Anti-Aging Products
Carotenoids gain strong momentum in cosmetics as consumers seek natural antioxidants that support skin protection, radiance, and anti-aging benefits. Lycopene, beta-carotene, and astaxanthin are incorporated into serums, creams, and oral beauty supplements for their protective and brightening properties. Rising popularity of nutricosmetics boosts demand for ingestible carotenoid-based products. The trend is reinforced by the shift toward natural, chemical-free skincare. Manufacturers expand R&D to develop stable carotenoid formulations suitable for topical and ingestible beauty applications.
- For instance, Givaudan expanded its skincare actives line and utilizes a microencapsulation process to improve the stability of sensitive ingredients.
Key Challenges
High Production Costs and Complex Extraction Processes
Producing natural carotenoids requires advanced extraction, purification, and stabilization technologies, leading to high production costs. Microalgae cultivation and fermentation-based methods demand significant investment in equipment, controlled environments, and skilled technical teams. These factors increase final product prices and limit penetration in cost-sensitive markets such as feed and emerging economies. Manufacturers must optimize processes to improve yield and reduce costs. Balancing price competitiveness with natural ingredient quality remains a key challenge for industry players.
Regulatory Variations and Quality Standard Requirements
Differing regulatory frameworks across countries complicate product approval, labeling, and market entry for carotenoid-based formulations. Natural and synthetic carotenoids face varying safety standards, permitted dosage limits, and colorant classifications. Manufacturers must navigate region-specific compliance requirements to ensure consistent product quality. Stricter regulations for food additives and supplements increase documentation burden and extend approval timelines. Ensuring alignment with evolving global standards continues to challenge producers, particularly those expanding into new markets.
Regional Analysis
North America
North America holds a 31% share of the Carotenoids market, driven by strong demand in dietary supplements, fortified foods, and natural colorant applications. Consumers in the United States and Canada increasingly prefer clean-label, antioxidant-rich formulations, boosting uptake of beta-carotene, lutein, and astaxanthin. Food manufacturers replace synthetic dyes with natural carotenoids to meet regulatory and consumer expectations. Supplement brands expand eye-health and immunity-focused products, further supporting growth. Advanced extraction technologies and strong retail presence for nutraceuticals enhance regional adoption. Robust R&D investments and rising demand for natural ingredients continue to strengthen the region’s leadership.
Europe
Europe accounts for a 29% share, supported by strict regulations favoring natural colorants and high consumer awareness of preventive health. Countries such as Germany, France, and the United Kingdom show strong adoption across food, supplements, and cosmetics. The region’s aging population drives demand for lutein and zeaxanthin in vision-support supplements. Manufacturers leverage advanced microencapsulation and algae cultivation technologies to improve carotenoid stability. Clean-label trends remain a major growth enabler as brands shift from synthetic to bio-based colorants. Strong regulatory backing for natural additives enhances long-term expansion across European markets.
Asia Pacific
Asia Pacific leads the global market with a 35% share, driven by rising food production, growing supplement usage, and expanding aquaculture. China, India, Japan, and South Korea adopt carotenoids rapidly across feed, food coloring, and nutraceutical applications. High demand for poultry pigmentation and aquaculture enrichment boosts astaxanthin and canthaxanthin consumption. Growing middle-class health awareness drives strong uptake of beta-carotene and lutein supplements. Regional investments in microalgae farming and fermentation technologies support scalable natural carotenoid production. Rapid urbanization and evolving dietary patterns make Asia Pacific the most dynamic growth hub.
Latin America
Latin America holds a 3% share, supported by increasing carotenoid use in poultry, aquaculture, and food coloring applications. Brazil and Mexico lead adoption as demand rises for natural additives in beverages, dairy, and processed foods. The feed industry uses carotenoids to improve pigmentation and animal health, boosting astaxanthin and beta-carotene usage. Growing consumer interest in immunity and eye-health supplements supports broader market expansion. Limited local manufacturing encourages imports, but investments in regional algae production are emerging. Gradual regulatory improvements and rising supplement consumption support steady market growth.
Middle East & Africa
The Middle East & Africa region accounts for a 2% share, driven by gradual adoption of natural colorants in food processing and rising interest in nutritional supplements. Countries such as the UAE, Saudi Arabia, and South Africa show increasing demand for lutein, beta-carotene, and astaxanthin across food and feed industries. Expanding poultry and aquaculture sectors strengthen carotenoid usage for pigmentation and health performance. Consumer interest in antioxidant-rich supplements is growing as awareness of preventive wellness increases. Limited domestic production creates opportunities for international suppliers. Improving retail distribution and health-focused product launches support long-term regional growth.
Market Segmentations:
By Product
- Beta Carotene
- Lutein
- Lycopene
- Other Products
By Application
- Food
- Supplements
- Feed
- Cosmetics
By Source
By Geography
- North America
- Europe
- Germany
- France
- U.K.
- Italy
- Spain
- Rest of Europe
- Asia Pacific
- China
- Japan
- India
- South Korea
- South-east Asia
- Rest of Asia Pacific
- Latin America
- Brazil
- Argentina
- Rest of Latin America
- Middle East & Africa
- GCC Countries
- South Africa
- Rest of the Middle East and Africa
Competitive Landscape
The competitive landscape or analysis of the Carotenoids market features leading players such as BioExtract, Kemin Industries, NHU, Allied Biotech Corporation, Cyanotech Corporation, Lycored, Divi’s Nutraceuticals, BASF, Döhler GmbH, and Sensient Colors LLC. These companies compete through advancements in natural extraction, microalgae cultivation, fermentation technologies, and microencapsulation techniques that improve stability and bioavailability. Market leaders expand product portfolios across beta-carotene, lutein, lycopene, and astaxanthin to serve food, supplements, feed, and cosmetic applications. Strategic partnerships with food manufacturers and nutraceutical brands help strengthen global distribution. Sustainability initiatives, including algae-based production and clean-label colorants, further differentiate key competitors. Companies invest in R&D to enhance purity, improve antioxidant performance, and meet stringent regulatory requirements. Growing demand for natural colorants and wellness-driven ingredients intensifies competition, encouraging continuous innovation and capacity expansion across major regions.
Key Player Analysis
- BioExtract
- Kemin Industries, Inc.
- NHU
- Allied Biotech Corporation
- Cyanotech Corporation
- Lycored
- Divi’s Nutraceuticals
- BASF
- Döhler GmbH
- Sensient Colors LLC
Recent Developments
- In October 2025, Lycored debuted its new VAS (Versatile Application Solution) micro-encapsulated starch beadlet technology portfolio (including lycopene, beta-carotene, lutein) at SupplySide Global.
- In May 2025, Kemin Industries, Inc. presented a clinical study for FloraGLO® Lutein showing a 14% increase in macular pigment density in adolescents aged 8-16 over 6 months.
- In May 2025, Lycored Ltd. achieved a positive scientific opinion from the European Food Safety Authority (EFSA) for its Lumenato™ yellow-tomato derived carotenoid ingredient, expanding use for nutricosmetic applications.
Shape Your Report to Specific Countries or Regions & Enjoy 30% Off!
Report Coverage
The research report offers an in-depth analysis based on Product, Application, Source and Geography. It details leading market players, providing an overview of their business, product offerings, investments, revenue streams, and key applications. Additionally, the report includes insights into the competitive environment, SWOT analysis, current market trends, as well as the primary drivers and constraints. Furthermore, it discusses various factors that have driven market expansion in recent years. The report also explores market dynamics, regulatory scenarios, and technological advancements that are shaping the industry. It assesses the impact of external factors and global economic changes on market growth. Lastly, it provides strategic recommendations for new entrants and established companies to navigate the complexities of the market.
Future Outlook
- Demand for natural colorants will rise as clean-label adoption strengthens across foods and beverages.
- Microalgae-based carotenoid production will expand with improved cultivation and extraction methods.
- Supplement usage will grow as consumers prioritize eye health, immunity, and antioxidant support.
- Carotenoid applications in cosmetics will increase due to rising demand for natural anti-aging ingredients.
- Feed-grade carotenoids will see strong expansion in poultry and aquaculture to enhance pigmentation and animal health.
- Fermentation-based production will gain momentum as companies pursue sustainable and scalable alternatives.
- Advanced microencapsulation technologies will improve carotenoid stability and bioavailability.
- Regulatory support for natural ingredients will accelerate adoption across major markets.
- Demand for personalized nutrition will drive development of targeted carotenoid formulations.
- Strategic partnerships between food, nutraceutical, and algae biotechnology firms will boost innovation and global market reach.


