
Cheek Augmentation Market Overview:
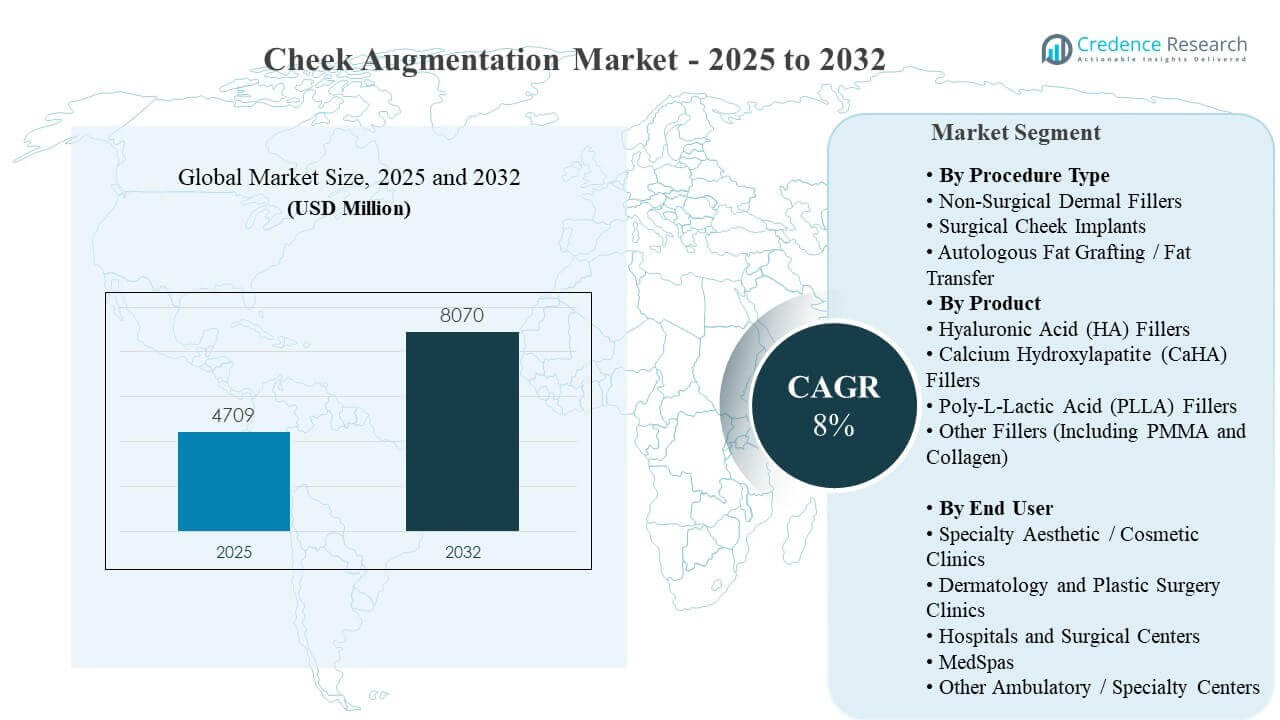
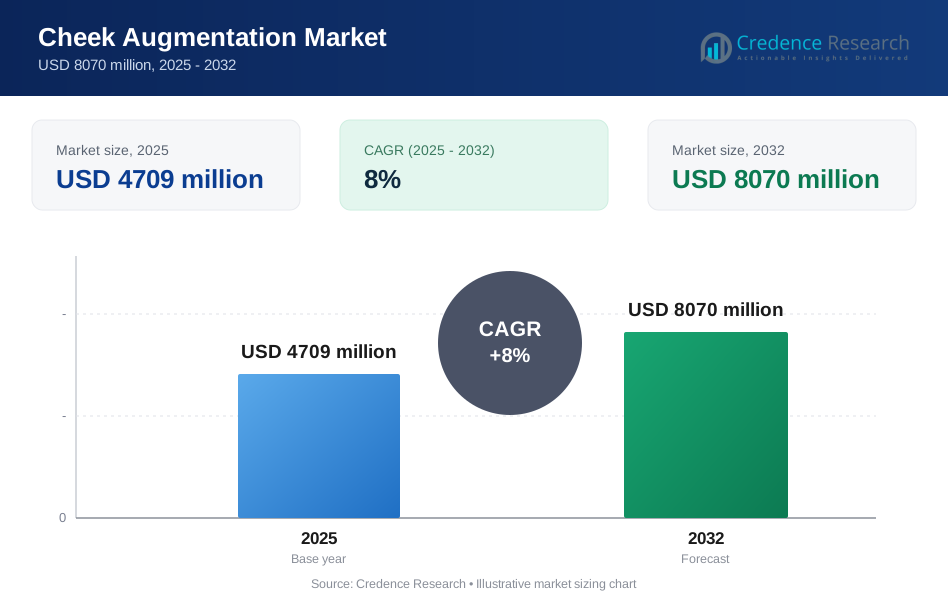
The global Cheek Augmentation Market size was estimated at USD 4709 million in 2025 and is expected to reach USD 8070 million by 2032, growing at a CAGR of 8% from 2025 to 2032. Demand is primarily driven by sustained consumer preference for minimally invasive facial enhancement that delivers visible contour improvement with limited downtime and high repeatability in treatment plans. Expanding access through specialty aesthetic clinics and medspas is also widening procedure availability and supporting consistent procedure volumes across major urban markets.
| REPORT ATTRIBUTE | DETAILS |
|---|---|
| Historical Period | 2020-2024 |
| Base Year | 2025 |
| Forecast Period | 2026-2032 |
| Cheek Augmentation Market Size 2025 | USD 4709 million |
| Cheek Augmentation Market, CAGR | 8% |
| Cheek Augmentation Market Size 2032 | USD 8070 million |
Key Market Trends & Insights
- The Cheek Augmentation Market is projected to grow from USD 4709 million (2025) to USD 8070 million (2032) at a 8% CAGR (2025–2032).
- Non-Surgical Dermal Fillers accounted for the largest share of 58.7% in 2025, supported by patient preference for quick recovery and adjustable outcomes.
- Hyaluronic Acid (HA) Fillers held the leading product share of 44.9% in 2025, reflecting strong injector familiarity and reversibility-driven adoption.
- Specialty Aesthetic / Cosmetic Clinics led end-user demand with a 46.2% share in 2025, reflecting high throughput and dedicated injector workflows.
- North America represented the largest regional share at 34.1% in 2025, reflecting higher procedure penetration and dense provider networks.
Segment Analysis
Cheek augmentation demand is increasingly shaped by consumer preference for aesthetic outcomes that appear natural, are customizable, and can be maintained through repeat visits. Global procedure volumes for injectables remain large, reinforcing stable clinic utilization and supporting steady replenishment demand across leading filler categories. In practice settings, consult-to-procedure conversion is strengthened by short appointment times and predictable recovery pathways, which encourages first-time adoption and repeat treatments.
The market is also benefiting from channel expansion across specialty aesthetic clinics, dermatology and plastic surgery practices, and a growing medspa footprint. These settings support standardized protocols, bundled treatment planning, and high-frequency patient touchpoints. Product choice is influenced by safety profile, reversibility, and physician comfort with established brands, which helps sustain leadership for HA fillers while biostimulators and longer-lasting options gain attention for maintenance-based programs.
By Procedure Type Insights
Non-Surgical Dermal Fillers accounted for the largest share of 58.7% in 2025. Leadership is supported by the preference for minimally invasive enhancement with limited downtime and predictable contouring outcomes. The approach benefits from stepwise correction, enabling providers to fine-tune midface projection and symmetry across follow-up visits. Broad accessibility through outpatient clinics and medspas further sustains procedure volumes versus operating-room dependent alternatives.
By Product Insights
Hyaluronic Acid (HA) Fillers accounted for the largest share of 44.9% in 2025. HA leadership is reinforced by a well-established safety profile and workflow familiarity among injectors across clinic settings. Reversibility supports patient confidence and enables conservative treatment planning for first-time users. Wide availability across differentiated viscosities and formulations supports midface lift and contour objectives, maintaining strong preference for HA in routine cheek augmentation.
By End User Insights
Specialty Aesthetic / Cosmetic Clinics accounted for the largest share of 46.2% in 2025. These clinics benefit from high procedure throughput, specialized injector expertise, and standardized aesthetic assessment workflows. Concentration of demand is supported by consult-based treatment planning and follow-up scheduling that encourages repeat visits. Specialized clinics also typically maintain broader product inventories and training pathways, helping sustain consistent outcomes and patient retention.
Cheek Augmentation Market Drivers
Rising preference for minimally invasive facial contouring
Demand is strongly supported by patient preference for procedures that deliver visible midface enhancement with limited downtime and quick return to daily activity. Non-surgical cheek augmentation also enables staged correction, which improves patient comfort and supports conservative starting doses for first-time consumers. Repeat-visit maintenance models align well with clinic workflows and support recurring utilization. As treatment planning becomes more outcome-driven, cheek contouring is increasingly positioned as part of full-face harmony approaches rather than a standalone procedure.
Expanding clinic and medspa access improves procedure availability
Wider availability of outpatient aesthetic settings is increasing access to cheek augmentation services and improving appointment convenience. Specialty aesthetic clinics, dermatology practices, and medspas have scaled consultation capacity and procedural throughput, supporting higher patient volumes. Growth in provider networks also improves geographic coverage beyond major metro areas and supports adoption among younger demographic cohorts. Channel expansion reinforces steady demand for consumables and strengthens competitive focus on training, protocols, and customer experience.
- For instance, according to the American Med Spa Association's 2024 Medical Spa State of the Industry Report, U.S. medical spa locations grew from 8,899 in 2022 to 10,488 in 2023 a net addition of ~1,589 locations (~18% expansion in a single year) with 84% of owners expecting revenue growth in 2024, and 54% projecting increases of at least 10%.
Product portfolio innovation strengthens adoption and confidence
The market benefits from continuous upgrades in filler design, delivery ergonomics, and indication expansion that improve usability and treatment predictability. Providers favor products that support consistent shaping, reduced palpability, and controlled integration into tissue planes. Brand-backed education and injector training ecosystems increase comfort with advanced injection patterns and reduce perceived risk. Product differentiation also supports premium positioning, especially where outcomes and safety assurance drive consumer decision-making.
- For instance, in February 2026, Galderma's Restylane portfolio spanning four proprietary gel technologies (NASHA®, NASHA HD™, OBT™, and SB-NASHA™) received simultaneous regulatory approvals from the U.S. FDA, European Union, and Health Canada for a newly engineered syringe system within its NASHA® lidocaine range, covering cheek, chin, jawline, and nose indications.
Growing focus on holistic facial aesthetics and natural outcomes
Cheek augmentation is increasingly used to restore midface volume and contour as part of broader facial balancing plans. Consumers often prioritize results that appear natural and are aligned with overall facial proportions, which supports demand for precise, adjustable volumization approaches. Consultations are more frequently supported by structured aesthetic assessment, which strengthens procedure conversion. Social visibility and routine professional photography also reinforce attention to midface contours, sustaining ongoing interest in cheek augmentation.
Cheek Augmentation Market Challenges
Cheek augmentation demand faces ongoing sensitivity to perceived safety risk and outcome variability, especially for first-time consumers. Concerns around overcorrection, asymmetry, and the need for corrective procedures can delay adoption and increase pre-procedure consultation time. Provider skill variability across settings can influence patient experience, increasing the need for standardized protocols and training. Negative social sentiment following visible adverse outcomes may temporarily dampen demand in specific geographies or demographic cohorts.
- For instance, Allergan’s JUVÉDERM VOLUMA XC uses a 20 mg/mL crosslinked hyaluronic acid formulation with 0.3% lidocaine, and in its FDA pivotal study 85.6% of treated patients met the Month-6 responder threshold; however, 82% underwent a touch-up treatment and 98.1% reported at least one local treatment-site response after initial treatment, reinforcing why provider technique, protocol standardization, and complication management remain central to patient confidence.
The market also faces competitive pressure from a wide range of aesthetic offerings that compete for the same consumer wallet share. Patients may substitute cheek augmentation with alternative facial rejuvenation options, shifting spend across modalities depending on trends and practitioner recommendations. Regulatory scrutiny and labeling constraints can affect product positioning, marketing claims, and expansion pace in specific regions. In price-sensitive markets, discounting and promotional packages can compress margins and intensify competition among service providers.
Cheek Augmentation Market Trends and Opportunities
A key trend is the increasing adoption of combination treatment planning, where cheek augmentation is delivered alongside complementary facial enhancements to optimize full-face harmony. This supports cross-selling within clinics and increases per-visit value through structured aesthetic programs. The approach also encourages maintenance-based plans that improve retention and recurring demand. Opportunity is strengthened by providers building standardized pathways that map product selection to contouring objectives and patient anatomy.
- For instance, Allergan’s Juvéderm-linked MD Codes system divides the cheek into five anatomical subunits, specifies injection depth and delivery tool for each site, and assigns active-number volumes such as 0.2 mL at Ck2 and 0.5 mL at Ck4/Ck5, while one full-face “tired look” protocol totals 4.0 mL for both sides when cheek, temple, and tear-trough codes are combined.
Another trend is greater emphasis on workflow efficiency and practitioner usability, including refinements in delivery systems and technique guidance. Improvements that shorten procedure time and support consistent placement can increase daily throughput in high-volume clinics. Expansion of premium injector education ecosystems creates additional opportunity for brands that can scale training and post-treatment support. Emerging urban centers in Asia Pacific and Latin America also present growth potential as aesthetics infrastructure expands.
Regional Insights
North America
North America led the market with a 34.1% share in 2025, supported by high procedure penetration and established aesthetic clinic networks. Demand is strengthened by strong consumer willingness to spend on elective aesthetics and the availability of experienced injectors across metropolitan areas. A mature product ecosystem supports broad access to differentiated filler portfolios and procedure standardization. Provider-led education and outcome-focused treatment planning contribute to sustained adoption across repeat patient cohorts.
Europe
Europe accounted for 28.4% share in 2025, supported by strong aesthetic medicine adoption and well-established dermatology and plastic surgery practice networks. Demand is reinforced by preference for natural-looking outcomes and structured consultation-led care pathways. High standards for training and clinical governance encourage consistent patient experiences across leading markets. The region remains an important base for premium clinic offerings and brand-led professional education.
Asia Pacific
Asia Pacific held 22.7% share in 2025, supported by expanding aesthetics infrastructure, rising disposable income in key cities, and increased adoption of minimally invasive procedures. Demand is supported by a growing base of trained practitioners and faster expansion of specialized outpatient settings. Social visibility and image-centric consumer behavior reinforce interest in midface contouring and facial balance. The region also offers opportunity for scale as provider networks expand across second-tier cities.
Latin America
Latin America represented 8.2% share in 2025, supported by growing urban aesthetics demand and rising availability of outpatient treatment settings. Demand is driven by expanding private clinics, increasing consumer awareness, and broader access to injectables across major cities. Competitive pricing and promotional packages support adoption among first-time consumers in select markets. Continued growth depends on training availability and service quality consistency across provider networks.
Middle East & Africa
Middle East & Africa accounted for 6.6% share in 2025, supported by concentrated demand in premium private clinics and medical tourism hubs. High-income patient segments and expanding specialty aesthetic centers contribute to procedure volumes in leading urban markets. Provider investment in premium brands and technique-led differentiation supports adoption where quality assurance is prioritized. Growth is linked to continued expansion of private healthcare capacity and specialist availability.
Competitive Landscape
Competition is shaped by branded injectable portfolios, practitioner training ecosystems, and strong channel penetration across specialty clinics, dermatology practices, and medspas. Companies compete on product performance, safety confidence, and ease of use, with increasing emphasis on standardized protocols that improve outcome consistency. Commercial execution increasingly relies on education-led demand generation, clinical evidence support, and scalable service networks that improve clinic loyalty. Implant and surgical players compete by emphasizing structural durability and operating-room capabilities in appropriate patient segments.
AbbVie (Allergan Aesthetics) remains influential through broad injectable aesthetics coverage and scalable market access strategies. Expansion initiatives, including rollout into 35 additional markets, strengthen availability and reinforce clinic familiarity with the portfolio. The company’s positioning also benefits from consumer-oriented messaging that emphasizes skin-quality and aesthetics goals, which supports consultation conversion in high-volume practices. Ongoing training and product ecosystem depth help sustain competitive advantage in repeat-use injectable categories.
The industry research and growth report includes detailed analyses of the competitive landscape of the market and information about key companies, including:
- AbbVie (Allergan Aesthetics)
- Galderma SA
- Merz Aesthetics
- Stryker Corporation
- Implantech Associates
- Sientra
- Sinclair
- Johnson & Johnson Services
- Anika Therapeutics
- Hanson Medical
- Zimmer Biomet
Qualitative and quantitative analysis of companies has been conducted to help clients understand the wider business environment as well as the strengths and weaknesses of key industry players. Data is qualitatively analyzed to categorize companies as pure play, category-focused, industry-focused, and diversified; it is quantitatively analyzed to categorize companies as dominant, leading, strong, tentative, and weak.
'Recent Developments
- In February 2025, Crown Laboratories completed its acquisition of Revance Therapeutics. Crown said the business combination strengthens its position in aesthetics and skincare and brings Revance’s innovative aesthetic and therapeutic offerings into the combined company.
- In January 2025, Galderma presented new data on recently launched products at IMCAS 2025, including Restylane SHAYPE, which it described as the latest addition to its hyaluronic acid injectable portfolio. Galderma said the gel data showed Restylane SHAYPE had the highest G-prime among commonly used HA fillers, indicating superior gel strength and firmness for shaping applications.
- In January 2025, Allergan Aesthetics launched its new AA Signature Program internationally at IMCAS World Congress 2025. The company said the program focuses on key patient needs seen in clinical practice, including a “Lift” approach designed for added lift, structure, and skin firmness, and noted that more signature looks and approaches will be introduced globally for different areas of the face.
Report Scope
| Report Attribute | Details |
| Market size value in 2025 | USD 4709 million |
| Revenue forecast in 2032 | USD 8070 million |
| Growth rate (CAGR) | 8% (2025–2032) |
| Base year | 2025 |
| Forecast period | 2026–2032 |
| Quantitative units | USD million |
| Segments covered | By Procedure Type Outlook: Non-Surgical Dermal Fillers, Surgical Cheek Implants, Autologous Fat Grafting / Fat Transfer; By Product Outlook: Hyaluronic Acid (HA) Fillers, Calcium Hydroxylapatite (CaHA) Fillers, Poly-L-Lactic Acid (PLLA) Fillers, Other Fillers (Including PMMA and Collagen); By End User Outlook: Specialty Aesthetic / Cosmetic Clinics, Dermatology and Plastic Surgery Clinics, Hospitals and Surgical Centers, MedSpas, Other Ambulatory / Specialty Centers |
| Regional scope | North America, Europe, Asia Pacific, Latin America, Middle East & Africa |
| Key companies profiled | AbbVie (Allergan Aesthetics), Galderma SA, Merz Aesthetics, Stryker Corporation, Implantech Associates, Sientra, Sinclair, Johnson & Johnson Services, Anika Therapeutics, Hanson Medical, Zimmer Biomet |
| No. of Pages | 328 |
Segmentation
By Procedure Type
- Non-Surgical Dermal Fillers
- Surgical Cheek Implants
- Autologous Fat Grafting / Fat Transfer
By Product
- Hyaluronic Acid (HA) Fillers
- Calcium Hydroxylapatite (CaHA) Fillers
- Poly-L-Lactic Acid (PLLA) Fillers
- Other Fillers (Including PMMA and Collagen)
By End User
- Specialty Aesthetic / Cosmetic Clinics
- Dermatology and Plastic Surgery Clinics
- Hospitals and Surgical Centers
- MedSpas
- Other Ambulatory / Specialty Centers
By Region
- North America
- U.S.
- Canada
- Mexico
- Europe
- Germany
- France
- U.K.
- Italy
- Spain
- Rest of Europe
- Asia Pacific
- China
- Japan
- India
- South Korea
- South-east Asia
- Rest of Asia Pacific
- Latin America
- Brazil
- Argentina
- Rest of Latin America
- Middle East & Africa
- GCC Countries
- South Africa
- Rest of the Middle East and Africa
Request a Free Sample
Fill in your details and we'll send you a free sample report.
- Sample data tables & charts
- Research methodology
Need a Custom Version of This Report?
Tailor the scope, geography, or segments to your exact requirements.
- Custom geography or segment scope
- Direct access to our analyst team
Frequently Asked Questions
What is the market size and forecast for the Cheek Augmentation Market?
What is the CAGR for the Cheek Augmentation Market?
What is the largest segment in the Cheek Augmentation Market?
What factors are driving growth in the Cheek Augmentation Market?
Who are the leading companies in the Cheek Augmentation Market?
Which region leads the Cheek Augmentation Market?
Table of Content
Chapter 1. Report Introduction
- 1.1 Report Description & Purpose
- 1.1.1 Report Title & Market Definition
- 1.1.2 Unique Selling Propositions (USP) & Key Differentiators
- 1.1.3 Value Proposition for Stakeholders
- 1.2 Research Objectives
- 1.2.1 Market Sizing Objectives (Volume & Revenue)
- 1.2.2 Segmentation Objectives
- 1.2.3 Competitive Intelligence Objectives
- 1.2.4 Forecast & Scenario Objectives
- 1.3 Report Scope
- 1.3.1 Cheek Augmentation Scope – Types & Subtypes Covered
- 1.3.2 Geographic Scope – Regions & Countries Covered
- 1.3.3 Historical Period, Base Year & Forecast Period (2025; forecast to 2032)
- 1.3.4 Inclusions & Exclusions
- 1.4 HS Code & Classification Framework
- 1.5 Currency, Units & Pricing Basis
- 1.6 Target Stakeholders
- 1.7 Limitations & Assumptions
Chapter 2. Executive Summary
- 2.1 Global Cheek Augmentation Market Snapshot
- 2.1.1 Market Size – Historical (2025) & Forecast (2025-2032) (2025: USD 4709 million → 2032: USD 8070 million)
- 2.1.2 Volume & Revenue – Global Totals
- 2.1.3 Key Market Highlights – Top Five Facts
- 2.2 Cheek Augmentation Market Segmentation Snapshot
- 2.2.1 Market Split by Region – 2025 vs. 2032
- 2.3 Competitive Snapshot
- 2.3.1 Top 10 Players by Revenue Share – 2025
- 2.3.2 Top 10 Players by Volume Share – 2025
- 2.3.3 Recent Strategic Developments (18-Month Summary)
- 2.4 Key Investment Highlights & Strategic Conclusions
Chapter 3. Cheek Augmentation Market Dynamics & Industry Analysis
- 3.1 Market Overview & Context
- 3.1.1 Cheek Augmentation Market Position in the Broader Automotive Value Chain
- 3.1.2 OEM vs. Replacement Market Dynamics
- 3.1.3 Market Maturity & Development Stage by Region
- 3.2 Cheek Augmentation Market Drivers
- 3.3 Cheek Augmentation Market Restraints & Challenges
- 3.4 Cheek Augmentation Market Opportunities
- 3.5 Porter's Five Forces Analysis
- 3.5.1 Threat of New Entrants
- 3.5.2 Bargaining Power of Suppliers
- 3.5.3 Bargaining Power of Buyers
- 3.5.4 Threat of Substitutes
- 3.5.5 Competitive Rivalry – Intensity Assessment
- 3.6 Cheek Augmentation Value Chain Analysis
- 3.6.1 Upstream – Raw Material/Input Suppliers
- 3.6.1.1 Raw Material/Input 1
- 3.6.1.2 Raw Material/Input 2
- 3.6.1.3 Raw Material/Input 3
- 3.6.2 Midstream – Production/Manufacturing/Service Delivery
- 3.6.2.1 Production/Process Overview
- 3.6.2.2 Key Facility Locations & Capacity by Manufacturer
- 3.6.3 Downstream – Distribution & End Consumer
- 3.6.3.1 Primary Channel – B2B/OEM
- 3.6.3.2 Secondary Channels – Dealer, Retail, Online, Direct
- 3.6.4 Value Chain Profitability Analysis
- 3.6.1 Upstream – Raw Material/Input Suppliers
- 3.7 PESTEL Analysis
- 3.7.1 Political Factors
- 3.7.2 Economic Factors
- 3.7.3 Social Factors
- 3.7.4 Technological Factors
- 3.7.5 Environmental Factors
- 3.7.6 Legal Factors
- 3.8 Cheek Augmentation Supply Chain Analysis
- 3.8.1 Raw Material/Input Supply Risk Assessment
- 3.8.2 Manufacturing Concentration Risk (Geographic Exposure)
- 3.8.3 Trade Disruption Impact Analysis
- 3.9 Regulatory & Policy Landscape
Note: The regulatory and policy landscape section covers regulations based on their applicability to the market, Cheek Augmentation category, geography, and scope of the study. Only regulatory frameworks with a material impact on operations, compliance, trade, sustainability, or market access are analyzed in detail.
Chapter 4. Key Investment Pockets & Opportunity Analysis
- 4.1 Cheek Augmentation Market Attractiveness Analysis
- 4.1.1 By Region – Investment Attractiveness Matrix (Volume × CAGR)
- 4.2 Absolute Revenue Growth Opportunity
- 4.2.1 By Region – Absolute USD Growth Through 2032
- 4.3 Incremental Volume Opportunity
- 4.3.1 By Region – Incremental Volume Through 2032
- 4.3.2 Segment – Incremental Volume
- 4.4 Emerging Submarket Opportunity Deep Dive (Subject to Applicability)
- 4.5 Emerging Market Opportunity Scorecards
- 4.5.1 United States
- 4.5.2 Europe
- 4.5.3 Asia
- 4.5.4 Middle East & Africa
Note: Emerging Market Opportunity Scorecards will be included based on relevance and strategic importance. Regions listed are indicative and may vary depending on data availability and market dynamics.
Chapter 5. Cheek Augmentation Import-Export Analysis & Trade Flows
- 5.1 Global Trade Overview
- 5.1.1 Global Export Value by Country (2025)
- 5.1.2 Global Export Volume by Country (2025)
- 5.1.3 Global Import Value by Country (2025)
- 5.1.4 Global Import Volume by Country (2025)
- 5.1.5 Net Trade Balance by Country (2025)
- 5.2 Export Analysis – Segment
- 5.2.1 Type 1 (HS Code)
- 5.2.2 Type 2 (HS Code)
- 5.2.3 Type 3 (HS Code)
- 5.2.4 Type 4 (HS Code)
- 5.2.5 Type 5 (HS Code)
- 5.3 Import Analysis – Segment
- 5.3.1 Type 1 (HS Code)
- 5.3.2 Type 2 (HS Code)
- 5.3.3 Type 3 (HS Code)
- 5.3.4 Type 4 (HS Code)
- 5.3.5 Type 5 (HS Code)
- 5.4 Average Unit Trade Prices
- 5.4.1 Average Export Price – Segment & Country
- 5.4.2 Average Import Price – Segment & Source Country
- 5.4.3 Price Trends (2025)
- 5.5 Key Trade Route Analysis
- 5.5.1 Trade Route 1
- 5.5.2 Trade Route 2
- 5.5.3 Trade Route 3
- 5.5.4 Trade Route 4
- 5.5.5 Trade Route 5
- 5.6 Trade Policy Impact Assessment
- 5.6.1 US Anti-Dumping & Section 301 Tariffs
- 5.6.2 EU Customs Union Impact
- 5.6.3 Major Free Trade Agreements
- 5.6.4 USMCA Rules of Origin
Note: Trade policy analysis will be included only where relevant to the Cheek Augmentation market.
Chapter 6. Competitive Landscape & Company Benchmarking
- 6.1 Cheek Augmentation Market Concentration & Structure
- 6.1.1 Herfindahl-Hirschman Index (HHI) – vs. 2025
- 6.1.2 Tier 1, Tier 2 & Tier 3 Market Structure
- 6.1.3 Global, Regional & Local Player Dynamics
- 6.2 Cheek Augmentation Market Share Analysis – 2025
- 6.2.1 Global Revenue Share by Company
- 6.2.2 Global Volume Share by Company
- 6.2.3 Regional Revenue Share
- 6.2.4 Market Share Evolution ( vs. 2025)
- 6.2.5 OEM Segment Share by Company
- 6.2.6 Replacement Segment Share by Company
- 6.3 Production/Delivery Capacity & Facility Analysis
- 6.3.1 Global Installed Capacity
- 6.3.2 Capacity Utilization Rates
- 6.3.3 Production/Output Volume
- 6.3.4 Facility Locations & Capacity Map
- 6.3.5 Planned Capacity Additions
- 6.4 Cheek Augmentation Competitive Benchmarking Matrix
- 6.4.1 Revenue, Volume, CAGR & Profitability Comparison
- 6.4.2 Channel Revenue Mix
- 6.4.3 Geographic Revenue Exposure
- 6.4.4 R&D Intensity
- 6.4.5 Sustainability Maturity
- 6.5 Strategic Developments in Cheek Augmentation (Last 24 Months)
- 6.5.1 Mergers, Acquisitions & Divestments
- 6.5.2 New Cheek Augmentation Launches
- 6.5.3 Facility Expansions
- 6.5.4 Strategic Alliances, Joint Ventures & Partnerships
- 6.5.5 Distribution Expansion & Market Entry
- 6.5.6 Sustainability & ESG Initiatives
- 6.6 Competitive Strategy Mapping
- 6.6.1 Leader, Challenger, Follower & Niche Classification
- 6.6.2 Pricing Strategy Comparison
- 6.6.3 Channel Strategy Matrix
Note: Strategic developments are included based on their materiality and the availability of reliable information.
Chapter 7. Global Cheek Augmentation Market – By Distribution Channel
- 7.1 Segment Overview
- 7.1.1 Volume & Revenue Split by Channel (2025 & 2032)
- 7.1.2 Channel Mix Evolution (2025-2032)
Chapter 8. Regional Market Analysis – Global Overview
- 8.1 Global Regional Overview
- 8.1.1 Regional Volume Share
- 8.1.2 Regional Revenue Share
- 8.1.3 Regional Volume by Region
- 8.1.4 Regional Revenue by Region
- 8.1.5 Regional Forecast Through 2032
- 8.2 Cross-Regional Segment Analysis
- 8.2.1 By Distribution Channel
- 8.2.2 By Brand/Price Tier
Chapter 9. North America Cheek Augmentation Market
- 9.1 United States
- 9.2 Canada
- 9.3 Mexico
Chapter 10. Europe Cheek Augmentation Market
- 10.1 Germany
- 10.2 France
- 10.3 Italy
- 10.4 United Kingdom
- 10.5 Spain
- 10.6 Poland
- 10.7 Russia
- 10.8 Netherlands
- 10.9 Belgium
- 10.10 Sweden
- 10.11 Denmark
- 10.12 Norway
- 10.13 Rest of Europe
Chapter 11. Asia Pacific Cheek Augmentation Market
- 11.1 China
- 11.2 India
- 11.3 Japan
- 11.4 South Korea
- 11.5 Thailand
- 11.6 Indonesia
- 11.7 Vietnam
- 11.8 Malaysia
- 11.9 Australia
- 11.10 Rest of Asia Pacific
Chapter 12. Latin America Cheek Augmentation Market
- 12.1 Brazil
- 12.2 Argentina
- 12.3 Colombia
- 12.4 Chile
- 12.5 Rest of Latin America
Chapter 13. Middle East Cheek Augmentation Market
- 13.1 Saudi Arabia
- 13.2 United Arab Emirates
- 13.3 Turkey
- 13.4 Israel
- 13.5 Iran
- 13.6 Rest of the Middle East
Chapter 14. Africa Cheek Augmentation Market
- 14.1 South Africa
- 14.2 Egypt
- 14.3 Nigeria
- 14.4 Morocco
- 14.5 Rest of Africa
Chapter 15. Cheek Augmentation Company Profiles
- 15.1 [Company 01]
- 15.1.1 Company Overview
- 15.1.2 Key Management Personnel
- 15.1.3 Products & Services Portfolio
- 15.1.4 Financial Performance
- 15.1.5 Key Market Focus & Geographic Presence
- 15.1.6 Recent Developments & Strategic Initiatives
Note: The company profile list is preliminary and may change based on research findings, market developments, data availability, and client requirements.
Chapter 16. Appendices
- Appendix A – List of Abbreviations & Acronyms
- Appendix B – Industry Classification Code Reference – Full Series
- Appendix C – Production & Capacity Data Tables
- Appendix D – End-Use & Demand Base Tables
- Appendix E – Consumption & Replacement Rate Assumptions
- Appendix F – ASP Reference Tables
- Appendix G – Manufacturing & Facility Database
- Appendix H – Import-Export Data Tables
- Appendix I – Regulatory Summary Tables
- Appendix J – Primary Research Participant List (Anonymized)
- Appendix K – Primary Research Questionnaire Framework
- Appendix L – Data Sources & Bibliography
- Appendix M – Market Size Divergence & Source Comparison
Chapter 17. Research Methodology
- 17.1 Research Framework & Philosophy
- 17.2 Secondary Research – Sources, Hierarchy & Data Extraction
- 17.3 Data Modeling – Bottom-Up & Top-Down Market Sizing
- 17.4 Primary Research – Stakeholder Framework, LOI & Sample Sizes
- 17.5 Forecast Methodology – Regression, Scenario & Sensitivity Analysis
- 17.6 Quality Control – Four-Layer Validation Framework
- 17.7 Limitations & Standard Assumptions
- 17.8 Disclaimer
