| REPORT ATTRIBUTE |
DETAILS |
| Historical Period |
2020-2023 |
| Base Year |
2024 |
| Forecast Period |
2025-2032 |
| Cognitive Computing Market Size 2024 |
USD 52,485.68 million |
| Cognitive Computing Market, CAGR |
628.09% |
| Cognitive Computing Market Size 2032 |
USD 379,531.89 million |
Market Overview:
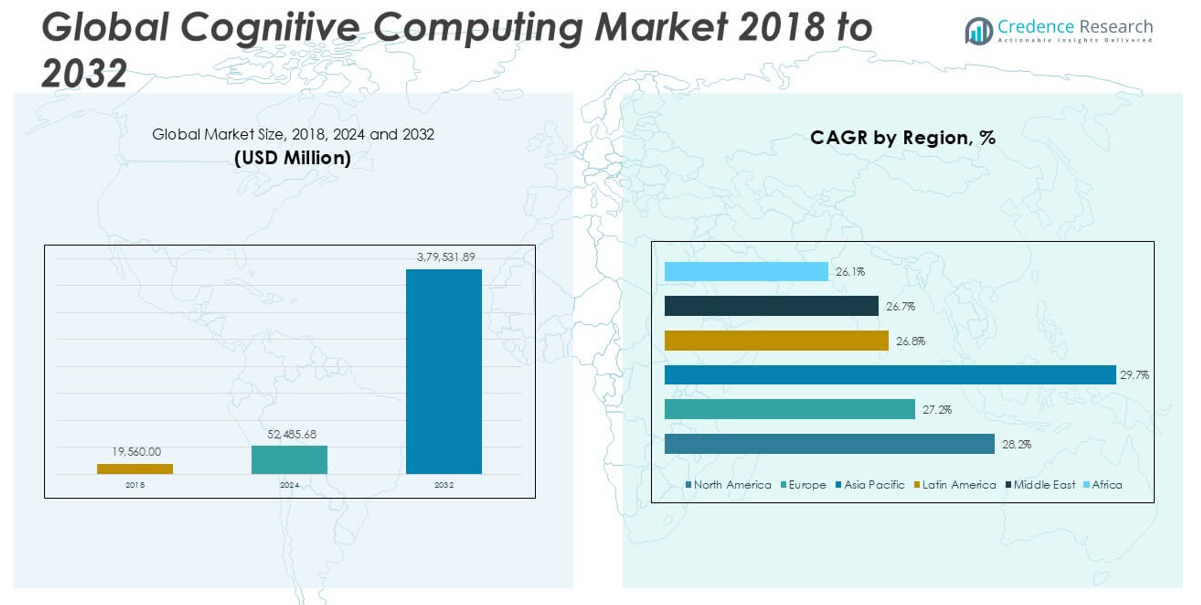
The Cognitive Computing market size was valued at USD 19,560.00 million in 2018, increased to USD 52,485.68 million in 2024, and is anticipated to reach USD 379,531.89 million by 2032, at a CAGR of 28.09% during the forecast period.
The Cognitive Computing market is highly competitive, with key players such as IBM Corporation, Google, Microsoft, SAP, Oracle Corporation, CognitiveScale, Enterra Solutions, and Palantir driving innovation and market growth. These companies lead the industry through advanced cognitive platforms, strong AI capabilities, and global service networks. North America dominates the market, holding the largest share of approximately 38.4% in 2024, supported by rapid technological advancements and early adoption across sectors like healthcare, BFSI, and IT. Europe and Asia Pacific follow, contributing significantly to the market’s expansion through increasing investments in cognitive technologies and rising demand for AI-powered business solutions.
Market Insights
- The Cognitive Computing market was valued at USD 19,560.00 million in 2018, reached USD 52,485.68 million in 2024, and is expected to hit USD 379,531.89 million by 2032, growing at a CAGR of 28.09% during the forecast period.
- The market is primarily driven by the rising demand for real-time data processing, increasing adoption of AI-powered customer engagement solutions, and the growing need for advanced decision-making across industries like healthcare, BFSI, and IT.
- Key trends include the rapid shift toward cloud-based cognitive solutions and the integration of cognitive computing with IoT and edge computing, enabling faster, data-driven insights and real-time analytics.
- The competitive landscape features major players like IBM, Google, Microsoft, and Oracle, who dominate through advanced technology portfolios, while emerging companies like CognitiveScale and Numenta contribute niche solutions; high implementation costs and system integration complexities restrain growth.
- Regionally, North America holds the largest share of 38.4%, followed by Europe (28.4%) and Asia Pacific (22.3%), while Natural Language Processing leads the technology segment.
Access crucial information at unmatched prices!
Request your sample report today & start making informed decisions powered by Credence Research Inc.!
Download Sample
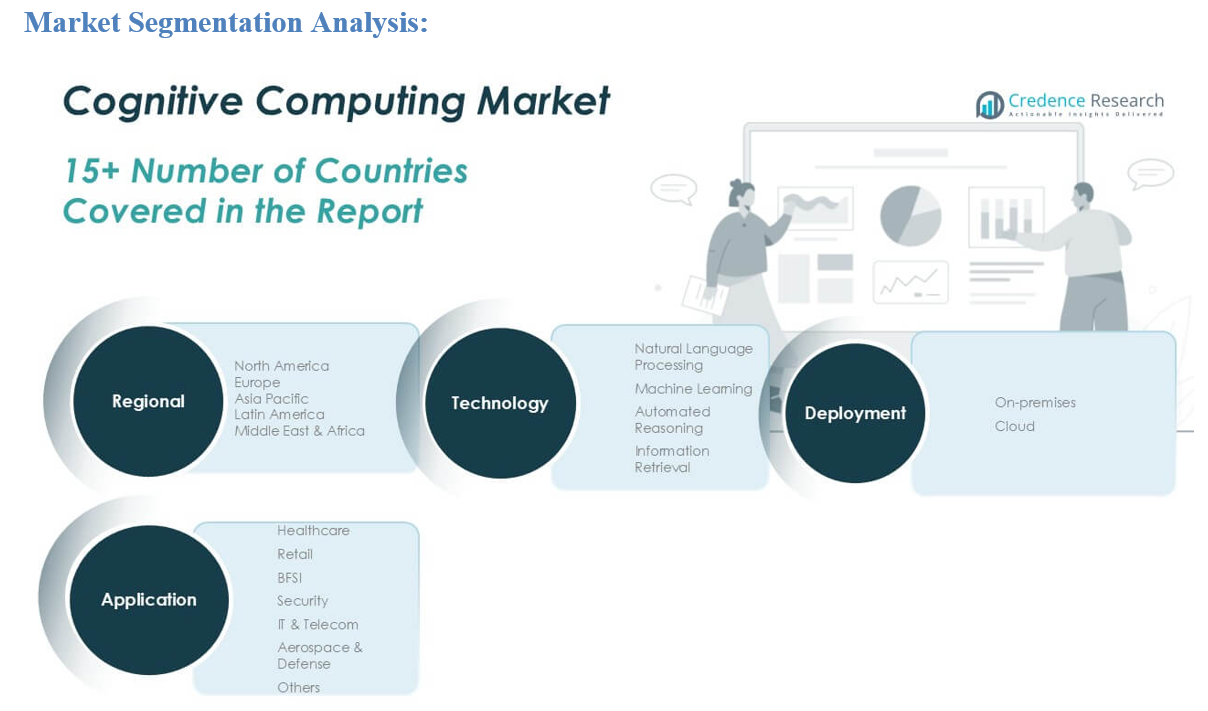
Market Segmentation Analysis:
By Technology
The Cognitive Computing market by technology is segmented into Natural Language Processing (NLP), Machine Learning, Automated Reasoning, and Information Retrieval. Among these, Natural Language Processing holds the dominant market share, driven by its widespread adoption in customer service, chatbots, and virtual assistants across industries. NLP’s ability to analyze and process human language in real-time offers significant advantages in decision-making and customer engagement, making it a preferred technology. Additionally, the increasing demand for personalized user experiences and the integration of NLP in voice-enabled applications further accelerate its growth within the cognitive computing landscape.
- For instance, IBM Watson’s Natural Language Processing engine is capable of processing over 80 terabytes of data per day, supporting real-time insights across multiple industries.
By Application
The market is segmented into Healthcare, Retail, BFSI, Security, IT & Telecom, Aerospace & Defense, and Others. The Healthcare segment leads the market, accounting for the largest revenue share due to the rapid adoption of cognitive computing for diagnostics, personalized treatment, and patient management systems. The rising need for advanced data analysis, early disease detection, and efficient patient care are key drivers boosting demand in this sector. By deployment, the market is categorized into On-premises and Cloud, with Cloud-based deployment emerging as the dominant segment. Cloud solutions offer greater scalability, cost efficiency, and remote accessibility, making them increasingly attractive to enterprises aiming for flexible and real-time cognitive processing capabilities.
- For instance, Google’s DeepMind successfully analyzed 1.6 million retinal scans to detect over 50 eye diseases with accuracy comparable to human experts, demonstrating cognitive computing’s impact on healthcare diagnostics.
Market Overview
Rising Demand for Real-Time Data Processing
The growing need for real-time data analysis across industries significantly drives the cognitive computing market. Organizations increasingly rely on cognitive solutions to process large volumes of structured and unstructured data swiftly for quicker, data-driven decision-making. Cognitive computing enhances the ability to predict market changes, optimize operations, and improve customer interactions. Industries such as healthcare, BFSI, and retail are adopting these systems to gain real-time insights, streamline workflows, and respond promptly to changing consumer and market dynamics.
- For instance, Palantir’s Foundry platform processes over 1 billion data points daily for its enterprise clients, enabling real-time decision-making in sectors like defense, healthcare, and manufacturing.
Expansion of Artificial Intelligence Applications
The widespread integration of artificial intelligence (AI) across various sectors is a major growth driver for the cognitive computing market. Cognitive systems leverage AI to simulate human reasoning, automate complex tasks, and provide intelligent insights, leading to higher operational efficiency. The increasing adoption of AI-powered chatbots, predictive analytics, and automated customer service solutions accelerates the market’s growth. Businesses recognize the potential of cognitive computing to reduce costs, improve personalization, and deliver enhanced customer experiences across digital platforms.
- For instance, Microsoft’s Azure AI platform processes over 500 million chatbot interactions per month, significantly enhancing customer engagement for global businesses across industries.
Growing Adoption in the Healthcare Sector
The healthcare industry is rapidly embracing cognitive computing solutions to improve diagnostics, patient care, and operational efficiency. These systems assist in analyzing medical records, supporting clinical decisions, and identifying treatment plans based on vast datasets. The ability of cognitive computing to process large-scale patient data and derive meaningful patterns contributes to better health outcomes and reduced diagnostic errors. As healthcare providers focus on personalized medicine and predictive analytics, the demand for cognitive computing solutions is expected to surge.
Key Trends & Opportunities
Increasing Deployment of Cloud-Based Cognitive Solutions
A significant trend shaping the cognitive computing market is the growing shift toward cloud-based deployments. Cloud platforms offer scalability, remote accessibility, and reduced infrastructure costs, making cognitive solutions more accessible to small and medium-sized enterprises. This transition enables faster data processing, real-time collaboration, and seamless integration with existing systems. The cloud model also supports continuous updates and easy scalability, encouraging businesses across sectors to adopt cognitive computing for enhanced agility and performance.
- For instance, Amazon Web Services (AWS) supports over 200 cloud-native cognitive services used by global enterprises for real-time analytics, machine learning, and NLP applications.
Rising Integration with IoT and Edge Computing
The convergence of cognitive computing with the Internet of Things (IoT) and edge computing presents promising growth opportunities. Cognitive solutions can process data from interconnected IoT devices in real time, enabling smarter and faster decision-making at the edge. This integration supports advanced use cases like predictive maintenance, real-time fraud detection, and intelligent supply chain management. As IoT adoption expands across industries, cognitive computing will play a crucial role in enhancing the value extracted from connected ecosystems.
- For instance, Cisco’s IoT cognitive platform manages over 500 million connected devices, supporting real-time data processing and intelligent automation in industrial and smart city applications.
Key Challenges
High Implementation and Operational Costs
Despite its benefits, the cognitive computing market faces challenges related to high implementation and operational costs. The development, customization, and integration of cognitive systems require significant investment, often limiting adoption among small and medium-sized businesses. Additionally, ongoing maintenance and the need for skilled professionals further increase total ownership costs. These financial barriers can restrict market growth, especially in cost-sensitive regions and industries with limited technology budgets.
Data Privacy and Security Concerns
Data privacy and security remain critical challenges in the cognitive computing landscape. Cognitive systems handle vast amounts of sensitive data, making them vulnerable to cyber threats and breaches. Industries such as healthcare and finance must comply with stringent regulatory standards, adding complexity to cognitive computing deployment. Ensuring secure data handling, robust encryption, and regulatory compliance are essential to building trust and sustaining market growth, but these requirements often slow down adoption rates.
Complexity of System Integration
The integration of cognitive computing solutions with existing IT infrastructure can be highly complex. Organizations may face challenges in aligning cognitive systems with legacy platforms, diverse data sources, and current workflows. This complexity often leads to extended implementation timelines and increased project risks. Companies must invest in skilled IT resources and customized solutions to ensure seamless integration, which can further complicate the adoption process and impact market penetration.
Regional Analysis
North America
North America dominated the Cognitive Computing market in 2024, holding the largest regional share of approximately 38.4%, with a market size of USD 20,155.81 million, up from USD 7,585.37 million in 2018. The region is expected to reach USD 146,444.28 million by 2032, expanding at a CAGR of 28.2% during the forecast period. The market’s growth is driven by rapid technological advancements, strong adoption across healthcare, BFSI, and IT sectors, and the presence of key cognitive computing providers. The increasing demand for AI-driven customer engagement and real-time data processing further strengthens North America’s leadership in this market.
Europe
Europe accounted for approximately 28.4% of the global Cognitive Computing market share in 2024, with a market size of USD 14,920.24 million, rising from USD 5,760.42 million in 2018. The market is projected to reach USD 101,818.03 million by 2032, registering a CAGR of 27.2%. Europe’s growth is supported by regulatory advancements promoting digitalization, increasing investments in cognitive technologies, and the expansion of AI applications in financial services, security, and healthcare. Additionally, European enterprises are actively adopting cloud-based cognitive solutions to enhance operational efficiency and deliver improved customer experiences across various industries.
Asia Pacific
The Asia Pacific region captured around 22.3% of the Cognitive Computing market share in 2024, with the market size increasing from USD 4,146.72 million in 2018 to USD 11,696.21 million in 2024. The region is anticipated to reach USD 93,713.56 million by 2032, growing at the fastest CAGR of 29.7%. Rapid digital transformation, increasing cloud adoption, and the rising penetration of AI across emerging economies like China, India, and Japan are fueling the regional market. Asia Pacific is witnessing strong demand from healthcare, IT, and retail sectors, as organizations focus on leveraging cognitive computing for enhanced consumer analytics and decision-making.
Latin America
Latin America held approximately 5.1% of the global Cognitive Computing market share in 2024, with the market growing from USD 1,001.47 million in 2018 to USD 2,655.25 million in 2024. It is expected to reach USD 17,674.80 million by 2032, expanding at a CAGR of 26.8%. The region is experiencing gradual adoption of cognitive solutions across banking, security, and retail sectors. Companies are increasingly investing in cognitive computing to optimize customer interactions and enhance fraud detection capabilities. Brazil and Mexico are leading contributors to market growth, driven by expanding digital infrastructures and rising demand for AI-powered business intelligence solutions.
Middle East
The Middle East accounted for approximately 3.6% of the Cognitive Computing market share in 2024, with market size increasing from USD 723.72 million in 2018 to USD 1,815.66 million in 2024. The market is projected to reach USD 11,990.74 million by 2032, registering a CAGR of 26.7%. The region is witnessing increasing adoption of cognitive technologies across oil & gas, security, and telecom sectors. Governments and enterprises are heavily investing in digital transformation and AI-led initiatives to drive economic diversification. The growing need for real-time data analysis and enhanced cybersecurity further propels cognitive computing adoption across the Middle Eastern market.
Africa
Africa contributed to approximately 2.4% of the Cognitive Computing market share in 2024, with market size rising from USD 342.30 million in 2018 to USD 1,242.50 million in 2024. The market is forecasted to reach USD 7,890.49 million by 2032, growing at a CAGR of 26.1%. Cognitive computing adoption in Africa is gradually increasing, particularly within the financial services, healthcare, and telecom sectors. South Africa and Nigeria are emerging as key markets, with rising interest in AI-powered solutions to improve decision-making and customer management. However, limited digital infrastructure and high implementation costs remain challenges for widespread adoption in the region.
Market Segmentations:
By Technology
- Natural Language Processing
- Machine Learning
- Automated Reasoning
- Information Retrieval
By Application
- Healthcare
- Retail
- BFSI
- Security
- IT & Telecom
- Aerospace & Defense
- Others
By Deployment
By Geography
- North America
- Europe
- Germany
- France
- U.K.
- Italy
- Spain
- Rest of Europe
- Asia Pacific
- China
- Japan
- India
- South Korea
- South-east Asia
- Rest of Asia Pacific
- Latin America
- Brazil
- Argentina
- Rest of Latin America
- Middle East & Africa
- GCC Countries
- South Africa
- Rest of the Middle East and Africa
Competitive Landscape
The competitive landscape of the Cognitive Computing market is characterized by the presence of leading technology giants and specialized solution providers focusing on innovation and strategic expansion. Companies such as IBM Corporation, Google, Microsoft, SAP, and Oracle Corporation dominate the market through their extensive product portfolios, strong global presence, and continuous investments in artificial intelligence and cognitive solutions. These key players are actively engaged in partnerships, mergers, and acquisitions to strengthen their technological capabilities and expand their market reach. Emerging companies like CognitiveScale, Enterra Solutions, and Numenta are contributing to market competition by offering niche, AI-driven cognitive platforms tailored to specific industries. Additionally, players such as Palantir, SAS, and Tibco Software are focusing on advanced data analytics and cognitive insights to cater to evolving customer demands. The market is witnessing significant investments in cloud-based cognitive solutions and the integration of machine learning and natural language processing to deliver enhanced, real-time decision-making capabilities.
Shape Your Report to Specific Countries or Regions & Enjoy 30% Off!
Key Player Analysis
- CognitiveScale
- Enterra Solutions
- Google
- HP Development Company, L.P.
- IBM Corporation
- Microsoft
- Muance Communications Inc.
- Numenta
- Oracle Corporation
- Palantir
- PTC
- Saffron Technology
- SAP
- Statistical Analysis System (SAS)
- Tibco Software
- Vicarious
Recent Developments
- In May 2024, Wipro, an IT company in India, partnered with Microsoft to launch a suite of generative AI-powered cognitive assistants for financial services to enhance market intelligence, accelerate onboarding, and streamline loan origination. These solutions will utilize Microsoft Azure OpenAI and Document Intelligence to provide timely information, reduce paperwork, and improve the overall user experience for financial professionals and their clients
- In May 2024, IBM Corporation and SAP announced an expanded collaboration focused on generative AI capabilities and industry-specific cloud solutions to help clients enhance business value and accelerate digital transformation. The collaboration aims to integrate AI into various SAP business processes, enabling innovation across sectors while utilizing IBM’s expertise in hybrid cloud and AI technologies
- In February 2024, Microsoft collaborated with Mistral AI, a French artificial intelligence company, to boost AI innovation over several years. This collaboration will use Azure’s advanced infrastructure to develop and deploy Mistral’s large language models, including the new Mistral Large. This collaboration aims to provide commercial opportunities, enhance AI research and development, and make Mistral AI’s models accessible to customers through Azure’s Models as a Service (MaaS)
- In March 2023, Tata Consultancy Services (TCS), a global IT services and consulting firm, introduced its TCS Cognitive Plant Operations Adviser, a 5G-enabled solution, on the Microsoft Azure Private Mobile Edge Computing (PMEC) platform. This launch is aimed at helping industries such as manufacturing, oil and gas, consumer packaged goods, and pharmaceuticals enhance their production processes.
- In March 2023, Nuance Communications launched Dragon Ambient eXperience (DAX) Express. This innovative voice-enabled medical scribe application integrates OpenAI’s GPT-4 to automate clinical documentation by capturing physician-patient interactions and generating draft notes in seconds. This advancement aims to reduce administrative burdens for healthcare providers, enhance documentation accuracy, and ultimately alleviate physician burnout
Market Concentration & Characteristics
The Cognitive Computing Market is moderately concentrated, with a mix of established technology giants and emerging solution providers shaping its structure. Major players, including IBM, Google, Microsoft, and Oracle, hold significant market shares due to their broad product portfolios, global reach, and strong research capabilities. The market demonstrates a high level of technological intensity, driven by rapid advancements in artificial intelligence, natural language processing, and machine learning. It favors companies that can offer scalable, cloud-based solutions and real-time data processing capabilities. Competitive pressure remains high, encouraging continuous innovation and strategic partnerships. It is characterized by fast-evolving customer requirements, rising cross-industry adoption, and increasing demand for personalized, intelligent solutions. The market benefits from strong investments in digital transformation across healthcare, BFSI, retail, and security sectors. Barriers to entry persist due to the need for advanced technical expertise, substantial financial investment, and complex system integration capabilities. It remains sensitive to concerns about data privacy, system security, and regulatory compliance, which influence buyer decisions
Report Coverage
The research report offers an in-depth analysis based on Technology, Application, Deployment and Geography. It details leading market players, providing an overview of their business, product offerings, investments, revenue streams, and key applications. Additionally, the report includes insights into the competitive environment, SWOT analysis, current market trends, as well as the primary drivers and constraints. Furthermore, it discusses various factors that have driven market expansion in recent years. The report also explores market dynamics, regulatory scenarios, and technological advancements that are shaping the industry. It assesses the impact of external factors and global economic changes on market growth. Lastly, it provides strategic recommendations for new entrants and established companies to navigate the complexities of the market.
Future Outlook
- The Cognitive Computing market is expected to experience substantial growth driven by increasing adoption across healthcare, retail, and BFSI sectors.
- Advancements in artificial intelligence and machine learning will continue to enhance the capabilities of cognitive computing platforms.
- Cloud-based cognitive solutions will gain higher traction due to their scalability, flexibility, and cost-effectiveness.
- The demand for real-time data processing and decision-making will significantly boost market expansion.
- Integration of cognitive computing with IoT and edge computing will create new business opportunities.
- Natural Language Processing will remain a dominant technology, supporting customer service and automation growth.
- Asia Pacific will emerge as the fastest-growing regional market, driven by digital transformation in developing economies.
- Collaboration and strategic partnerships among key market players will intensify to support technological advancement.
- The growing need for personalized customer experiences will fuel the adoption of cognitive solutions in various industries.
- Data privacy, security, and regulatory compliance will remain critical challenges shaping market strategies and adoption rates.


