Market Overview:
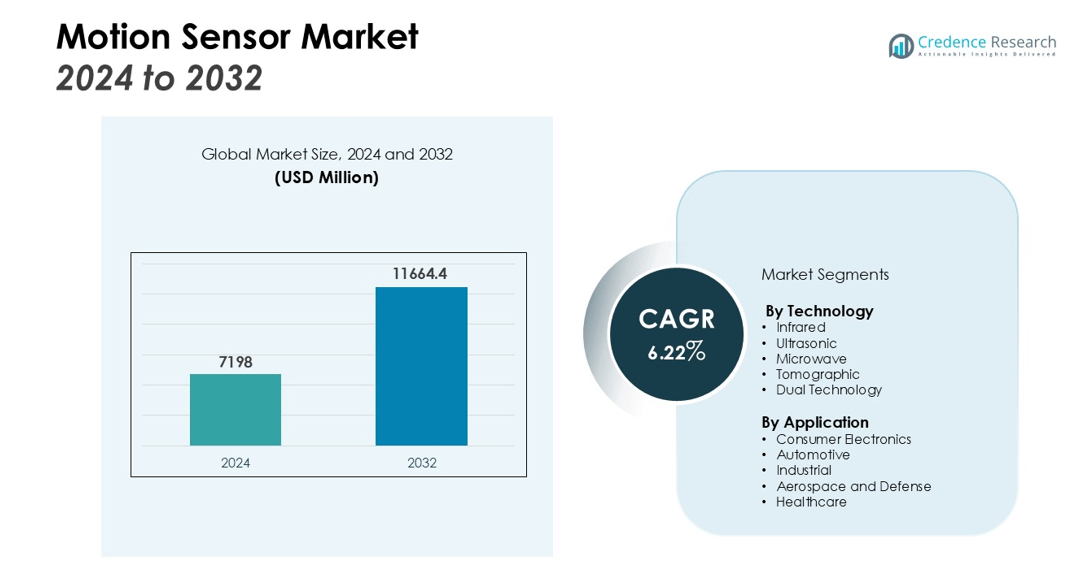
The Motion Sensor Market size was valued at USD 7198 million in 2024 and is anticipated to reach USD 11664.4 million by 2032, at a CAGR of 6.22% during the forecast period (2024-2032).
| REPORT ATTRIBUTE |
DETAILS |
| Historical Period |
2020-2023 |
| Base Year |
2024 |
| Forecast Period |
2025-2032 |
| Motion Sensor Market Size 2024 |
USD 7198 million |
| Motion Sensor Market, CAGR |
6.22% |
| Motion Sensor Market Size 2032 |
USD 11664.4 million |
Key growth drivers include the rapid integration of motion sensors into smart devices, advanced driver-assistance systems (ADAS), robotics, and IoT-based applications. The automotive industry remains a major consumer, leveraging these sensors for safety, stability control, and in-cabin monitoring. In consumer electronics, wearable devices, gaming consoles, and smartphones are increasingly adopting sophisticated motion-sensing capabilities to enhance user experience. Expanding use in industrial automation and aerospace for precision monitoring, predictive maintenance, and safety systems also contributes significantly to demand. Additionally, rising investment in smart infrastructure and building automation is further propelling market expansion globally.
Regionally, Asia-Pacific dominates the market, driven by strong electronics manufacturing, rapid industrialization, and increasing adoption of automation in China, Japan, South Korea, and India. North America maintains a substantial share, fueled by technological advancements, R&D investments, and high demand for automotive and aerospace applications. Europe shows steady growth, supported by smart manufacturing initiatives, stringent safety regulations, and a well-established automotive industry.
Market Insights:
- The Motion Sensor Market is valued at USD 7,198 million and is projected to reach USD 11,664.4 million by 2032, reflecting a CAGR of 6.22% during the forecast period.
- Strong demand is driven by integration into smart devices, advanced driver-assistance systems, robotics, and IoT-based applications.
- The automotive sector remains a major consumer, leveraging motion sensors for safety, stability control, and in-cabin monitoring.
- Industrial automation and robotics adoption enhance operational precision, predictive maintenance, and overall productivity.
- High costs of advanced sensors, complex integration, and environmental sensitivity remain significant market challenges.
- Asia-Pacific holds 46% market share, followed by North America at 28% and Europe at 18%, reflecting strong regional adoption patterns.
- Investments in smart infrastructure, connected systems, and building automation create long-term opportunities for market growth.
Access crucial information at unmatched prices!
Request your sample report today & start making informed decisions powered by Credence Research Inc.!
Download Sample
Market Drivers:
Rapid Integration of Motion Sensors in Consumer Electronics and Smart Devices
The Motion Sensor Market benefits significantly from widespread adoption in consumer electronics, including smartphones, wearable devices, gaming consoles, and smart home systems. It enables precise motion detection, enhancing user experience and device functionality. Manufacturers are embedding high-accuracy sensors to support gesture recognition, orientation tracking, and augmented reality applications. Rising consumer demand for interactive and intelligent devices continues to drive expansion. The trend toward miniaturized, energy-efficient sensors further supports market growth.
- For instance, TDK’s InvenSense platform is a 9-axis motion tracking device that integrates a gyroscope, accelerometer, and compass on a single chip for consumer electronics.
Expansion of Automotive Applications through Advanced Driver-Assistance Systems
Automotive adoption of motion sensors has accelerated, particularly in advanced driver-assistance systems (ADAS) and vehicle safety mechanisms. It provides real-time monitoring for stability control, collision avoidance, and in-cabin monitoring. Growing regulatory emphasis on vehicle safety standards reinforces the deployment of sophisticated sensor technologies. Automakers are investing heavily in integration to improve driver comfort and accident prevention. The shift toward electric and autonomous vehicles is further increasing demand for reliable motion-sensing solutions.
- For instance, Mobileye’s Surround ADAS platform is engineered to handle a suite of cameras and radars, integrating data from up to 11 sensors with a single system-on-chip.
Industrial Automation and Robotics Adoption Driving Demand
Industrial sectors are increasingly incorporating motion sensors into automation systems and robotics to enhance precision, productivity, and operational safety. It monitors machinery, tracks performance, and enables predictive maintenance, reducing downtime. Manufacturing facilities are investing in intelligent sensor networks for smart factory operations. The trend toward Industry 4.0 and robotics-led manufacturing accelerates market penetration. Continuous improvements in sensor durability and accuracy make it a critical component of modern industrial applications.
Growing Use in Aerospace and IoT-Based Monitoring Applications
The aerospace sector and IoT ecosystems rely on motion sensors for monitoring, navigation, and safety management. It supports aircraft stability, unmanned vehicle control, and real-time data collection. Governments and private companies are expanding investments in connected systems and smart infrastructure, boosting adoption. High demand for data-driven operations and precision monitoring strengthens its role across applications. Technological advancements in connectivity and sensor intelligence further enhance market opportunities.
Market Trends:
Advancements in Sensor Miniaturization and Enhanced Accuracy Driving Industry Evolution
The Motion Sensor Market is witnessing a strong focus on the development of smaller, lighter, and more precise sensors to meet the requirements of modern electronic devices and industrial applications. It delivers higher sensitivity, reduced power consumption, and faster response times, enabling integration into compact consumer electronics and wearable technology. Manufacturers are adopting advanced materials and MEMS-based designs to improve reliability and durability in harsh operating environments. The demand for seamless motion detection in augmented reality, virtual reality, and gaming applications continues to grow. Automotive and aerospace sectors increasingly rely on high-precision sensors for safety, navigation, and performance monitoring. Continuous innovation in calibration techniques and signal processing enhances accuracy and functionality, creating opportunities for market expansion. Rising investments in research and development support rapid technological advancements, positioning it as a core component of intelligent systems.
- For instance, Bosch Sensortec has advanced sensor miniaturization with its BMA580 MEMS accelerometer, which has a reduced component height of only 0.55 mm, making it suitable for compact wearable devices.
Integration with IoT and Expansion in Smart Infrastructure Applications
The adoption of motion sensors in IoT-enabled devices and smart infrastructure solutions is transforming operational efficiency across industries. It enables real-time monitoring, automation, and predictive analytics in smart homes, buildings, and industrial environments. Urban development projects increasingly incorporate sensor networks to optimize energy management, security, and environmental monitoring. Industrial automation systems leverage motion sensors to track equipment performance, improve safety, and enhance workflow efficiency. Growing demand for connected solutions in automotive, healthcare, and consumer electronics drives market adoption. Strategic collaborations between sensor manufacturers and IoT platform providers strengthen deployment capabilities. Improvements in wireless communication protocols and edge computing enhance the functionality and scalability of sensor-based solutions, reinforcing its critical role in the evolving technological landscape.
- For instance, Texas Instruments’ reference design for a wireless PIR motion detector enables integration into IoT networks by achieving over 10 years of battery life from a single coin cell battery.
Market Challenges Analysis:
High Implementation Costs and Complex Integration in Advanced Systems
The Motion Sensor Market faces challenges due to the high cost of advanced sensors and integration into complex electronic and industrial systems. It requires significant investment in research, development, and calibration to ensure precision and reliability. Small and medium enterprises may find adoption financially restrictive, limiting widespread deployment. Compatibility issues with existing hardware and software platforms can slow integration in automotive, aerospace, and industrial applications. Continuous updates and maintenance add operational expenses for end users. Manufacturers must balance performance improvements with cost efficiency to remain competitive. These financial and technical barriers can hinder rapid market penetration in emerging regions.
Sensitivity to Environmental Factors and Reliability Concerns
Motion sensors often encounter performance issues under extreme environmental conditions, posing a challenge for the Motion Sensor Market. It can experience signal drift, reduced accuracy, or failure in high temperature, humidity, or vibration-prone environments. Industrial and aerospace applications demand robust and consistent performance, which increases design complexity and testing requirements. Limited standardization across sensor types affects interoperability in multi-device ecosystems. Users require extensive validation and quality assurance to meet safety and regulatory standards. Manufacturers are investing in resilient materials and protective designs to enhance reliability and maintain market confidence.
Market Opportunities:
Expansion of Smart Home and IoT Applications Creating New Revenue Streams
The Motion Sensor Market presents significant opportunities through the growing adoption of smart home technologies and IoT-enabled devices. It enables real-time monitoring, automation, and energy management in residential and commercial spaces. Rising consumer demand for connected security systems, lighting control, and climate management drives market expansion. Integration with cloud platforms and AI-based analytics enhances functionality and user experience. Manufacturers can leverage partnerships with IoT solution providers to broaden deployment and reach. Increasing urbanization and digital infrastructure investments further support market growth. The convergence of motion sensors with intelligent systems opens new avenues for innovation and product differentiation.
Automotive and Industrial Automation Sectors Offering Strategic Growth Potential
The automotive industry and industrial automation sector provide substantial growth prospects for the Motion Sensor Market. It supports advanced driver-assistance systems, collision detection, and predictive maintenance in vehicles, boosting safety and operational efficiency. Industrial applications benefit from precision monitoring, workflow optimization, and enhanced equipment performance. Rising adoption of electric vehicles, autonomous technologies, and smart factories increases demand for reliable sensors. Collaborations between sensor manufacturers and original equipment manufacturers strengthen market penetration. Expansion into emerging economies with growing automotive and industrial infrastructure further enhances opportunity. Continuous technological advancements in durability, connectivity, and accuracy solidify its role in next-generation systems.
Market Segmentation Analysis:
By Technology
The Motion Sensor Market is segmented by technology into infrared, ultrasonic, microwave, tomographic, and dual technology sensors. It benefits from infrared sensors’ dominance due to their cost efficiency, low power consumption, and wide usage in consumer electronics and security systems. Ultrasonic sensors are gaining traction in industrial and automotive applications for precise object detection. Microwave and tomographic technologies offer extended range and reliability, supporting aerospace, defense, and high-end security solutions. Dual technology sensors combine multiple detection methods to reduce false alarms, increasing adoption in commercial and residential security systems.
- For instance, Northrop Grumman’s Advanced Technology Microwave Sounder (ATMS) for satellites has 22 channels that scan a wide range of frequencies from 23.8 GHz to 183.3 GHz to gather atmospheric data.
By Application
The market by application covers consumer electronics, automotive, industrial, aerospace and defense, and healthcare. It records significant demand in consumer electronics, including smartphones, wearable devices, and gaming consoles, driven by enhanced user interaction features. Automotive applications utilize motion sensors for advanced driver-assistance systems, stability control, and in-cabin monitoring, reflecting safety and automation priorities. Industrial use focuses on predictive maintenance, process automation, and robotic control to improve efficiency and precision. Aerospace and defense sectors deploy motion sensors for navigation, flight control, and safety systems. Healthcare applications include patient monitoring, rehabilitation devices, and medical imaging, contributing to steady adoption across the sector.
- For instance, Sonair has enhanced the safety of autonomous mobile robots in industrial settings with its 3D ultrasonic sensor.
Segmentations:
By Technology
- Infrared
- Ultrasonic
- Microwave
- Tomographic
- Dual Technology
By Application
- Consumer Electronics
- Automotive
- Industrial
- Aerospace and Defense
- Healthcare
By Region
- North America
- Europe
- UK
- France
- Germany
- Italy
- Spain
- Russia
- Belgium
- Netherlands
- Austria
- Sweden
- Poland
- Denmark
- Switzerland
- Rest of Europe
- Asia Pacific
- China
- Japan
- South Korea
- India
- Australia
- Thailand
- Indonesia
- Vietnam
- Malaysia
- Philippines
- Taiwan
- Rest of Asia Pacific
- Latin America
- Brazil
- Argentina
- Peru
- Chile
- Colombia
- Rest of Latin America
- Middle East
- UAE
- KSA
- Israel
- Turkey
- Iran
- Rest of Middle East
- Africa
- Egypt
- Nigeria
- Algeria
- Morocco
- Rest of Africa
Regional Analysis:
Asia-Pacific Leads Growth with Rapid Industrialization and Electronics Manufacturing
Asia-Pacific holds 46% of the global Motion Sensor Market, reflecting its dominance in electronics manufacturing and industrial automation. It benefits from widespread adoption in consumer electronics, automotive, and industrial sectors. Government initiatives supporting smart infrastructure and Industry 4.0 deployment reinforce demand. Rising investment in robotics, smart factories, and connected devices accelerates market penetration. The region’s competitive manufacturing landscape encourages continuous innovation and cost-effective production, strengthening its position.
North America Maintains Strong Position through Technological Advancements and R&D Investments
North America accounts for 28% of the global Motion Sensor Market, supported by advanced technology adoption and high research and development investments. It drives demand in automotive, aerospace, and industrial automation applications. Leading sensor manufacturers and OEMs in the United States and Canada invest heavily in innovative solutions to enhance precision, reliability, and connectivity. Smart city initiatives and expanding IoT infrastructure further strengthen growth. Consumer electronics and healthcare sectors contribute to consistent demand. The region’s robust regulatory framework ensures safety and quality standards, maintaining confidence.
Europe Experiences Steady Expansion Supported by Smart Manufacturing and Automotive Applications
Europe represents 18% of the global Motion Sensor Market, driven by strong automotive and industrial sectors in Germany, France, and the United Kingdom. It supports deployment in advanced driver-assistance systems, industrial automation, and robotics applications. Smart manufacturing initiatives and digitalization projects enhance operational efficiency and precision. Demand for connected infrastructure, energy management systems, and building automation fuels adoption. Regional emphasis on sustainability and regulatory compliance drives investment in high-performance sensors. Manufacturers focus on innovation and strategic partnerships to maintain competitiveness.
Shape Your Report to Specific Countries or Regions & Enjoy 30% Off!
Key Player Analysis:
Competitive Analysis:
The Motion Sensor Market features a competitive landscape driven by technological innovation, product differentiation, and strategic partnerships. Leading companies focus on developing high-precision, low-power, and miniaturized sensors to meet the evolving demands of consumer electronics, automotive, and industrial sectors. It is characterized by strong competition among global players such as Bosch Sensortec, STMicroelectronics, Murata Manufacturing, Honeywell International, and InvenSense, each leveraging advanced R&D capabilities to expand product portfolios. Companies are strengthening market presence through mergers, acquisitions, and collaborations with OEMs and IoT solution providers. Expansion into emerging markets, investment in smart infrastructure, and integration with AI and IoT platforms are key growth strategies. Continuous innovation in materials, sensing accuracy, and connectivity features allows competitors to address performance challenges and cater to a diverse range of applications. This competitive environment fosters rapid technological advancement and sustains growth momentum across multiple industry verticals.
Recent Developments:
- In January 2025, Honeywell and NXP Semiconductors announced an expanded partnership at CES 2025 to accelerate the development of aviation technology, including products for autonomous flight.
- In January 2025, NXP Semiconductors expanded its partnership with Honeywell to advance aviation technology, focusing on developing AI-driven solutions for autonomous flight and next-generation cockpits.
Market Concentration & Characteristics:
The Motion Sensor Market exhibits moderate to high concentration, with a mix of established global players and specialized regional manufacturers competing for market share. It is characterized by strong technological differentiation, continuous innovation, and high entry barriers due to advanced R&D requirements and strict performance standards. Leading companies maintain a competitive edge through extensive product portfolios, global distribution networks, and integration with emerging technologies such as AI, IoT, and Industry 4.0 solutions. The market demonstrates steady demand across consumer electronics, automotive, industrial, aerospace, and healthcare sectors, driven by the need for precision, reliability, and energy efficiency. Competitive dynamics are shaped by strategic collaborations, mergers, and acquisitions aimed at expanding technological capabilities and geographic reach.
Report Coverage:
The research report offers an in-depth analysis based on Technology, Application and Region. It details leading market players, providing an overview of their business, product offerings, investments, revenue streams, and key applications. Additionally, the report includes insights into the competitive environment, SWOT analysis, current market trends, as well as the primary drivers and constraints. Furthermore, it discusses various factors that have driven market expansion in recent years. The report also explores market dynamics, regulatory scenarios, and technological advancements that are shaping the industry. It assesses the impact of external factors and global economic changes on market growth. Lastly, it provides strategic recommendations for new entrants and established companies to navigate the complexities of the market.
Future Outlook:
- Demand for motion sensors will grow with increasing adoption of smart devices and connected home solutions.
- Integration with AI and IoT platforms will enhance performance, adaptability, and predictive analytics capabilities.
- Automotive applications will expand, driven by the evolution of autonomous driving and advanced driver-assistance systems.
- Industrial automation will create sustained demand for sensors offering high precision and durability in harsh environments.
- Healthcare adoption will rise, supported by the development of wearable monitoring devices and rehabilitation technologies.
- Technological advancements in miniaturization and low-power designs will support integration into compact consumer electronics.
- Aerospace and defense sectors will leverage motion sensors for navigation, safety systems, and unmanned vehicle operations.
- Demand for energy-efficient and sustainable sensor solutions will increase with global environmental regulations.
- Emerging economies will offer growth opportunities through investments in smart infrastructure and manufacturing automation.
- Strategic collaborations between sensor manufacturers and OEMs will drive innovation and accelerate product deployment across industries.


