Home » Semiconductor & Electronics » Commercial Printing Market

Commercial Printing Market By Printing technology (Digital Printing, Lithography Printing, Flexographic, Screen Printing) By Application (Packaging, Advertising, Publishing)-Growth, Future Prospects & Competitive Analysis, 2016 – 2030

Price: $4699

Published: | Report ID: 19497 | Report Format : PDF

Key Highlights of the Report

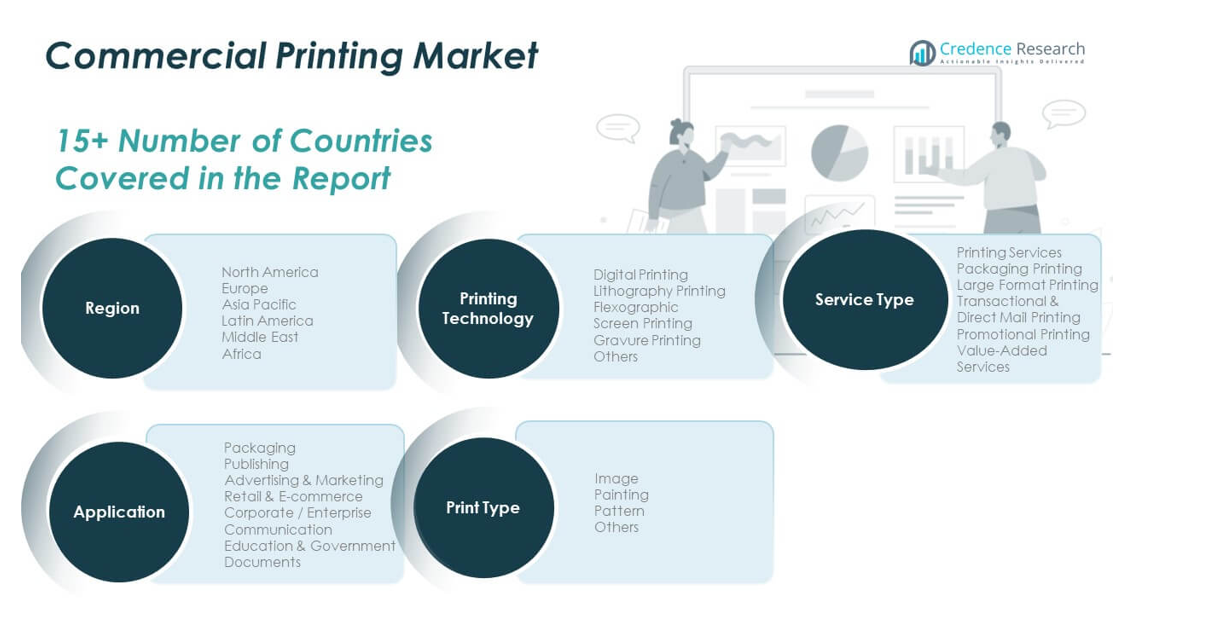
The global commercial printing market is segmented by printing technology, application, and region. Lithography printings are expected to have the highest CAGR, while digital printing held the largest share. The packaging segment had the highest revenue., with the advertising segment having the highest CAGR, with Asia Pacific leading the market growth.

The global commercial printing market has several drivers, including businesses’ growing need for marketing collateral like brochures and pamphlets. Hence, one of the most effective marketing strategies is advertising. the capacity to generate higher-quality goods is made possible by the growth of technology, which includes quicker printing presses and new color and toner technologies. The advancement of printing technology has also demonstrated that printing in large quantities is efficient and affordable. In addition, cost-effectiveness has the potential to mitigate some of the restraints that digital media may have on printing services. Another important factor in the target market’s expansion is the e-commerce sector’s rising demand for packaging and labeling. However, the market also faces significant challenges, such as the rising cost of raw materials during procurement.

Nonetheless, the global commercial printing market offers significant growth opportunities, including. Since global e-commerce businesses quickly embrace cutting-edge printing solutions for their regular packaging, the rising e-commerce market presents a profitable potential for commercial printing providers.

Design Element 2

Access crucial information at unmatched prices!

Request your free sample report today & start making informed decisions powered by Credence Research!

Download Free Sample

CTA Design Element 3

Market Overview

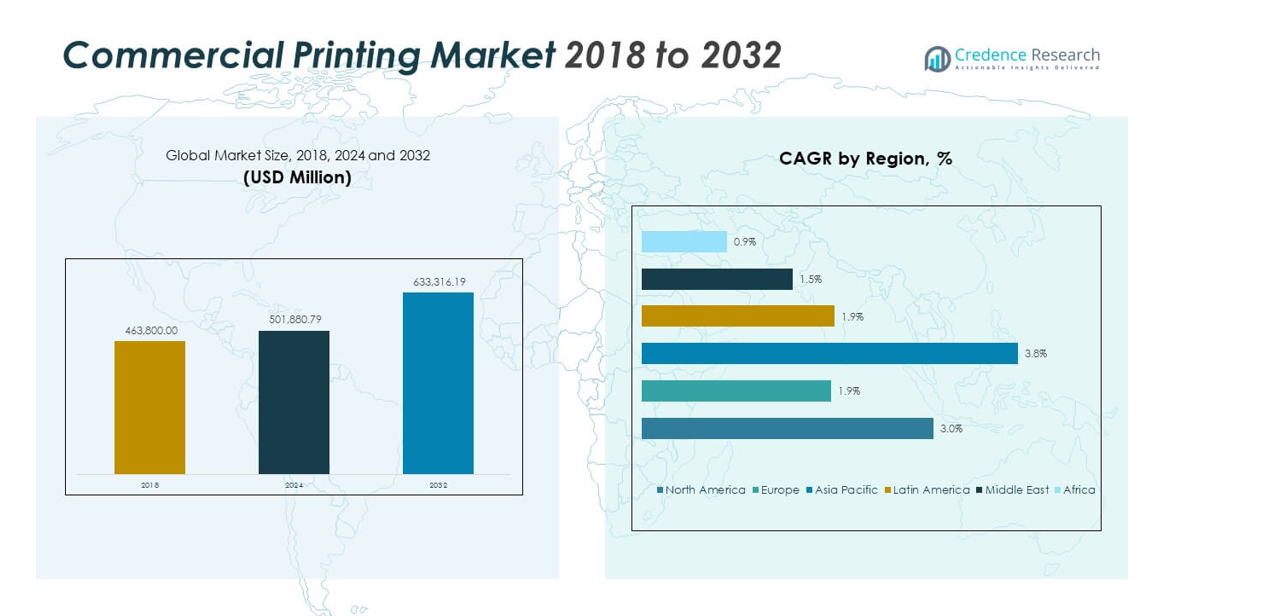
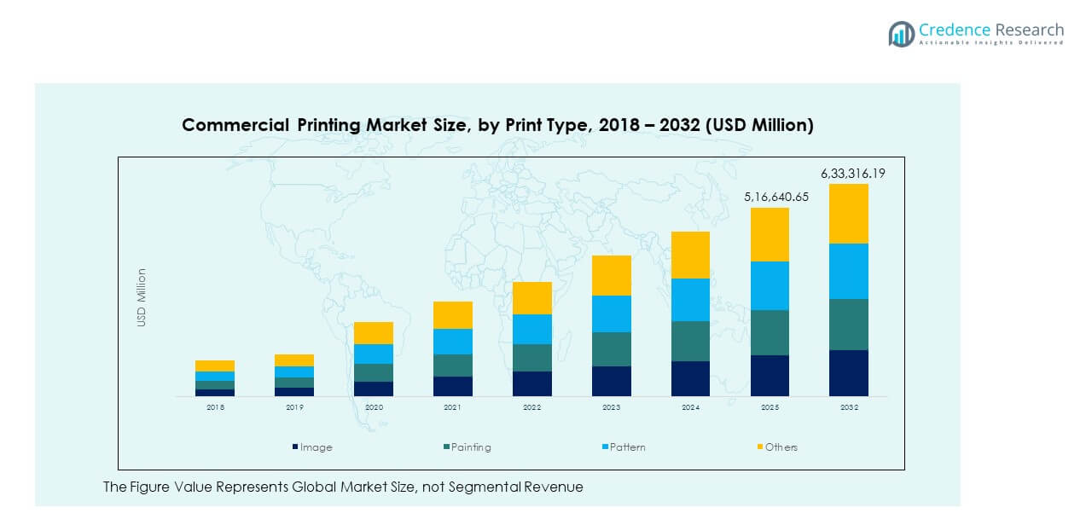
The global commercial printing market has witnessed steady growth in recent years and is expected to continue growing at a CAGR of 3.10% between 2023 and 2030. The market was valued at USD 481.8 billion in 2022 and is expected to reach USD 596.6 billion in 2030.

What Are The Main Drivers Of The Global Commercial Printing Market?

The factors driving the market for commercial printing globally are several factors, including the development of new technologies, particularly digital printing, and the rising necessity for advertising across many industry sectors.

What Are The Major Challenges Faced By The Global Commercial Printing Market?

The global commercial printing market also faces several among the difficulties are the rising cost of basic materials. during procurement.

What Are The Growth Opportunities In The Global Commercial Printing Market?

The global commercial printing market offers significant growth opportunities, including. Since global e-commerce businesses quickly embrace cutting-edge printing solutions for their regular packaging, the rising e-commerce market presents a profitable potential for commercial printing providers.

Executive Summary

Overview of the Global Commercial Printing Market

The global commercial printing market has steadily grown, driven by new technologies, particularly digital printing, and the rising necessity for advertising across many industry sectors. The market is distinguished by a vast array of printing technologys and applications, catering to diverse consumer preferences.

Market Definition

“commercial printing” refers to a group of services, including layout design, binding, composition, and press productions, used to print artwork and text on paper and cards. Flyers, brochures, booklets, posters, periodicals, newsletters, transactional bills and statements, and other materials are used in commercial printing. Making enormous displays with eye-catching patterns is crucial that draw in customers. As a result, it is frequently utilized in the packaging, food and beverage, pharmaceutical, and publishing industries.

Market Insights

  • The global demand for commercial printings was valued at USD 481.8 Billion in 2022 and is expected to reach USD 596.6 Billion in 2030, growing at a CAGR of 3.10% between 2023 and 2030.
  • Lithography printing is the leading segment by printing technology and held over 43.82% share in terms of value in 2022, while the digital printing segment is likely to exhibit the fastest CAGR during the forecast period.
  • The packaging segment governs the demand for commercial printings globally, holding a massive share of over 53.77% in 2022, and the advertising segment is expected to grow at a rapid CAGR.
  • Asia Pacific is fueling the growth of the commercial printing industry with over one-third share in 2022, while North America and Europe collectively account for just under 50% share in 2022. Europe held over 22% share in 2022.
  • The regional expansion is mostly the result of developments in the print business, particularly in China and India and using digital technology. At the same time, the rising cost of raw materials during the procurement process is the main restraint.
  • Since global e-commerce businesses are quickly embracing cutting-edge printing solutions for their regular packaging, the rising e-commerce market presents a profitable potential for commercial printing providers to be the major opportunities in the market.

Segmentation by Printing technology

  • Lithography printing is the leading segment by printing technology and held over 43.82% share in value in 2022.
  • The digital printing segment will likely exhibit the fastest CAGR during the forecast period.

Segmentation by Application

  • The packaging segment governs the demand for commercial printings worldwide, holding a massive share of over 80% in 2022, and advertising is also expected to grow at a rapid CAGR.
  • The adult segment contributes the rest to the demand for commercial printings.

Segmentation by Region

  • Asia Pacific is fueling the growth of the commercial printing industry with over one-third share in 2022.
  • North America and Europe collectively account for just under 50% share in 2022, with Europe holding over 22% share in the same year.
  • The rest of the World, including Latin America, The Middle East, and Africa, contributes the remainder to the demand for commercial printings.

The increasing demand for commercial printing can be attributed to the growing adoption of commercial printing across numerous industries, including packaging, print media, publishing, etc., to generate flyers, brochures, books, posters, magazines, and other similar items. However, the market is restrained by the rising cost of raw materials during the procurement process.

The United States is one of North America’s largest commercial printing markets, with a significant share of the market. The local boom is the result of an increase in the demand for commercial printing for marketing, packaging, labelling, and advertising. Furthermore, it is anticipated that significant local companies like Acme Printing, Quad/Graphics Inc., Cenevo, and RR Donnelley would enhance the industry’s growth.

China is also a major market for commercial printings in the Asia Pacific region, with a significant market share. Regional expansion is primarily due to developments in the print sector, such as digital technology, particularly in China and India. Modern commercial printers have replaced traditional printers as a result of their high-speed capabilities. Additionally, the region’s booming e-commerce industry and well-organized retail sector offer tremendous opportunities for packaging growth in the packaging application, supporting the target market.

Overall, the increasing demand for commercial printing can be attributed to the development of new technologies, particularly digital printing, and the rising necessity for advertising across many industry sectors.

While the commercial printing market is growing, it faces challenges from the rising cost of raw materials during procurement. Manufacturers are innovating and forming partnerships to stay competitive.

Demand for Packaging and Labelling is Rising, Driving the Industry.

The target market is expanding dramatically due to the rising demand for packaging and labeling from the e-commerce sector. The size of the commercial printing business is growing as e-commerce companies like Amazon, eBay, and Target employ cutting-edge packaging techniques like additive manufacturing and AI-powered design tools to improve the packaging. Market participants from the warehouse, logistics, and retail industries are investing in hybrid print technology. The advantages of analog and digital technologies can be combined with the aid of hybrid technology.

The need for print among consumers is increasing, which is driving up sales in the commercial printing industry. As soon as an order is placed, products are produced using the order delivery mechanism known as “print-on-demand.” For a variety of products, POD enables users to acquire bespoke designs. The growth of the target market is further aided by consumers’ rising demand for customization and personalization.

commercial printing market

A Significant Trend In Vendor Consolidation

A significant trend of vendor consolidation is impacting the expansion of the commercial printing sector. During the projection period, vendors in this market plan to expand their companies beyond only providing print goods and services. They are enlarging their scope of offerings to incorporate logistics, managed services, media services, and digital technologies.

Typically, vendors obtain the materials needed for printing, though occasionally, the customer supplies the resources. The printed contents are then printed, posted, and co-mailed. However, suppliers like LSC Communications are stepping up their supply chain logistics efforts. By integrating forward, commercial printing providers will unite into an end-to-end print goods and services industry. This plan is anticipated to fuel market expansion during the

Price Pressure and Oversupply.

Major obstacles, including overcapacity and pricing competition, limit the expansion of the commercial printing business. Specific obstacles exist in this highly fragmented and intensely competitive sector. Vendors like Quad Graphics and Cenveo claim that because of the industry’s decreased output, there is excess manufacturing capacity, which harms prices.

Due to the shift in demand, the surplus capacity has forced vendors with larger printers to use more efficient technology to achieve economies of scale and obtain access to capital markets. These suppliers will also consider consolidation and acquisition possibilities to eliminate extra, ineffective, or underutilized capacity and save expenses. These elements are projected to negatively affect the market’s expansion during the forecast period.

Rising E-commerce

As e-commerce firms quickly adopt cutting-edge printing solutions for their routine packaging, the expanding e-commerce market around the world presents a profitable potential for commercial printing providers. The related parties, including logistics, warehousing, and retail brands, have started to invest in technologies tailored to the particular needs of e-commerce as it increases its relative proportion of brick-and-mortar retail sales.

Competitive Landscape

Key Players

The global commercial printing market is highly competitive, with the presence of several key players. Some of the major players in the market and their market share are as follows:

  • Quad/Graphics Inc.
  • Acme Printing
  • Cenveo
  • RR Donnelley
  • Transcontinental Inc.
  • LSC Communications US, LLC.
  • Gorham Printing, Inc.
  • Dai Nippon Printing
  • The Magazine Printing Company
  • Cimpress plc
  • Quebecor World Inc.
  • HH Global
  • Cimpress PLC

These companies focus on product innovation, expanding their distribution channels, and mergers and acquisitions to stay ahead in the market.

The major players in the global commercial printing market are constantly striving to stay ahead by introducing new products and innovations.

R.R. Donnelley (RRD) unveiled Helium in May 2022, an editorial solution that allows professionals access to specialised copywriting, content optimisation, and project management. Brands may have access to hundreds of subject matter experts who can contribute content using this service through a single entry point.

Quad/Graphics announced the acquisition of LSC Communications US, LLC in October 2018. With the aid of the acquisition, Quad was able to focus on the company’s 3.0 strategy and expand its capabilities.

The Panther UV inkjet technology portfolio of Xeikon was expanded in October 2021 with the announcement of two new label presses, the PX3300 and PX2200, which will aid in digitizing print manufacturing. The Xeikon PX2200 and PX3300 use Panther DuraCure UV technology from the firm to create high-gloss labels with excellent scratch resistance. This is said to offer a broad color range and long-term durability for applications such as industrial, chemical, home, and high-end labels for the premium beverage, health, and beauty industries.

Shape Your Report to Specific Countries or Regions & Enjoy 30% Off!

Summary of Key Findings

  • The development of new technologies, particularly digital printing, as well as the rising necessity for advertising across many industry sectors driving market growth
  • Market segmented by printing technology, application, and region.
  • Lithography printing commercial printings are the most popular user segment.
  • Packaging is most commonly used for the Outlook application.
  • Asia Pacific is leading market growth; the market is highly competitive with key players including Acme Printing; Quad/Graphics Inc.; Cenveo; Transcontinental Inc.; LSC Communications US, LLC.; Gorham Printing, Inc.; RR Donnelley; Dai Nippon Printing; Cimpress plc; Quebecor World Inc.; The Magazine Printing Company; HH Global; Cimpress PLC.

Future Outlook

  • Positive outlook for the global commercial printing market with significant growth potential in the Asia Pacific region
  • Since global e-commerce businesses quickly embrace cutting-edge printing solutions for their regular packaging, the rising e-commerce market presents a profitable potential for commercial printing providers to drive growth.
  • Challenges from the rising cost of raw materials during the procurement process.
  • Key players to focus on product innovation, expanding market reach and maintaining competitive pricing to stay ahead in the market.

Segmentation

  • By Printing technology
    • Digital Printing
    • Lithography Printing
    • Flexographic
    • Screen Printing
    • Gravure Printing
    • Others
  • By Application
    • Packaging
    • Advertising
    • Publishing
    • Books
    • Newspaper
    • Magazines
    • Others
  • By Region
  • North America
    • The US.
    • Canada
    • Mexico
  • Europe
    • Germany
    • France
    • The U.K.
    • Italy
    • Spain
    • Rest of Europe
  • Asia Pacific
    • China
    • Japan
    • India
    • South Korea
    • South-east Asia
    • Rest of Asia Pacific
  • Latin America
    • Brazil
    • Argentina
    • Rest of Latin America
  • Middle East & Africa
    • GCC Countries
    • South Africa
    • Rest of the Middle East and Africa

1. Preface
1.1. Report Description
1.1.1. Purpose of the Report
1.1.2. Target Audience
1.1.3. USP and Key Offerings
1.2. Research Scope
1.3. Research Methodology
1.3.1. Phase I – Secondary Research
1.3.2. Phase II – Data Modelling
1.3.2.1. Company Share Analysis Model
1.3.2.2. Revenue Based Modelling
1.3.3. Phase III – Primary Research
1.3.4. Research Limitations
1.3.5. Assumptions
1.4. Market Introduction
1.5. Market Research Scope
2. Executive Summary
2.1. Market Snapshot: Global Commercial Printing Market
2.2. Global Commercial Printing Market, By Printing technology
2.3. Global Commercial Printing Market, By Application
2.4. Global Commercial Printing Market, By Region

3. Market Dynamics & Factors Analysis
3.1. Introduction
3.1.1. Global Commercial Printing Market Value, 2017-2030, (US$ Bn)
3.1.2. Y-o-Y Growth Trend Analysis
3.2. Market Dynamics
3.2.1. Market Drivers
3.2.2. Market Restraints
3.2.3. Market Opportunities
3.2.4. Major Industry Challenges
3.3. Growth and Development Patterns
3.4. Investment Feasibility Analysis
3.5. Market Opportunity Analysis
3.5.1. Printing technology
3.5.2. Application
3.5.3. Geography

4. Premium Insights
4.1. STAR (Situation, Task, Action, Results) Analysis
4.2. Porter’s Five Forces Analysis
4.2.1. Threat of New Entrants
4.2.2. Bargaining Power of Buyers/Consumers
4.2.3. Bargaining Power of Suppliers
4.2.4. Threat of Substitute Types
4.2.5. Intensity of Competitive Rivalry
4.3. Key Market Trends
4.3.1. Demand Side Trends
4.3.2. Supply Side Trends
4.4. Value Chain Analysis
4.5. Printing technology Analysis
4.6. Analysis and Recommendations
4.7. Marketing Strategy Analysis
4.7.1. Direct Marketing
4.7.2. Indirect Marketing
4.7.3. Marketing Channel Development Trend

5. Market Positioning of Key Players, 2022
5.1. Company market share of key players, 2022
5.2. Competitive Benchmarking
5.3. Market Positioning of Key Vendors
5.4. Geographical Presence Analysis
5.5. Major Strategies Adopted by Key Players
5.5.1. Key Strategies Analysis
5.5.2. Mergers and Acquisitions
5.5.3. Partnerships
5.5.4. Product Launch
5.5.5. Geographical Expansion
5.5.6. Others

6. Economic Impact Analysis
6.1. Recession Impact
6.1.1. North America
6.1.2. Europe
6.1.3. Asia Pacific
6.1.4. Latin America
6.1.5. Middle East and Africa
6.2. Ukraine-Russia War Impact
6.2.1. North America
6.2.2. Europe
6.2.3. Asia Pacific
6.2.4. Latin America
6.2.5. Middle East and Africa
6.3. COVID-19 Impact Analysis
6.3.1. North America
6.3.2. Europe
6.3.3. Asia Pacific
6.3.4. Latin America
6.3.5. Middle East and Africa

7. Global Commercial Printing Market, By Printing technology
7.1. Global Commercial Printing Market Overview, by Printing technology
7.1.1. Global Commercial Printing Market Revenue Share, By Printing technology, 2022 Vs 2030 (in %)
7.2. Digital Printing
7.2.1. Global Commercial Printing Market, By Region, 2017-2030 (US$ Bn)
7.3. Lithography Printing
7.3.1. Global Commercial Printing Market, By Region, 2017-2030 (US$ Bn)
7.4. Flexographic
7.4.1. Global Commercial Printing Market, By Region, 2017-2030 (US$ Bn)
7.5. Screen Printing
7.5.1. Global Commercial Printing Market, By Region, 2017-2030 (US$ Bn)
7.6. Gravure Printing
7.6.1. Global Commercial Printing Market, By Region, 2017-2030 (US$ Bn)
7.7. Others
7.7.1. Global Commercial Printing Market, By Region, 2017-2030 (US$ Bn)

8. Global Commercial Printing Market, By Application
8.1. Global Commercial Printing Market Overview, by Application
8.1.1. Global Commercial Printing Market, By Application, 2022 vs 2030 (in %)
8.2. Packaging
8.2.1. Global Commercial Printing Market, By Region, 2017-2030 (US$ Bn)
8.3. Advertising
8.3.1. Global Commercial Printing Market, By Region, 2017-2030 (US$ Bn)
8.4. Publishing
8.4.1. Global Commercial Printing Market, By Region, 2017-2030 (US$ Bn)
8.5. Books
8.5.1. Global Commercial Printing Market, By Region, 2017-2030 (US$ Bn)
8.6. Newspaper
8.6.1. Global Commercial Printing Market, By Region, 2017-2030 (US$ Bn)
8.7. Magazines
8.7.1. Global Commercial Printing Market, By Region, 2017-2030 (US$ Bn)
8.8. Others
8.8.1. Global Commercial Printing Market, By Region, 2017-2030 (US$ Bn)

9. Global Commercial Printing Market, By Region
9.1. Global Commercial Printing Market Overview, by Region
9.1.1. Global Commercial Printing Market, By Region, 2022 vs 2030 (in%)
9.2. Printing technology
9.2.1. Global Commercial Printing Market, By Printing technology, 2017-2030 (US$ Bn)
9.3. Application
9.3.1. Global Commercial Printing Market, By Application, 2017-2030 (US$ Bn)

10. North America Commercial Printing Market Analysis
10.1. North America Commercial Printing Market, by Printing technology, 2017-2030(US$ Bn)
10.1.1. Overview
10.1.2. SRC Analysis
10.2. North America Commercial Printing Market, by Application, 2017-2030(US$ Bn)
10.2.1. Overview
10.2.2. SRC Analysis
10.3. North America Commercial Printing Market, by Country, 2017-2030 (US$ Bn)
10.3.1. North America Commercial Printing Market, by Country, 2022 Vs 2030 (in%)
10.3.2. U.S.
10.3.2.1. U.S. Commercial Printing Market Estimates and Forecast, 2017-2030 (US$ Bn)
10.3.2.2. U.S. Commercial Printing, By Printing technology, 2017-2030 (US$ Bn)
10.3.2.3. U.S. Commercial Printing, By Application, 2017-2030 (US$ Bn)
10.3.3. Canada
10.3.3.1. Canada Commercial Printing Market Estimates and Forecast, 2017-2030 (US$ Bn)
10.3.3.2. Canada Commercial Printing, By Printing technology, 2017-2030 (US$ Bn)
10.3.3.3. Canada Commercial Printing, By Application, 2017-2030 (US$ Bn)
10.3.4. Mexico
10.3.4.1. Mexico Commercial Printing Market Estimates and Forecast, 2017-2030 (US$ Bn)
10.3.4.2. Mexico Commercial Printing, By Printing technology, 2017-2030 (US$ Bn)
10.3.4.3. Mexico Commercial Printing, By Application, 2017-2030 (US$ Bn)

11. Europe Commercial Printing Market Analysis
11.1. Europe Commercial Printing Market, by Printing technology, 2017-2030(US$ Bn)
11.1.1. Overview
11.1.2. SRC Analysis
11.2. Europe Commercial Printing Market, by Application, 2017-2030(US$ Bn)
11.2.1. Overview
11.2.2. SRC Analysis
11.3. Europe Commercial Printing Market, by Country, 2017-2030 (US$ Bn)
11.3.1. Europe Commercial Printing Market, by Country, 2022 Vs 2030 (in%)
11.3.2. Germany
11.3.2.1. Germany Commercial Printing Market Estimates and Forecast, 2017-2030 (US$ Bn)
11.3.2.2. Germany Commercial Printing, By Printing technology, 2017-2030 (US$ Bn)
11.3.2.3. Germany Commercial Printing, By Application, 2017-2030 (US$ Bn)
11.3.3. France
11.3.3.1. France Commercial Printing Market Estimates and Forecast, 2017-2030 (US$ Bn)
11.3.3.2. France Commercial Printing, By Printing technology, 2017-2030 (US$ Bn)
11.3.3.3. France Commercial Printing, By Application, 2017-2030 (US$ Bn)
11.3.4. UK
11.3.4.1. UK Commercial Printing Market Estimates and Forecast, 2017-2030 (US$ Bn)
11.3.4.2. UK Commercial Printing, By Printing technology, 2017-2030 (US$ Bn)
11.3.4.3. UK Commercial Printing, By Application, 2017-2030 (US$ Bn)
11.3.5. Italy
11.3.5.1. Italy Commercial Printing Market Estimates and Forecast, 2017-2030 (US$ Bn)
11.3.5.2. Italy Commercial Printing, By Printing technology, 2017-2030 (US$ Bn)
11.3.5.3. Italy Commercial Printing, By Application, 2017-2030 (US$ Bn)
11.3.6. Spain
11.3.6.1. Spain Commercial Printing Market Estimates and Forecast, 2017-2030 (US$ Bn)
11.3.6.2. Spain Commercial Printing, By Printing technology, 2017-2030 (US$ Bn)
11.3.6.3. Spain Commercial Printing, By Application, 2017-2030 (US$ Bn)
11.3.7. Rest of Europe
11.3.7.1. Rest of Europe Commercial Printing Market Estimates and Forecast, 2017-2030 (US$ Bn)
11.3.7.2. Rest of Europe Commercial Printing, By Printing technology, 2017-2030 (US$ Bn)
11.3.7.3. Rest of Europe Commercial Printing, By Application, 2017-2030 (US$ Bn)

12. Asia Pacific Commercial Printing Market Analysis
12.1. Asia Pacific Commercial Printing Market, by Printing technology, 2017-2030(US$ Bn)
12.1.1. Overview
12.1.2. SRC Analysis
12.2. Asia Pacific Commercial Printing Market, by Application, 2017-2030(US$ Bn)
12.2.1. Overview
12.2.2. SRC Analysis
12.3. Asia Pacific Commercial Printing Market, by Country, 2017-2030 (US$ Bn)
12.3.1. Asia Pacific Commercial Printing Market, by Country, 2022 Vs 2030 (in%)
12.3.2. China
12.3.2.1. China Commercial Printing Market Estimates and Forecast, 2017-2030 (US$ Bn)
12.3.2.2. China Commercial Printing, By Printing technology, 2017-2030 (US$ Bn)
12.3.2.3. China Commercial Printing, By Application, 2017-2030 (US$ Bn)
12.3.3. Japan
12.3.3.1. Japan Commercial Printing Market Estimates and Forecast, 2017-2030 (US$ Bn)
12.3.3.2. Japan Commercial Printing, By Printing technology, 2017-2030 (US$ Bn)
12.3.3.3. Japan Commercial Printing, By Application, 2017-2030 (US$ Bn)
12.3.4. India
12.3.4.1. India Commercial Printing Market Estimates and Forecast, 2017-2030 (US$ Bn)
12.3.4.2. India Commercial Printing, By Printing technology, 2017-2030 (US$ Bn)
12.3.4.3. India Commercial Printing, By Application, 2017-2030 (US$ Bn)
12.3.5. South Korea
12.3.5.1. South Korea Commercial Printing Market Estimates and Forecast, 2017-2030 (US$ Bn)
12.3.5.2. South Korea Commercial Printing, By Printing technology, 2017-2030 (US$ Bn)
12.3.5.3. South Korea Commercial Printing, By Application, 2017-2030 (US$ Bn)
12.3.6. South-East Asia
12.3.6.1. South-East Asia Commercial Printing Market Estimates and Forecast, 2017-2030 (US$ Bn)
12.3.6.2. South-East Asia Commercial Printing, By Printing technology, 2017-2030 (US$ Bn)
12.3.6.3. South-East Asia Commercial Printing, By Application, 2017-2030 (US$ Bn)
12.3.7. Rest of Asia Pacific
12.3.7.1. Rest of Asia Pacific Commercial Printing Market Estimates and Forecast, 2017-2030 (US$ Bn)
12.3.7.2. Rest of Asia Pacific Commercial Printing, By Printing technology, 2017-2030 (US$ Bn)
12.3.7.3. Rest of Asia Pacific Commercial Printing, By Application, 2017-2030 (US$ Bn)

13. Latin America Commercial Printing Market Analysis
13.1. Latin America Commercial Printing Market, by Printing technology, 2017-2030(US$ Bn)
13.1.1. Overview
13.1.2. SRC Analysis
13.2. Latin America Commercial Printing Market, by Application, 2017-2030(US$ Bn)
13.2.1. Overview
13.2.2. SRC Analysis
13.3. Latin America Commercial Printing Market, by Country, 2017-2030 (US$ Bn)
13.3.1. Latin America Commercial Printing Market, by Country, 2022 Vs 2030 (in%)
13.3.2. Brazil
13.3.2.1. Brazil Commercial Printing Market Estimates and Forecast, 2017-2030 (US$ Bn)
13.3.2.2. Brazil Commercial Printing, By Printing technology, 2017-2030 (US$ Bn)
13.3.2.3. Brazil Commercial Printing, By Application, 2017-2030 (US$ Bn)
13.3.3. Argentina
13.3.3.1. Argentina Commercial Printing Market Estimates and Forecast, 2017-2030 (US$ Bn)
13.3.3.2. Argentina Commercial Printing, By Printing technology, 2017-2030 (US$ Bn)
13.3.3.3. Argentina Commercial Printing, By Application, 2017-2030 (US$ Bn)
13.3.4. Rest of Latin America
13.3.4.1. Rest of Latin America Commercial Printing Market Estimates and Forecast, 2017-2030 (US$ Bn)
13.3.4.2. Rest of Latin America Commercial Printing, By Printing technology, 2017-2030 (US$ Bn)
13.3.4.3. Rest of Latin America Commercial Printing, By Application, 2017-2030 (US$ Bn)

14. Middle East and Africa Commercial Printing Market Analysis
14.1. Middle East and Africa Commercial Printing Market, by Printing technology, 2017-2030(US$ Bn)
14.1.1. Overview
14.1.2. SRC Analysis
14.2. Middle East and Africa Commercial Printing Market, by Application, 2017-2030(US$ Bn)
14.2.1. Overview
14.2.2. SRC Analysis
14.3. Middle East and Africa Commercial Printing Market, by Country, 2017-2030 (US$ Bn)
14.3.1. Middle East and Africa Commercial Printing Market, by Country, 2022 Vs 2030 (in%)
14.3.2. GCC Countries
14.3.2.1. GCC Countries Commercial Printing Market Estimates and Forecast, 2017-2030 (US$ Bn)
14.3.2.2. GCC Countries Commercial Printing, By Printing technology, 2017-2030 (US$ Bn)
14.3.2.3. GCC Countries Commercial Printing, By Application, 2017-2030 (US$ Bn)
14.3.3. South Africa
14.3.3.1. South Africa Commercial Printing Market Estimates and Forecast, 2017-2030 (US$ Bn)
14.3.3.2. South Africa Commercial Printing, By Printing technology, 2017-2030 (US$ Bn)
14.3.3.3. South Africa Commercial Printing, By Application, 2017-2030 (US$ Bn)
14.3.4. Rest of Middle East and Africa
14.3.4.1. Rest of Middle East and Africa Commercial Printing Market Estimates and Forecast, 2017-2030 (US$ Bn)
14.3.4.2. Rest of Middle East and Africa Commercial Printing, By Printing technology, 2017-2030 (US$ Bn)
14.3.4.3. Rest of Middle East and Africa Commercial Printing, By Application, 2017-2030 (US$ Bn)

15. Company Profiles
15.1. Quad/Graphics Inc.
15.1.1. Company Overview
15.1.2. Products/Services Portfolio
15.1.3. Geographical Presence
15.1.4. Financial Summary
15.1.4.1. Market Revenue and Net Profit (2019-2022)
15.1.4.2. Business Segment Revenue Analysis
15.1.4.3. Geographical Revenue Analysis
15.2. Acme Printing
15.3. Cenveo
15.4. RR Donnelley
15.5. Transcontinental Inc.
15.6. LSC Communications US ,LLC
15.7. Gorham Printing, Inc
15.8. Dai Nippon Printing
15.9. The Magazine Printing Company
15.10. Cimpress plc
15.11. Quebecor World Inc.
15.12. HH Global
15.13. Cimpress PLC

List of Figures
FIG. 1 Global Commercial Printing Market: Research Methodology
FIG. 2 Market Size Estimation – Top Down & Bottom up Approach
FIG. 3 Global Commercial Printing Market Segmentation
FIG. 4 Global Commercial Printing Market, by Printing technology, 2022 (US$ Bn)
FIG. 5 Global Commercial Printing Market, by Application, 2022 (US$ Bn)
FIG. 6 Global Commercial Printing Market, by Geography, 2022 (US$ Bn)
FIG. 7 Attractive Investment Proposition, by Printing technology, 2022
FIG. 8 Attractive Investment Proposition, by Application, 2022
FIG. 9 Attractive Investment Proposition, by Geography, 2022
FIG. 10 Global Market Share Analysis of Key Commercial Printing Market Manufacturers, 2022
FIG. 11 Global Market Positioning of Key Commercial Printing Market Manufacturers, 2022
FIG. 12 Global Commercial Printing Market Value Contribution, By Printing technology, 2022 & 2030 (Value %)
FIG. 13 Global Commercial Printing Market, by Digital Printing, Value, 2017-2030 (US$ Bn)
FIG. 14 Global Commercial Printing Market, by Lithography Printing, Value, 2017-2030 (US$ Bn)
FIG. 15 Global Commercial Printing Market, by Flexographic, Value, 2017-2030 (US$ Bn)
FIG. 16 Global Commercial Printing Market, by Screen Printing, Value, 2017-2030 (US$ Bn)
FIG. 17 Global Commercial Printing Market, by Gravure Printing, Value, 2017-2030 (US$ Bn)
FIG. 18 Global Commercial Printing Market, by Others, Value, 2017-2030 (US$ Bn)
FIG. 19 Global Commercial Printing Market Value Contribution, By Application, 2022 & 2030 (Value %)
FIG. 20 Global Commercial Printing Market, by Packaging, Value, 2017-2030 (US$ Bn)
FIG. 21 Global Commercial Printing Market, by Advertising, 2017-2030 (US$ Bn)
FIG. 22 Global Commercial Printing Market, by Publishing, 2017-2030 (US$ Bn)
FIG. 23 Global Commercial Printing Market, by Books, 2017-2030 (US$ Bn)
FIG. 24 Global Commercial Printing Market, by Newspaper, 2017-2030 (US$ Bn)
FIG. 25 Global Commercial Printing Market, by Magazines, 2017-2030 (US$ Bn)
FIG. 26 Global Commercial Printing Market, by Others, 2017-2030 (US$ Bn)
FIG. 27 North America Commercial Printing Market, 2017-2030 (US$ Bn)
FIG. 28 U.S. Commercial Printing Market, 2017-2030 (US$ Bn)
FIG. 29 Canada Commercial Printing Market, 2017-2030 (US$ Bn)
FIG. 30 Europe Commercial Printing Market, 2017-2030 (US$ Bn)
FIG. 31 Germany Commercial Printing Market, 2017-2030 (US$ Bn)
FIG. 32 France Commercial Printing Market, 2017-2030 (US$ Bn)
FIG. 33 U.K. Commercial Printing Market, 2017-2030 (US$ Bn)
FIG. 34 Italy Commercial Printing Market, 2017-2030 (US$ Bn)
FIG. 35 Spain Commercial Printing Market, 2017-2030 (US$ Bn)
FIG. 36 Rest of Europe Commercial Printing Market, 2017-2030 (US$ Bn)
FIG. 37 Asia Pacific Commercial Printing Market, 2017-2030 (US$ Bn)
FIG. 38 China Commercial Printing Market, 2017-2030 (US$ Bn)
FIG. 39 Japan Commercial Printing Market, 2017-2030 (US$ Bn)
FIG. 40 India Commercial Printing Market, 2017-2030 (US$ Bn)
FIG. 41 South Korea Commercial Printing Market, 2017-2030 (US$ Bn)
FIG. 42 South-East Asia Commercial Printing Market, 2017-2030 (US$ Bn)
FIG. 43 Rest of Asia Pacific Commercial Printing Market, 2017-2030 (US$ Bn)
FIG. 44 Latin America Commercial Printing Market, 2017-2030 (US$ Bn)
FIG. 45 Brazil Commercial Printing Market, 2017-2030 (US$ Bn)
FIG. 46 Mexico Commercial Printing Market, 2017-2030 (US$ Bn)
FIG. 47 Rest of Latin America Commercial Printing Market, 2017-2030 (US$ Bn)
FIG. 48 Middle East & Africa Commercial Printing Market, 2017-2030 (US$ Bn)
FIG. 49 GCC Countries Commercial Printing Market, 2017-2030 (US$ Bn)
FIG. 50 South Africa Commercial Printing Market, 2017-2030 (US$ Bn)
FIG. 51 Rest of Middle East and Africa Commercial Printing Market, 2017-2030 (US$ Bn)

List of Tables
TABLE 1 Market Snapshot: Global Commercial Printing Market
TABLE 2 Global Commercial Printing Market: Market Drivers Impact Analysis
TABLE 3 Global Commercial Printing Market: Market Restraints Impact Analysis
TABLE 4 Global Commercial Printing Market, by Competitive Benchmarking, 2022
TABLE 5 Global Commercial Printing Market, by Geographical Presence Analysis, 2022
TABLE 6 Global Commercial Printing Market, by Key Strategies Analysis, 2022
TABLE 7 Global Commercial Printing Market, by Digital Printing, By Region, 2017-2022 (US$ Bn)
TABLE 8 Global Commercial Printing Market, by Digital Printing, By Region, 2023-2030 (US$ Bn)
TABLE 9 Global Commercial Printing Market, by Lithography Printing, By Region, 2017-2022 (US$ Bn)
TABLE 10 Global Commercial Printing Market, by Lithography Printing, By Region, 2023-2030 (US$ Bn)
TABLE 11 Global Commercial Printing Market, by Flexographic, By Region, 2017-2022 (US$ Bn)
TABLE 12 Global Commercial Printing Market, by Flexographic, By Region, 2023-2030 (US$ Bn)
TABLE 13 Global Commercial Printing Market, by Screen Printing, By Region, 2017-2022 (US$ Bn)
TABLE 14 Global Commercial Printing Market, by Screen Printing, By Region, 2023-2030 (US$ Bn)
TABLE 15 Global Commercial Printing Market, by Gravure Printing, By Region, 2017-2022 (US$ Bn)
TABLE 16 Global Commercial Printing Market, by Gravure Printing, By Region, 2023-2030 (US$ Bn)
TABLE 17 Global Commercial Printing Market, by Others, By Region, 2017-2022 (US$ Bn)
TABLE 18 Global Commercial Printing Market, by Others, By Region, 2023-2030 (US$ Bn)
TABLE 19 Global Commercial Printing Market, by Packaging, By Region, 2017-2022 (US$ Bn)
TABLE 20 Global Commercial Printing Market, by Packaging, By Region, 2023-2030 (US$ Bn)
TABLE 21 Global Commercial Printing Market, by Advertising, By Region, 2017-2022 (US$ Bn)
TABLE 22 Global Commercial Printing Market, by Advertising, By Region, 2023-2030 (US$ Bn)
TABLE 23 Global Commercial Printing Market, by Publishing, By Region, 2017-2022 (US$ Bn)
TABLE 24 Global Commercial Printing Market, by Publishing, By Region, 2023-2030 (US$ Bn)
TABLE 25 Global Commercial Printing Market, by Books, By Region, 2017-2022 (US$ Bn)
TABLE 26 Global Commercial Printing Market, by Books, By Region, 2023-2030 (US$ Bn)
TABLE 27 Global Commercial Printing Market, by Newspaper, By Region, 2017-2022 (US$ Bn)
TABLE 28 Global Commercial Printing Market, by Newspaper, By Region, 2023-2030 (US$ Bn)
TABLE 29 Global Commercial Printing Market, by Magazines, By Region, 2017-2022 (US$ Bn)
TABLE 30 Global Commercial Printing Market, by Magazines, By Region, 2023-2030 (US$ Bn)
TABLE 31 Global Commercial Printing Market, by Others, By Region, 2017-2022 (US$ Bn)
TABLE 32 Global Commercial Printing Market, by Others, By Region, 2023-2030 (US$ Bn)
TABLE 33 Global Commercial Printing Market, by Printing technology, 2017-2022 (US$ Bn)
TABLE 34 Global Commercial Printing Market, by Printing technology, 2023-2030 (US$ Bn)
TABLE 35 Global Commercial Printing Market, by Application, 2017-2022 (US$ Bn)
TABLE 36 Global Commercial Printing Market, by Application, 2023-2030 (US$ Bn)
TABLE 37 Global Commercial Printing Market, by Region, 2017-2022 (US$ Bn)
TABLE 38 Global Commercial Printing Market, by Region, 2023-2030 (US$ Bn)
TABLE 39 North America Commercial Printing Market, by Printing technology, 2017-2022 (US$ Bn)
TABLE 40 North America Commercial Printing Market, by Printing technology, 2023-2030 (US$ Bn)
TABLE 41 North America Commercial Printing Market, by Application, 2017-2022 (US$ Bn)
TABLE 42 North America Commercial Printing Market, by Application, 2023-2030 (US$ Bn)
TABLE 43 North America Commercial Printing Market, by Country, 2017-2022 (US$ Bn)
TABLE 44 North America Commercial Printing Market, by Country, 2023-2030 (US$ Bn)
TABLE 45 United States Commercial Printing Market, by Printing technology, 2017-2022 (US$ Bn)
TABLE 46 United States Commercial Printing Market, by Printing technology, 2023-2030 (US$ Bn)
TABLE 47 United States Commercial Printing Market, by Application, 2017-2022 (US$ Bn)
TABLE 48 United States Commercial Printing Market, by Application, 2023-2030 (US$ Bn)
TABLE 49 Canada Commercial Printing Market, by Printing technology, 2017-2022 (US$ Bn)
TABLE 50 Canada Commercial Printing Market, by Printing technology, 2023-2030 (US$ Bn)
TABLE 51 Canada Commercial Printing Market, by Application, 2017-2022 (US$ Bn)
TABLE 52 Canada Commercial Printing Market, by Application, 2023-2030 (US$ Bn)
TABLE 53 Mexico Commercial Printing Market, by Printing technology, 2017-2022 (US$ Bn)
TABLE 54 Mexico Commercial Printing Market, by Printing technology, 2023-2030 (US$ Bn)
TABLE 55 Mexico Commercial Printing Market, by Application, 2017-2022 (US$ Bn)
TABLE 56 Mexico Commercial Printing Market, by Application, 2023-2030 (US$ Bn)
TABLE 57 Europe Commercial Printing Market, by Printing technology, 2017-2022 (US$ Bn)
TABLE 58 Europe Commercial Printing Market, by Printing technology, 2023-2030 (US$ Bn)
TABLE 59 Europe Commercial Printing Market, by Application, 2017-2022 (US$ Bn)
TABLE 60 Europe Commercial Printing Market, by Application, 2023-2030 (US$ Bn)
TABLE 61 Europe Commercial Printing Market, by Country, 2017-2022 (US$ Bn)
TABLE 62 Europe Commercial Printing Market, by Country, 2023-2030 (US$ Bn)
TABLE 63 Germany Commercial Printing Market, by Printing technology, 2017-2022 (US$ Bn)
TABLE 64 Germany Commercial Printing Market, by Printing technology, 2023-2030 (US$ Bn)
TABLE 65 Germany Commercial Printing Market, by Application, 2017-2022 (US$ Bn)
TABLE 66 Germany Commercial Printing Market, by Application, 2023-2030 (US$ Bn)
TABLE 67 France Commercial Printing Market, by Printing technology, 2017-2022 (US$ Bn)
TABLE 68 France Commercial Printing Market, by Printing technology, 2023-2030 (US$ Bn)
TABLE 69 France Commercial Printing Market, by Application, 2017-2022 (US$ Bn)
TABLE 70 France Commercial Printing Market, by Application, 2023-2030 (US$ Bn)
TABLE 71 United Kingdom Commercial Printing Market, by Printing technology, 2017-2022 (US$ Bn)
TABLE 72 United Kingdom Commercial Printing Market, by Printing technology, 2023-2030 (US$ Bn)
TABLE 73 United Kingdom Commercial Printing Market, by Application, 2017-2022 (US$ Bn)
TABLE 74 United Kingdom Commercial Printing Market, by Application, 2023-2030 (US$ Bn)
TABLE 75 Italy Commercial Printing Market, by Printing technology, 2017-2022 (US$ Bn)
TABLE 76 Italy Commercial Printing Market, by Printing technology, 2023-2030 (US$ Bn)
TABLE 77 Italy Commercial Printing Market, by Application, 2017-2022 (US$ Bn)
TABLE 78 Italy Commercial Printing Market, by Application, 2023-2030 (US$ Bn)
TABLE 79 Spain Commercial Printing Market, by Printing technology, 2017-2022 (US$ Bn)
TABLE 80 Spain Commercial Printing Market, by Printing technology, 2023-2030 (US$ Bn)
TABLE 81 Spain Commercial Printing Market, by Application, 2017-2022 (US$ Bn)
TABLE 82 Spain Commercial Printing Market, by Application, 2023-2030 (US$ Bn)
TABLE 83 Rest of Europe Commercial Printing Market, by Printing technology, 2017-2022 (US$ Bn)
TABLE 84 Rest of Europe Commercial Printing Market, by Printing technology, 2023-2030 (US$ Bn)
TABLE 85 Rest of Europe Commercial Printing Market, by Application, 2017-2022 (US$ Bn)
TABLE 86 Rest of Europe Commercial Printing Market, by Application, 2023-2030 (US$ Bn)
TABLE 87 Asia Pacific Commercial Printing Market, by Printing technology, 2017-2022 (US$ Bn)
TABLE 88 Asia Pacific Commercial Printing Market, by Printing technology, 2023-2030 (US$ Bn)
TABLE 89 Asia Pacific Commercial Printing Market, by Application, 2017-2022 (US$ Bn)
TABLE 90 Asia Pacific Commercial Printing Market, by Application, 2023-2030 (US$ Bn)
TABLE 91 China Commercial Printing Market, by Printing technology, 2017-2022 (US$ Bn)
TABLE 92 China Commercial Printing Market, by Printing technology, 2023-2030 (US$ Bn)
TABLE 93 China Commercial Printing Market, by Application, 2017-2022 (US$ Bn)
TABLE 94 China Commercial Printing Market, by Application, 2023-2030 (US$ Bn)
TABLE 95 Japan Commercial Printing Market, by Printing technology, 2017-2022 (US$ Bn)
TABLE 96 Japan Commercial Printing Market, by Printing technology, 2023-2030 (US$ Bn)
TABLE 97 Japan Commercial Printing Market, by Application, 2017-2022 (US$ Bn)
TABLE 98 Japan Commercial Printing Market, by Application, 2023-2030 (US$ Bn)
TABLE 99 India Commercial Printing Market, by Printing technology, 2017-2022 (US$ Bn)
TABLE 100 India Commercial Printing Market, by Printing technology, 2023-2030 (US$ Bn)
TABLE 101 India Commercial Printing Market, by Application, 2017-2022 (US$ Bn)
TABLE 102 India Commercial Printing Market, by Application, 2023-2030 (US$ Bn)
TABLE 103 South Korea Commercial Printing Market, by Printing technology, 2017-2022 (US$ Bn)
TABLE 104 South Korea Commercial Printing Market, by Printing technology, 2023-2030 (US$ Bn)
TABLE 105 South Korea Commercial Printing Market, by Application, 2017-2022 (US$ Bn)
TABLE 106 South Korea Commercial Printing Market, by Application, 2023-2030 (US$ Bn)
TABLE 107 South-East Asia Commercial Printing Market, by Printing technology, 2017-2022 (US$ Bn)
TABLE 108 South-East Asia Commercial Printing Market, by Printing technology, 2023-2030 (US$ Bn)
TABLE 109 South-East Asia Commercial Printing Market, by Application, 2017-2022 (US$ Bn)
TABLE 110 South-East Asia Commercial Printing Market, by Application, 2023-2030 (US$ Bn)
TABLE 111 Rest of Asia Pacific Commercial Printing Market, by Printing technology, 2017-2022 (US$ Bn)
TABLE 112 Rest of Asia Pacific Commercial Printing Market, by Printing technology, 2023-2030 (US$ Bn)
TABLE 113 Rest of Asia Pacific Commercial Printing Market, by Application, 2017-2022 (US$ Bn)
TABLE 114 Rest of Asia Pacific Commercial Printing Market, by Application, 2023-2030 (US$ Bn)
TABLE 115 Latin America Commercial Printing Market, by Printing technology, 2017-2022 (US$ Bn)
TABLE 116 Latin America Commercial Printing Market, by Printing technology, 2023-2030 (US$ Bn)
TABLE 117 Latin America Commercial Printing Market, by Application, 2017-2022 (US$ Bn)
TABLE 118 Latin America Commercial Printing Market, by Application, 2023-2030 (US$ Bn)
TABLE 119 Brazil Commercial Printing Market, by Printing technology, 2017-2022 (US$ Bn)
TABLE 120 Brazil Commercial Printing Market, by Printing technology, 2023-2030 (US$ Bn)
TABLE 121 Brazil Commercial Printing Market, by Application, 2017-2022 (US$ Bn)
TABLE 122 Brazil Commercial Printing Market, by Application, 2023-2030 (US$ Bn)
TABLE 123 Argentina Commercial Printing Market, by Printing technology, 2017-2022 (US$ Bn)
TABLE 124 Argentina Commercial Printing Market, by Printing technology, 2023-2030 (US$ Bn)
TABLE 125 Argentina Commercial Printing Market, by Application, 2017-2022 (US$ Bn)
TABLE 126 Argentina Commercial Printing Market, by Application, 2023-2030 (US$ Bn)
TABLE 127 Rest of Latin America Commercial Printing Market, by Printing technology, 2017-2022 (US$ Bn)
TABLE 128 Rest of Latin America Commercial Printing Market, by Printing technology, 2023-2030 (US$ Bn)
TABLE 129 Rest of Latin America Commercial Printing Market, by Application, 2017-2022 (US$ Bn)
TABLE 130 Rest of Latin America Commercial Printing Market, by Application, 2023-2030 (US$ Bn)
TABLE 131 Middle East and Africa Commercial Printing Market, by Printing technology, 2017-2022 (US$ Bn)
TABLE 132 Middle East and Africa Commercial Printing Market, by Printing technology, 2023-2030 (US$ Bn)
TABLE 133 Middle East and Africa Commercial Printing Market, by Application, 2017-2022 (US$ Bn)
TABLE 134 Middle East and Africa Commercial Printing Market, by Application, 2023-2030 (US$ Bn)
TABLE 135 GCC Countries Commercial Printing Market, by Printing technology, 2017-2022 (US$ Bn)
TABLE 136 GCC Countries Commercial Printing Market, by Printing technology, 2023-2030 (US$ Bn)
TABLE 137 GCC Countries Commercial Printing Market, by Application, 2017-2022 (US$ Bn)
TABLE 138 GCC Countries Commercial Printing Market, by Application, 2023-2030 (US$ Bn)
TABLE 139 South Africa Commercial Printing Market, by Printing technology, 2017-2022 (US$ Bn)
TABLE 140 South Africa Commercial Printing Market, by Printing technology, 2023-2030 (US$ Bn)
TABLE 141 South Africa Commercial Printing Market, by Application, 2017-2022 (US$ Bn)
TABLE 142 South Africa Commercial Printing Market, by Application, 2023-2030 (US$ Bn)
TABLE 143 Rest of Middle East and Africa Commercial Printing Market, by Printing technology, 2017-2022 (US$ Bn)
TABLE 144 Rest of Middle East and Africa Commercial Printing Market, by Printing technology, 2023-2030 (US$ Bn)
TABLE 145 Rest of Middle East and Africa Commercial Printing Market, by Application, 2017-2022 (US$ Bn)
TABLE 146 Rest of Middle East and Africa Commercial Printing Market, by Application, 2023-2030 (US$ Bn)

Frequently asked questions

What is the current size of the global commercial printing market?

The global commercial printing market was valued at USD 481.8 Billion in 2022.

What is the expected growth rate of the commercial printing market between 2023 and 2030?

The commercial printing market is expected to grow at a CAGR of 3.10% between 2023 and 2030, reaching USD 596.6 Billion in 2030.

Which segment is leading the market share in terms of Printing technology?

Lithography printing is the leading segment by printing technology, holding over 43.82% share in terms of value in 2022.

Which application segment governs the demand for commercial printings in the world?

The packaging segment governs the demand for commercial printings in the world, holding a massive share of over 53.77% in 2022.

Which segment is expected to post the highest CAGR during the forecast period?

The advertising segment is expected to post the highest CAGR during the forecast period.

Which region is fueling the growth of the commercial printing industry?

Asia Pacific is fueling the growth of the commercial printing industry, with over one-third share in 2022.

Who are the major players in the global commercial printing market?

The top players include Acme Printing; Quad/Graphics Inc.; Cenveo; Transcontinental Inc.; LSC Communications US, LLC.; Gorham Printing, Inc.; RR Donnelley; Dai Nippon Printing; Cimpress plc; Quebecor World Inc.; The Magazine Printing Company; HH Global; Cimpress PLC

What are the major market drivers of the commercial printing industry?

The major market drivers are the development of new technologies, particularly digital printing, as well as the rising necessity for advertising across many industry sectors.

What are the major market restraints of the commercial printing industry?

The rising cost of raw materials during procurement is the major market restraint.

What are the major market opportunities of the commercial printing industry?

Since global e-commerce businesses are quickly embracing cutting-edge printing solutions for their regular packaging, these are the major opportunities in the commercial printing industry.

Commercial Cooking Equipment Market

Published:
Report ID: 3767

Industrial and Commercial LED Lighting Market

Published:
Report ID: 56900

Commercial Boiler Market

Published:
Report ID: 56275

Commercial Pharmaceutical Analytics Market

Published:
Report ID: 51822

Commercial Refrigeration System Market

Published:
Report ID: 51416

Commercial Refrigerators Market

Published:
Report ID: 50679

Commercial Avionics Market

Published:
Report ID: 3768

Commercial Real Estate Compliance Tool Market

Published:
Report ID: 47995

Commercial Vehicle Axles Market

Published:
Report ID: 4015

MES Applications for Process Manufacturing Market

Published:
Report ID: 63652

Modular Substation Market

Published:
Report ID: 63630

Video Wall Market

Published:
Report ID: 12071

Tower Mounted Amplifier Market

Published:
Report ID: 11426

In-Building Wireless Market

Published:
Report ID: 63504

Light Emitting Diode (LED) Backlight Display Market

Published:
Report ID: 63480

LED OLED Lighting Products Displays Market

Published:
Report ID: 63452

Large Scale Natural Refrigerant Heat Pump Market

Published:
Report ID: 63442

Open Air Merchandizers and Accessories Market

Published:
Report ID: 63335

Walk-in Cooler and Freezer Market

Published:
Report ID: 63310

Paddle and Locker Switches Market

Published:
Report ID: 8485

Outdoor Thermometer Market

Published:
Report ID: 8341

Purchase Options

The report comes as a view-only PDF document, optimized for individual clients. This version is recommended for personal digital use and does not allow printing.
$4699

To meet the needs of modern corporate teams, our report comes in two formats: a printable PDF and a data-rich Excel sheet. This package is optimized for internal analysis and multi-location access, making it an excellent choice for organizations with distributed workforce.
$5699

The report will be delivered in printable PDF format along with the report’s data Excel sheet. This license offers 100 Free Analyst hours where the client can utilize Credence Research Inc.’s research team. It is highly recommended for organizations seeking to execute short, customized research projects related to the scope of the purchased report.
$7699

Smallform of Sample request

Have a question?

User Profile

Don’t settle for less – trust Mitul to help you find the best solution.

Report delivery within 24 to 48 hours

– Other Info –

What people say?-

User Review

I am very impressed with the information in this report. The author clearly did their research when they came up with this product and it has already given me a lot of ideas.

Jana Schmidt
CEDAR CX Technologies

– Connect with us –

Phone

+91 6232 49 3207


support

24/7 Research Support


sales@credenceresearch.com

– Research Methodology –

Going beyond the basics: advanced techniques in research methodology

– Trusted By –

Pepshi, LG, Nestle
Motorola, Honeywell, Johnson and johnson
LG Chem, SIEMENS, Pfizer
Unilever, Samsonite, QIAGEN