
Market Overview
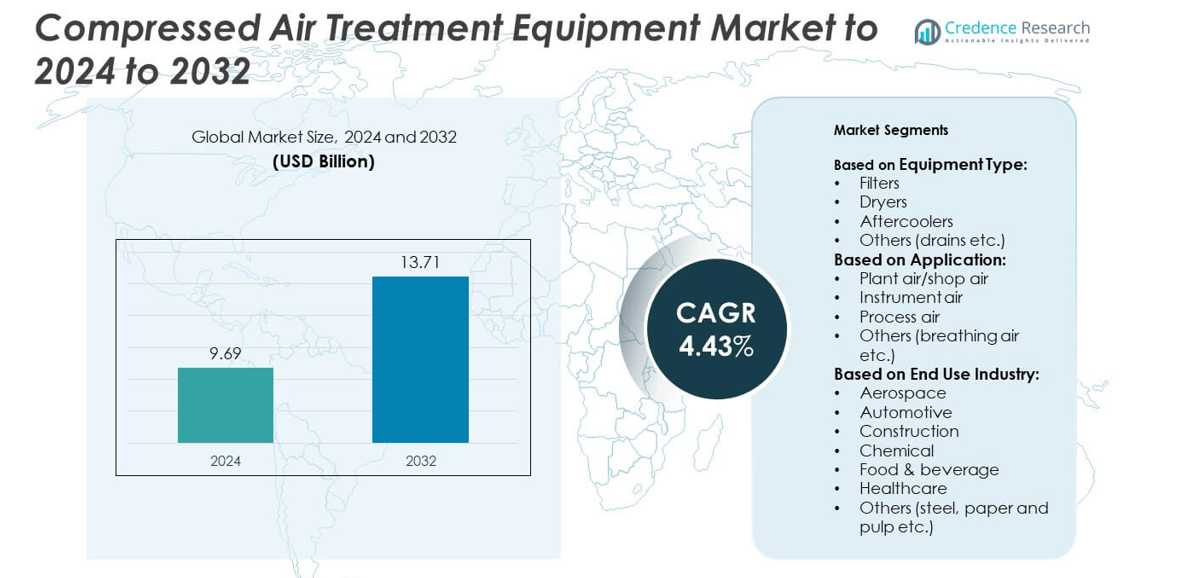
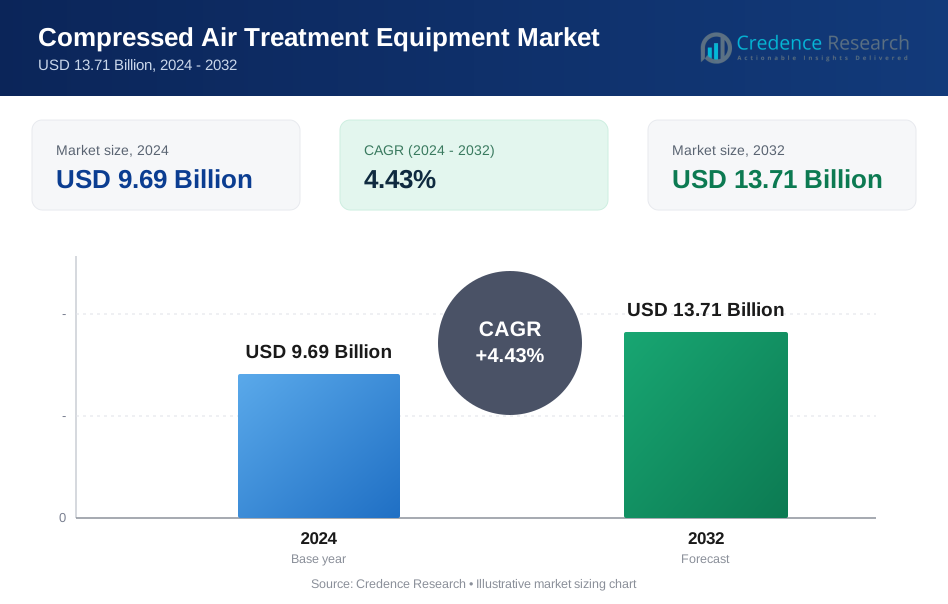
Compressed Air Treatment Equipment Market size was valued at USD 9.69 Billion in 2024 and is anticipated to reach USD 13.71 Billion by 2032, at a CAGR of 4.43% during the forecast period.
| REPORT ATTRIBUTE | DETAILS |
|---|---|
| Historical Period | 2020-2023 |
| Base Year | 2024 |
| Forecast Period | 2025-2032 |
| Compressed Air Treatment Equipment Market Size 2024 | USD 9.69 Billion |
| Compressed Air Treatment Equipment Market, CAGR | 4.43% |
| Compressed Air Treatment Equipment Market Size 2032 | USD 13.71 Billion |
The compressed air treatment equipment market is led by major players such as Ingersoll Rand, Parker Hannifin, Atlas Copco, Gardner Denver, and Kaeser. These companies focus on developing energy-efficient, low-maintenance, and digitally connected air purification systems to meet evolving industrial demands. Their strategies include product innovation, regional expansion, and mergers to strengthen global presence. Asia-Pacific emerged as the leading region in 2024, holding a 34% market share, driven by rapid industrialization and manufacturing growth in China, India, and Southeast Asia. North America followed with a 32% share, supported by strong regulatory standards and advanced industrial infrastructure.
Market Insights
- The compressed air treatment equipment market was valued at USD 9.69 Billion in 2024 and is projected to reach USD 13.71 Billion by 2032, growing at a CAGR of 4.43%.
- Rising industrial automation and stricter air quality regulations are driving adoption across manufacturing, food, and healthcare sectors.
- The market is witnessing trends toward IoT-enabled monitoring systems and energy-efficient filtration and drying technologies.
- Key players such as Ingersoll Rand, Parker Hannifin, Atlas Copco, Gardner Denver, and Kaeser dominate through product innovation and strategic partnerships.
- Asia-Pacific led the market with a 34% share in 2024, followed by North America at 32% and Europe at 29%, while the filters segment accounted for 38% of total demand.
Market Segmentation Analysis:
By Equipment Type
Filters dominated the compressed air treatment equipment market in 2024, accounting for around 38% of the total share. Their dominance stems from the need to remove oil, moisture, and particulate contaminants from compressed air systems, ensuring equipment longevity and energy efficiency. Increasing automation across industries and rising quality standards in manufacturing are driving demand for high-efficiency filtration systems. Additionally, technological advancements such as nanofiber filters and self-cleaning mechanisms are enhancing operational reliability and reducing maintenance downtime, further solidifying filters as the leading segment in the equipment category.
- For instance, Atlas Copco UD+ filters show 40% lower pressure drop versus conventional combos, improving energy efficiency accordingly.
By Application
The plant air/shop air segment held the largest share, capturing approximately 41% of the market in 2024. This dominance is attributed to widespread use across general industrial operations, including powering pneumatic tools, packaging systems, and assembly lines. Demand is rising due to the increasing adoption of automated manufacturing processes and energy-efficient air systems. Furthermore, industries such as automotive and construction rely heavily on consistent, clean air supply for tool operation and equipment performance, reinforcing the plant air segment’s strong market position during the forecast period.
- For instance, SPX Hankison HPR/HPRN dryers hold a 38 °F (+3 °C) pressure dew point across 5–1200 scfm units for stable plant air.
By End Use Industry
The food and beverage industry emerged as the leading end-use segment, holding nearly 29% market share in 2024. Strict hygiene and contamination control regulations, such as FDA and ISO standards, are driving the adoption of clean and dry compressed air systems for food processing, packaging, and bottling. Growing investments in automated production lines and increasing focus on product purity have further fueled this demand. Additionally, the segment benefits from rising consumption of packaged and processed foods globally, which continues to expand the application scope of air treatment systems in this industry.
Key Growth Drivers
Rising Industrial Automation and Manufacturing Expansion
The growing adoption of automation in industries such as automotive, food processing, and pharmaceuticals is driving demand for clean, dry, and contaminant-free compressed air. Modern automated systems rely on consistent air quality to prevent equipment failure and maintain production efficiency. Expanding manufacturing bases in Asia-Pacific and increased focus on energy-efficient operations are boosting the installation of advanced filtration and drying systems. As industries aim for higher productivity and reliability, demand for precision-engineered air treatment equipment continues to grow.
- For instance, Gardner Denver upgrades at a McCain Foods plant cut electricity use by 1,742,825 kWh annually through VSD and system changes.
Stringent Air Quality and Regulatory Standards
Strict environmental and quality standards such as ISO 8573.1 are compelling industries to maintain high air purity levels in production processes. Sectors like food and beverage, electronics, and healthcare require contamination-free air to ensure product safety and compliance. Manufacturers are investing in advanced filtration, adsorption dryers, and condensate management systems to meet these norms. This regulatory enforcement drives consistent upgrades and replacements, positioning compliance as a central factor in market expansion.
- For instance, Parker Hannifin defines ISO 8573-1 Class 2 water at −40 °C PDP and Class 1 oil at ≤0.01 mg/m³, guiding compliance designs.
Rising Focus on Energy Efficiency and Cost Optimization
Industries are increasingly prioritizing energy-efficient compressed air systems to reduce operational costs and carbon footprints. Advanced dryers and filters with low-pressure drop designs are helping optimize power consumption. Companies are adopting intelligent monitoring systems that detect leaks and adjust airflow dynamically, improving overall system efficiency. With energy costs forming a major portion of plant expenses, the transition toward smart, eco-efficient air treatment technologies is a primary growth accelerator for the market.
Key Trends & Opportunities
Integration of Smart Monitoring and IoT Solutions
The adoption of IoT-based monitoring in compressed air treatment systems is a rising trend. Smart sensors and analytics platforms enable real-time monitoring of air quality, pressure levels, and filter performance. These digital solutions allow predictive maintenance and minimize downtime, improving productivity. Manufacturers offering connected equipment are gaining an edge through data-driven maintenance and optimization capabilities. The growing use of Industry 4.0 practices presents significant opportunities for innovation and product differentiation.
- For instance, ELGi Air~Alert monitors 65+ compressor parameters for predictive maintenance and uptime gains.
Expansion in Food, Beverage, and Healthcare Sectors
Expanding applications in sensitive industries such as food, beverage, and healthcare are opening new opportunities for growth. These sectors require sterile, oil-free compressed air to prevent contamination and maintain hygiene compliance. Rising packaged food demand, along with pharmaceutical production growth, continues to strengthen the market outlook. Manufacturers providing oil-free compressors and medical-grade air dryers are witnessing strong adoption, supported by stricter safety standards and growing investments in cleanroom manufacturing.
- For instance, Parker HIGH FLOW BIO-X sterile gas filters retain to 0.01 µm and deliver 2–3× the flow of membrane filters.
Key Challenges
High Initial Investment and Maintenance Costs
Compressed air treatment systems involve significant upfront costs related to equipment, installation, and energy use. Small and medium-sized enterprises often hesitate to invest due to limited capital and longer payback periods. Additionally, regular maintenance, including filter replacement and dryer servicing, adds to operational expenses. These cost-related challenges limit adoption in cost-sensitive industries, especially in emerging markets, where low-cost alternatives are often preferred.
System Inefficiencies and Energy Losses
Energy inefficiency remains a major concern in compressed air systems, where losses can reach up to 30% of total power consumption. Poor system design, leaks, and inadequate maintenance reduce performance and increase operational costs. Many plants lack real-time diagnostics to monitor these inefficiencies. This challenge creates pressure on manufacturers to design more efficient and automated systems capable of minimizing air leakage and optimizing airflow for improved sustainability and cost control.
Regional Analysis
North America
North America held a 32% market share in the compressed air treatment equipment market in 2024. The region’s growth is driven by strong industrial automation, expanding food and beverage production, and stringent air quality regulations. The United States leads due to advanced manufacturing facilities and adoption of energy-efficient technologies. Investments in clean energy and healthcare sectors further support demand. Increasing adoption of oil-free systems across pharmaceuticals and electronics manufacturing is also boosting sales, while strong presence of major players ensures consistent innovation and maintenance services across industrial applications.
Europe
of clean air systems across manufacturing and automotive sectors. The European Union’s focus on sustainability and energy efficiency encourages industries to upgrade air filtration and drying equipment. Rising production of high-value products such as precision machinery and packaged foods is also increasing adoption of advanced air treatment solutions, while local manufacturers are integrating smart monitoring technologies to enhance operational efficiency.
Asia-Pacific
Asia-Pacific dominated the market with a 34% share in 2024, supported by rapid industrialization and infrastructure development in China, India, and Southeast Asia. Expanding automotive, electronics, and food processing sectors are driving demand for high-quality compressed air systems. Government initiatives promoting energy-efficient manufacturing and rising investments in industrial automation are accelerating equipment adoption. The region benefits from large-scale manufacturing and low production costs, enabling faster market penetration. Continuous technological upgrades by regional suppliers are also improving competitiveness and helping meet international quality and safety standards.
Latin America
Latin America captured a 3% market share in 2024, with growing demand from the construction, food processing, and mining industries. Countries such as Brazil and Mexico are increasingly investing in industrial automation, which drives the need for reliable air treatment systems. The region is also witnessing gradual adoption of energy-efficient dryers and filters to meet operational cost targets. However, limited infrastructure and slow industrial modernization continue to restrain broader adoption. Despite these challenges, improving economic stability and foreign investments are expected to support moderate market growth through 2032.
Middle East & Africa
The Middle East & Africa region held a 2% market share in 2024, driven by growing infrastructure, oil and gas operations, and food manufacturing industries. Expanding industrial zones in Saudi Arabia, the UAE, and South Africa are fueling equipment demand. The focus on diversification beyond oil is creating opportunities for advanced air treatment systems in manufacturing and healthcare. However, budget constraints and lower awareness among small industries hinder widespread adoption. Increasing foreign investments and gradual regulatory alignment with international air quality standards are expected to improve market penetration in the coming years.
Market Segmentations:
By Equipment Type:
- Filters
- Dryers
- Aftercoolers
- Others (drains etc.)
By Application:
- Plant air/shop air
- Instrument air
- Process air
- Others (breathing air etc.)
By End Use Industry:
- Aerospace
- Automotive
- Construction
- Chemical
- Food & beverage
- Healthcare
- Others (steel, paper and pulp etc.)
By Geography:
- North America
- U.S.
- Canada
- Europe
- Germany
- France
- U.K.
- Italy
- Spain
- Rest of Europe
- Asia Pacific
- China
- Japan
- India
- South Korea
- South-east Asia
- Rest of Asia Pacific
- Latin America
- Brazil
- Mexico
- Rest of Latin America
- Middle East & Africa
- GCC Countries
- South Africa
- Rest of the Middle East and Africa
Competitive Landscape
The compressed air treatment equipment market is characterized by the presence of leading players such as Ingersoll Rand, Parker Hannifin, Atlas Copco, Gardner Denver, Kaeser, Emerson Climate, SPX Flow, Mann+Hummel, Mikropor, Chicago Pneumatic, Omega Air, Beko Technologies, Walker Filtration, Alpha-Pure, Wilkerson, Elgi Compressors, and ZEKS Compressed Air. These companies compete through technological innovation, product efficiency, and global distribution strength. The market is witnessing a shift toward energy-efficient, low-maintenance systems integrated with smart monitoring technologies. Leading manufacturers are investing in digital platforms for predictive maintenance and real-time system optimization. Strategic partnerships and acquisitions are expanding product portfolios and market reach, particularly in high-growth regions such as Asia-Pacific. The emphasis on compliance with ISO and energy efficiency standards continues to shape product development. Competitive advantage increasingly depends on innovation in filtration and drying technologies, alongside service-based business models that enhance customer retention and long-term system reliability.
Key Player Analysis
- Ingersoll Rand
- Parker Hannifin
- Atlas Copco
- Gardner Denver
- Kaeser
- Emerson Climate
- SPX Flow
- Mann+Hummel
- Mikropor
- Chicago Pneumatic
- Omega Air
- Beko Technologies
- Walker Filtration
- Alpha-Pure
- Wilkerson
- Elgi Compressors
- ZEKS Compressed Air
Recent Developments
- In 2025, Atlas Copco Unveiled the X-Air⁺ 1200-25 portable air compressor, which features remote monitoring and enhanced efficiency.
- In 2024, Kaeser launched its "Kaeser measurement technology". This technology provides real-time insights to optimize compressed air system performance.
- In 2023, Ingersoll Rand completed a significant, all-cash acquisition of SPX FLOW's Air Treatment business for approximately $525 million. This strategic move expanded Ingersoll Rand's compressed air portfolio with energy-efficient filters, dryers, and other air treatment products.
Report Coverage
The research report offers an in-depth analysis based on Equipment Type, Application, End-Use Industry and Geography. It details leading market players, providing an overview of their business, product offerings, investments, revenue streams, and key applications. Additionally, the report includes insights into the competitive environment, SWOT analysis, current market trends, as well as the primary drivers and constraints. Furthermore, it discusses various factors that have driven market expansion in recent years. The report also explores market dynamics, regulatory scenarios, and technological advancements that are shaping the industry. It assesses the impact of external factors and global economic changes on market growth. Lastly, it provides strategic recommendations for new entrants and established companies to navigate the complexities of the market.
Future Outlook
- The market will continue expanding with rising industrial automation and digital monitoring adoption.
- Demand for energy-efficient and low-maintenance air treatment systems will increase across industries.
- Integration of IoT and AI-based control systems will enhance equipment performance and reliability.
- Manufacturers will focus on developing compact and modular air treatment units for flexible installations.
- The food and beverage sector will remain a major growth driver due to strict hygiene standards.
- Emerging economies in Asia-Pacific will witness accelerated adoption driven by manufacturing growth.
- Regulatory pressure for cleaner production environments will boost replacement and upgrade demand.
- Hybrid air treatment solutions combining multiple functions will gain popularity for cost efficiency.
- Service-based models such as equipment leasing and maintenance contracts will see steady growth.
- Sustainability-focused innovations using recyclable materials and eco-friendly designs will shape future product development.
Request a Free Sample
Fill in your details and we'll send you a free sample report.
- Sample data tables & charts
- Research methodology
Need a Custom Version of This Report?
Tailor the scope, geography, or segments to your exact requirements.
- Custom geography or segment scope
- Direct access to our analyst team
Frequently Asked Questions
What is the current market size for Compressed Air Treatment Equipment Market, and what is its projected size in 2032?
At what Compound Annual Growth Rate is the Compressed Air Treatment Equipment Market projected to grow between 2025 and 2032?
Which Compressed Air Treatment Equipment Market segment held the largest share in 2024?
What are the primary factors fueling the growth of the Compressed Air Treatment Equipment Market?
Who are the leading companies in the Compressed Air Treatment Equipment Market?
Table of Content
Chapter 1. Report Introduction
- 1.1 Report Description & Purpose
- 1.1.1 Report Title & Market Definition
- 1.1.2 Unique Selling Propositions (USP) & Key Differentiators
- 1.1.3 Value Proposition for Stakeholders
- 1.2 Research Objectives
- 1.2.1 Market Sizing Objectives (Volume & Revenue)
- 1.2.2 Segmentation Objectives
- 1.2.3 Competitive Intelligence Objectives
- 1.2.4 Forecast & Scenario Objectives
- 1.3 Report Scope
- 1.3.1 Compressed Air Treatment Equipment Scope – Types & Subtypes Covered
- 1.3.2 Geographic Scope – Regions & Countries Covered
- 1.3.3 Historical Period, Base Year & Forecast Period (2024; forecast to 2032)
- 1.3.4 Inclusions & Exclusions
- 1.4 HS Code & Classification Framework
- 1.5 Currency, Units & Pricing Basis
- 1.6 Target Stakeholders
- 1.7 Limitations & Assumptions
Chapter 2. Executive Summary
- 2.1 Global Compressed Air Treatment Equipment Market Snapshot
- 2.1.1 Market Size – Historical (2024) & Forecast (2024-2032) (2024: USD 9.69 Billion → 2032: USD 13.71 Billion)
- 2.1.2 Volume & Revenue – Global Totals
- 2.1.3 Key Market Highlights – Top Five Facts
- 2.2 Compressed Air Treatment Equipment Market Segmentation Snapshot
- 2.2.1 Market Split by Region – 2024 vs. 2032
- 2.3 Competitive Snapshot
- 2.3.1 Top 10 Players by Revenue Share – 2024
- 2.3.2 Top 10 Players by Volume Share – 2024
- 2.3.3 Recent Strategic Developments (18-Month Summary)
- 2.4 Key Investment Highlights & Strategic Conclusions
Chapter 3. Compressed Air Treatment Equipment Market Dynamics & Industry Analysis
- 3.1 Market Overview & Context
- 3.1.1 Compressed Air Treatment Equipment Market Position in the Broader Automotive Value Chain
- 3.1.2 OEM vs. Replacement Market Dynamics
- 3.1.3 Market Maturity & Development Stage by Region
- 3.2 Compressed Air Treatment Equipment Market Drivers
- 3.3 Compressed Air Treatment Equipment Market Restraints & Challenges
- 3.4 Compressed Air Treatment Equipment Market Opportunities
- 3.5 Porter's Five Forces Analysis
- 3.5.1 Threat of New Entrants
- 3.5.2 Bargaining Power of Suppliers
- 3.5.3 Bargaining Power of Buyers
- 3.5.4 Threat of Substitutes
- 3.5.5 Competitive Rivalry – Intensity Assessment
- 3.6 Compressed Air Treatment Equipment Value Chain Analysis
- 3.6.1 Upstream – Raw Material/Input Suppliers
- 3.6.1.1 Raw Material/Input 1
- 3.6.1.2 Raw Material/Input 2
- 3.6.1.3 Raw Material/Input 3
- 3.6.2 Midstream – Production/Manufacturing/Service Delivery
- 3.6.2.1 Production/Process Overview
- 3.6.2.2 Key Facility Locations & Capacity by Manufacturer
- 3.6.3 Downstream – Distribution & End Consumer
- 3.6.3.1 Primary Channel – B2B/OEM
- 3.6.3.2 Secondary Channels – Dealer, Retail, Online, Direct
- 3.6.4 Value Chain Profitability Analysis
- 3.6.1 Upstream – Raw Material/Input Suppliers
- 3.7 PESTEL Analysis
- 3.7.1 Political Factors
- 3.7.2 Economic Factors
- 3.7.3 Social Factors
- 3.7.4 Technological Factors
- 3.7.5 Environmental Factors
- 3.7.6 Legal Factors
- 3.8 Compressed Air Treatment Equipment Supply Chain Analysis
- 3.8.1 Raw Material/Input Supply Risk Assessment
- 3.8.2 Manufacturing Concentration Risk (Geographic Exposure)
- 3.8.3 Trade Disruption Impact Analysis
- 3.9 Regulatory & Policy Landscape
Note: The regulatory and policy landscape section covers regulations based on their applicability to the market, Compressed Air Treatment Equipment category, geography, and scope of the study. Only regulatory frameworks with a material impact on operations, compliance, trade, sustainability, or market access are analyzed in detail.
Chapter 4. Key Investment Pockets & Opportunity Analysis
- 4.1 Compressed Air Treatment Equipment Market Attractiveness Analysis
- 4.1.1 By Region – Investment Attractiveness Matrix (Volume × CAGR)
- 4.2 Absolute Revenue Growth Opportunity
- 4.2.1 By Region – Absolute USD Growth Through 2032
- 4.3 Incremental Volume Opportunity
- 4.3.1 By Region – Incremental Volume Through 2032
- 4.3.2 Segment – Incremental Volume
- 4.4 Emerging Submarket Opportunity Deep Dive (Subject to Applicability)
- 4.5 Emerging Market Opportunity Scorecards
- 4.5.1 United States
- 4.5.2 Europe
- 4.5.3 Asia
- 4.5.4 Middle East & Africa
Note: Emerging Market Opportunity Scorecards will be included based on relevance and strategic importance. Regions listed are indicative and may vary depending on data availability and market dynamics.
Chapter 5. Compressed Air Treatment Equipment Import-Export Analysis & Trade Flows
- 5.1 Global Trade Overview
- 5.1.1 Global Export Value by Country (2024)
- 5.1.2 Global Export Volume by Country (2024)
- 5.1.3 Global Import Value by Country (2024)
- 5.1.4 Global Import Volume by Country (2024)
- 5.1.5 Net Trade Balance by Country (2024)
- 5.2 Export Analysis – Segment
- 5.2.1 Type 1 (HS Code)
- 5.2.2 Type 2 (HS Code)
- 5.2.3 Type 3 (HS Code)
- 5.2.4 Type 4 (HS Code)
- 5.2.5 Type 5 (HS Code)
- 5.3 Import Analysis – Segment
- 5.3.1 Type 1 (HS Code)
- 5.3.2 Type 2 (HS Code)
- 5.3.3 Type 3 (HS Code)
- 5.3.4 Type 4 (HS Code)
- 5.3.5 Type 5 (HS Code)
- 5.4 Average Unit Trade Prices
- 5.4.1 Average Export Price – Segment & Country
- 5.4.2 Average Import Price – Segment & Source Country
- 5.4.3 Price Trends (2024)
- 5.5 Key Trade Route Analysis
- 5.5.1 Trade Route 1
- 5.5.2 Trade Route 2
- 5.5.3 Trade Route 3
- 5.5.4 Trade Route 4
- 5.5.5 Trade Route 5
- 5.6 Trade Policy Impact Assessment
- 5.6.1 US Anti-Dumping & Section 301 Tariffs
- 5.6.2 EU Customs Union Impact
- 5.6.3 Major Free Trade Agreements
- 5.6.4 USMCA Rules of Origin
Note: Trade policy analysis will be included only where relevant to the Compressed Air Treatment Equipment market.
Chapter 6. Competitive Landscape & Company Benchmarking
- 6.1 Compressed Air Treatment Equipment Market Concentration & Structure
- 6.1.1 Herfindahl-Hirschman Index (HHI) – vs. 2024
- 6.1.2 Tier 1, Tier 2 & Tier 3 Market Structure
- 6.1.3 Global, Regional & Local Player Dynamics
- 6.2 Compressed Air Treatment Equipment Market Share Analysis – 2024
- 6.2.1 Global Revenue Share by Company
- 6.2.2 Global Volume Share by Company
- 6.2.3 Regional Revenue Share
- 6.2.4 Market Share Evolution ( vs. 2024)
- 6.2.5 OEM Segment Share by Company
- 6.2.6 Replacement Segment Share by Company
- 6.3 Production/Delivery Capacity & Facility Analysis
- 6.3.1 Global Installed Capacity
- 6.3.2 Capacity Utilization Rates
- 6.3.3 Production/Output Volume
- 6.3.4 Facility Locations & Capacity Map
- 6.3.5 Planned Capacity Additions
- 6.4 Compressed Air Treatment Equipment Competitive Benchmarking Matrix
- 6.4.1 Revenue, Volume, CAGR & Profitability Comparison
- 6.4.2 Channel Revenue Mix
- 6.4.3 Geographic Revenue Exposure
- 6.4.4 R&D Intensity
- 6.4.5 Sustainability Maturity
- 6.5 Strategic Developments in Compressed Air Treatment Equipment (Last 24 Months)
- 6.5.1 Mergers, Acquisitions & Divestments
- 6.5.2 New Compressed Air Treatment Equipment Launches
- 6.5.3 Facility Expansions
- 6.5.4 Strategic Alliances, Joint Ventures & Partnerships
- 6.5.5 Distribution Expansion & Market Entry
- 6.5.6 Sustainability & ESG Initiatives
- 6.6 Competitive Strategy Mapping
- 6.6.1 Leader, Challenger, Follower & Niche Classification
- 6.6.2 Pricing Strategy Comparison
- 6.6.3 Channel Strategy Matrix
Note: Strategic developments are included based on their materiality and the availability of reliable information.
Chapter 7. Global Compressed Air Treatment Equipment Market – By Distribution Channel
- 7.1 Segment Overview
- 7.1.1 Volume & Revenue Split by Channel (2024 & 2032)
- 7.1.2 Channel Mix Evolution (2024-2032)
Chapter 8. Regional Market Analysis – Global Overview
- 8.1 Global Regional Overview
- 8.1.1 Regional Volume Share
- 8.1.2 Regional Revenue Share
- 8.1.3 Regional Volume by Region
- 8.1.4 Regional Revenue by Region
- 8.1.5 Regional Forecast Through 2032
- 8.2 Cross-Regional Segment Analysis
- 8.2.1 By Distribution Channel
- 8.2.2 By Brand/Price Tier
Chapter 9. North America Compressed Air Treatment Equipment Market
- 9.1 United States
- 9.2 Canada
- 9.3 Mexico
Chapter 10. Europe Compressed Air Treatment Equipment Market
- 10.1 Germany
- 10.2 France
- 10.3 Italy
- 10.4 United Kingdom
- 10.5 Spain
- 10.6 Poland
- 10.7 Russia
- 10.8 Netherlands
- 10.9 Belgium
- 10.10 Sweden
- 10.11 Denmark
- 10.12 Norway
- 10.13 Rest of Europe
Chapter 11. Asia Pacific Compressed Air Treatment Equipment Market
- 11.1 China
- 11.2 India
- 11.3 Japan
- 11.4 South Korea
- 11.5 Thailand
- 11.6 Indonesia
- 11.7 Vietnam
- 11.8 Malaysia
- 11.9 Australia
- 11.10 Rest of Asia Pacific
Chapter 12. Latin America Compressed Air Treatment Equipment Market
- 12.1 Brazil
- 12.2 Argentina
- 12.3 Colombia
- 12.4 Chile
- 12.5 Rest of Latin America
Chapter 13. Middle East Compressed Air Treatment Equipment Market
- 13.1 Saudi Arabia
- 13.2 United Arab Emirates
- 13.3 Turkey
- 13.4 Israel
- 13.5 Iran
- 13.6 Rest of the Middle East
Chapter 14. Africa Compressed Air Treatment Equipment Market
- 14.1 South Africa
- 14.2 Egypt
- 14.3 Nigeria
- 14.4 Morocco
- 14.5 Rest of Africa
Chapter 15. Compressed Air Treatment Equipment Company Profiles
- 15.1 [Company 01]
- 15.1.1 Company Overview
- 15.1.2 Key Management Personnel
- 15.1.3 Products & Services Portfolio
- 15.1.4 Financial Performance
- 15.1.5 Key Market Focus & Geographic Presence
- 15.1.6 Recent Developments & Strategic Initiatives
Note: The company profile list is preliminary and may change based on research findings, market developments, data availability, and client requirements.
Chapter 16. Appendices
- Appendix A – List of Abbreviations & Acronyms
- Appendix B – Industry Classification Code Reference – Full Series
- Appendix C – Production & Capacity Data Tables
- Appendix D – End-Use & Demand Base Tables
- Appendix E – Consumption & Replacement Rate Assumptions
- Appendix F – ASP Reference Tables
- Appendix G – Manufacturing & Facility Database
- Appendix H – Import-Export Data Tables
- Appendix I – Regulatory Summary Tables
- Appendix J – Primary Research Participant List (Anonymized)
- Appendix K – Primary Research Questionnaire Framework
- Appendix L – Data Sources & Bibliography
- Appendix M – Market Size Divergence & Source Comparison
Chapter 17. Research Methodology
- 17.1 Research Framework & Philosophy
- 17.2 Secondary Research – Sources, Hierarchy & Data Extraction
- 17.3 Data Modeling – Bottom-Up & Top-Down Market Sizing
- 17.4 Primary Research – Stakeholder Framework, LOI & Sample Sizes
- 17.5 Forecast Methodology – Regression, Scenario & Sensitivity Analysis
- 17.6 Quality Control – Four-Layer Validation Framework
- 17.7 Limitations & Standard Assumptions
- 17.8 Disclaimer