CHAPTER NO. 1 : INTRODUCTION 17
1.1.1. Report Description 17
Purpose of the Report 17
USP & Key Type 17
1.1.2. Key Benefits for Stakeholders 17
1.1.3. Target Audience 18
1.1.4. Report Scope 18
CHAPTER NO. 2 : EXECUTIVE SUMMARY 19
2.1. Industrial Hemp Market Snapshot 19
2.1.1. U.S. Industrial Hemp Market, 2018 – 2032 (USD Million) 20
CHAPTER NO. 3 : GEOPOLITICAL CRISIS IMPACT ANALYSIS 21
3.1. Russia-Ukraine and Israel-Palestine War Impacts 21
CHAPTER NO. 4 : INDUSTRIAL HEMP MARKET – INDUSTRY ANALYSIS 22
4.1. Introduction 22
4.2. Market Drivers 23
4.2.1. Driving Factor 1 Analysis 23
4.2.2. Driving Factor 2 Analysis 24
4.3. Market Restraints 25
4.3.1. Restraining Factor Analysis 25
4.4. Market Opportunities 26
4.4.1. Market Opportunities Analysis 26
4.5. Porter’s Five Force analysis 27
4.6. Value Chain Analysis 28
4.7. Buying Criteria 29
CHAPTER NO. 5 : ANALYSIS COMPETITIVE LANDSCAPE 30
5.1. Company Market Share Analysis – 2023 30
5.1.1. U.S. Industrial Hemp Market: Company Market Share, by Revenue, 2023 30
5.1.2. U.S. Industrial Hemp Market: Top 6 Company Market Share, by Revenue, 2023 30
5.1.3. U.S. Industrial Hemp Market: Top 3 Company Market Share, by Revenue, 2023 31
5.2. U.S. Industrial Hemp Market Company Revenue Market Share, 2023 32
5.3. Company Assessment Metrics, 2023 33
5.3.1. Stars 33
5.3.2. Emerging Leaders 33
5.3.3. Pervasive Players 33
5.3.4. Participants 33
5.4. Start-ups /Code Assessment Metrics, 2023 33
5.4.1. Progressive Companies 33
5.4.2. Responsive Companies 33
5.4.3. Dynamic Companies 33
5.4.4. Starting Blocks 33
5.5. Strategic Developments 34
5.5.1. Acquisition & Mergers 34
New Product Launch 34
Regional Expansion 34
5.6. Key Players Product Matrix 35
CHAPTER NO. 6 : PESTEL & ADJACENT MARKET ANALYSIS 36
6.1. PESTEL 36
6.1.1. Political Factors 36
6.1.2. Economic Factors 36
6.1.3. Social Factors 36
6.1.4. Technological Factors 36
6.1.5. Environmental Factors 36
6.1.6. Legal Factors 36
6.2. Adjacent Market Analysis 36
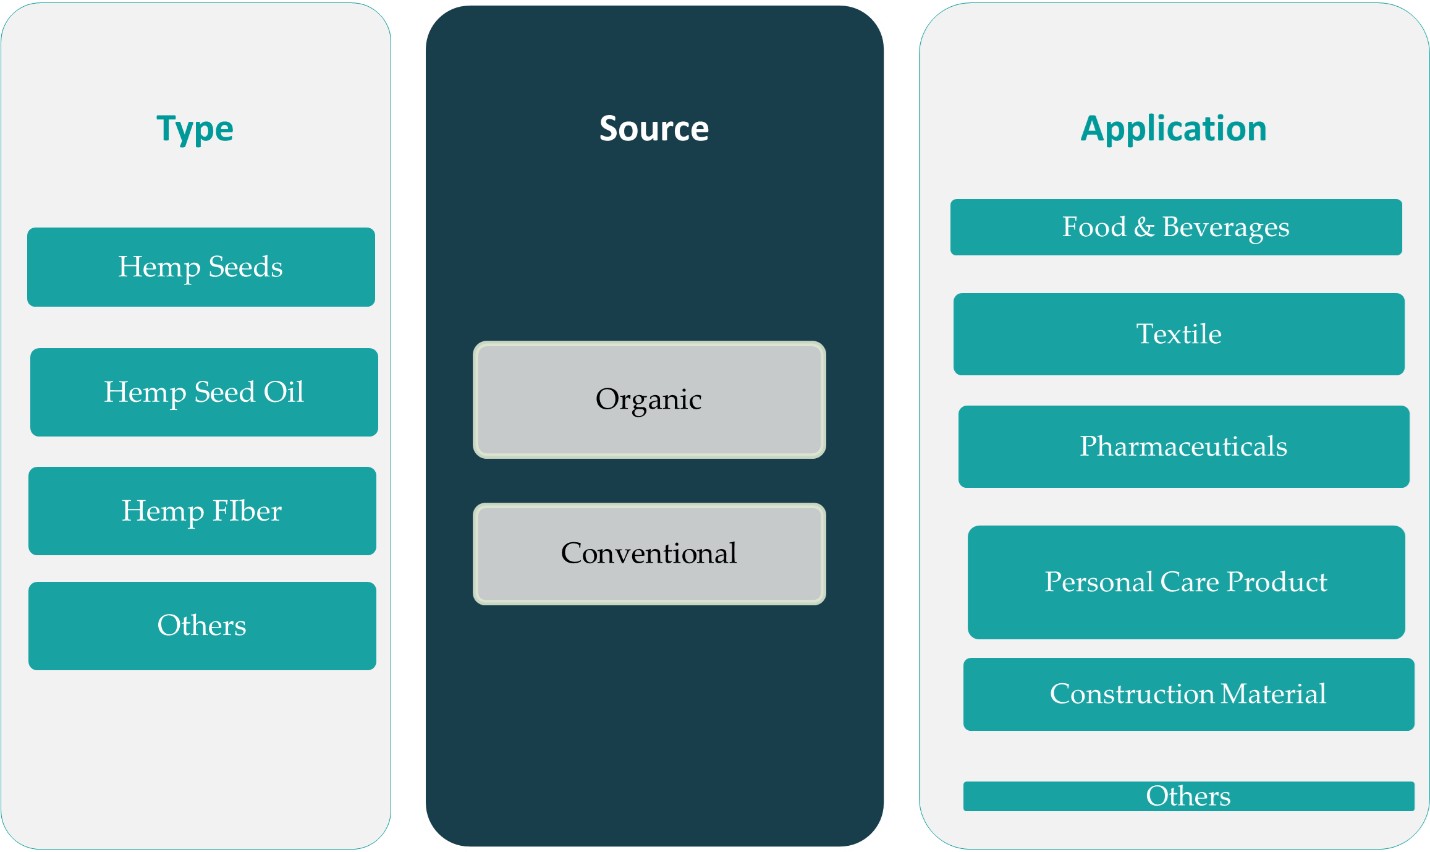
CHAPTER NO. 7 : INDUSTRIAL HEMP MARKET – BY TYPE SEGMENT ANALYSIS 37
7.1. Industrial Hemp Market Overview, by Type Segment 37
7.1.1. Industrial Hemp Market Revenue Share, By Type, 2023 & 2032 38
7.1.2. Industrial Hemp Market Attractiveness Analysis, By Type 39
7.1.3. Incremental Revenue Growth Opportunities, by Type, 2024 – 2032 39
7.1.4. Industrial Hemp Market Revenue, By Type, 2018, 2023, 2027 & 2032 40
7.2. Hemp Seed 41
7.3. Hemp Seed Oil 42
7.4. Hemp Fiber 43
7.5. Others 44
CHAPTER NO. 8 : INDUSTRIAL HEMP MARKET – BY SOURCE SEGMENT ANALYSIS 45
8.1. Industrial Hemp Market Overview, by Source Segment 45
8.1.1. Industrial Hemp Market Revenue Share, By Source, 2023 & 2032 46
8.1.2. Industrial Hemp Market Attractiveness Analysis, By Source 47
8.1.3. Incremental Revenue Growth Opportunities, by Source, 2024 – 2032 47
8.1.4. Industrial Hemp Market Revenue, By Source, 2018, 2023, 2027 & 2032 48
8.2. Organic 49
8.3. Conventional 50
CHAPTER NO. 9 : INDUSTRIAL HEMP MARKET – BY APPLICATION SEGMENT ANALYSIS 51
9.1. Industrial Hemp Market Overview, by Application Segment 51
9.1.1. Industrial Hemp Market Revenue Share, By Application, 2023 & 2032 52
9.1.2. Industrial Hemp Market Attractiveness Analysis, By Application 53
9.1.3. Incremental Revenue Growth Opportunities, by Application, 2024 – 2032 53
9.1.4. Industrial Hemp Market Revenue, By Application, 2018, 2023, 2027 & 2032 54
9.2. Food & Beverages 55
9.3. Textile 56
9.4. Pharmaceuticals 57
9.5. Pharmaceuticals 58
9.6. Construction Material 59
9.7. Others 60
CHAPTER NO. 10 : INDUSTRIAL HEMP MARKET – U.S. 61
10.1. U.S. 61
10.1.1. Key Highlights 61
10.2. Type 62
10.3. U.S. Industrial Hemp Market Revenue, By Type, 2018 – 2023 (USD Million) 62
10.4. U.S. Industrial Hemp Market Revenue, By Type, 2024 – 2032 (USD Million) 62
10.5. Source 63
10.6. U.S. Industrial Hemp Market Revenue, By Source, 2018 – 2023 (USD Million) 63
10.6.1. U.S. Industrial Hemp Market Revenue, By Source, 2024 – 2032 (USD Million) 63
10.7. Application 64
10.8. U.S. Industrial Hemp Market Revenue, By Application, 2018 – 2023 (USD Million) 64
10.8.1. U.S. Industrial Hemp Market Revenue, By Application, 2024 – 2032 (USD Million) 64
CHAPTER NO. 11 : COMPANY PROFILES 65
11.1. Curaleaf Holdings, Inc. 65
11.1.1. Company Overview 65
11.1.2. Product Portfolio 65
11.1.3. Swot Analysis 65
11.1.4. Business Strategy 66
11.1.5. Financial Overview 66
11.2. Green Thumb Industries 67
11.3. Canopy Gowth Corporation 67
11.4. GenCanna 67
11.5. IND HEMP 67
11.6. Hemp Inc 67
11.7. Marijuana Company Of America Inc 67
11.8. American Hemp LLC 67
11.9. Green Field Paper Company 67
11.10. Hemp Horizon 67
11.11. Rawganic 67
11.12. Company 12 67
11.13. Company 13 67
11.14. Company 14 67
11.15. Others 67
]
List of Figures
FIG NO. 1. U.S. Industrial Hemp Market Revenue, 2018 – 2032 (USD Million) 20
FIG NO. 2. Porter’s Five Forces Analysis for U.S. Industrial Hemp Market 27
FIG NO. 3. Value Chain Analysis for U.S. Industrial Hemp Market 28
FIG NO. 4. Company Share Analysis, 2023 30
FIG NO. 5. Company Share Analysis, 2023 30
FIG NO. 6. Company Share Analysis, 2023 31
FIG NO. 7. Industrial Hemp Market – Company Revenue Market Share, 2023 32
FIG NO. 8. Industrial Hemp Market Revenue Share, By Type, 2023 & 2032 38
FIG NO. 9. Market Attractiveness Analysis, By Type 39
FIG NO. 10. Incremental Revenue Growth Opportunities by Type, 2024 – 2032 39
FIG NO. 11. Industrial Hemp Market Revenue, By Type, 2018, 2023, 2027 & 2032 40
FIG NO. 12. U.S. Industrial Hemp Market for Hemp Seed, Revenue (USD Million) 2018 – 2032 41
FIG NO. 13. U.S. Industrial Hemp Market for Hemp Seed Oil, Revenue (USD Million) 2018 – 2032 42
FIG NO. 14. U.S. Industrial Hemp Market for Hemp Fiber, Revenue (USD Million) 2018 – 2032 43
FIG NO. 15. U.S. Industrial Hemp Market for Others, Revenue (USD Million) 2018 – 2032 44
FIG NO. 16. Industrial Hemp Market Revenue Share, By Source, 2023 & 2032 46
FIG NO. 17. Market Attractiveness Analysis, By Source 47
FIG NO. 18. Incremental Revenue Growth Opportunities by Source, 2024 – 2032 47
FIG NO. 19. Industrial Hemp Market Revenue, By Source, 2018, 2023, 2027 & 2032 48
FIG NO. 20. U.S. Industrial Hemp Market for Organic, Revenue (USD Million) 2018 – 2032 49
FIG NO. 21. U.S. Industrial Hemp Market for Conventional, Revenue (USD Million) 2018 – 2032 50
FIG NO. 22. Industrial Hemp Market Revenue Share, By Application, 2023 & 2032 52
FIG NO. 23. Market Attractiveness Analysis, By Application 53
FIG NO. 24. Incremental Revenue Growth Opportunities by Application, 2024 – 2032 53
FIG NO. 25. Industrial Hemp Market Revenue, By Application, 2018, 2023, 2027 & 2032 54
FIG NO. 26. U.S. Industrial Hemp Market for Food & Beverages, Revenue (USD Million) 2018 – 2032 55
FIG NO. 27. U.S. Industrial Hemp Market for Textile, Revenue (USD Million) 2018 – 2032 56
FIG NO. 28. U.S. Industrial Hemp Market for Pharmaceuticals, Revenue (USD Million) 2018 – 2032 57
FIG NO. 29. U.S. Industrial Hemp Market for Pharmaceuticals, Revenue (USD Million) 2018 – 2032 58
FIG NO. 30. U.S. Industrial Hemp Market for Construction Material, Revenue (USD Million) 2018 – 2032 59
FIG NO. 31. U.S. Industrial Hemp Market for Others, Revenue (USD Million) 2018 – 2032 60
FIG NO. 32. U.S. Industrial Hemp Market Revenue, 2018 – 2032 (USD Million) 61
List of Tables
TABLE NO. 1. : U.S. Industrial Hemp Market: Snapshot 19
TABLE NO. 2. : Drivers for the Industrial Hemp Market: Impact Analysis 23
TABLE NO. 3. : Restraints for the Industrial Hemp Market: Impact Analysis 25
TABLE NO. 4. : U.S. Industrial Hemp Market Revenue, By Type, 2018 – 2023 (USD Million) 62
TABLE NO. 5. : U.S. Industrial Hemp Market Revenue, By Type, 2024 – 2032 (USD Million) 62
TABLE NO. 6. : U.S. Industrial Hemp Market Revenue, By Source, 2018 – 2023 (USD Million) 63
TABLE NO. 7. : U.S. Industrial Hemp Market Revenue, By Source, 2024 – 2032 (USD Million) 63
TABLE NO. 8. : U.S. Industrial Hemp Market Revenue, By Application, 2018 – 2023 (USD Million) 64
TABLE NO. 9. : U.S. Industrial Hemp Market Revenue, By Application, 2024 – 2032 (USD Million) 64