Market Overview
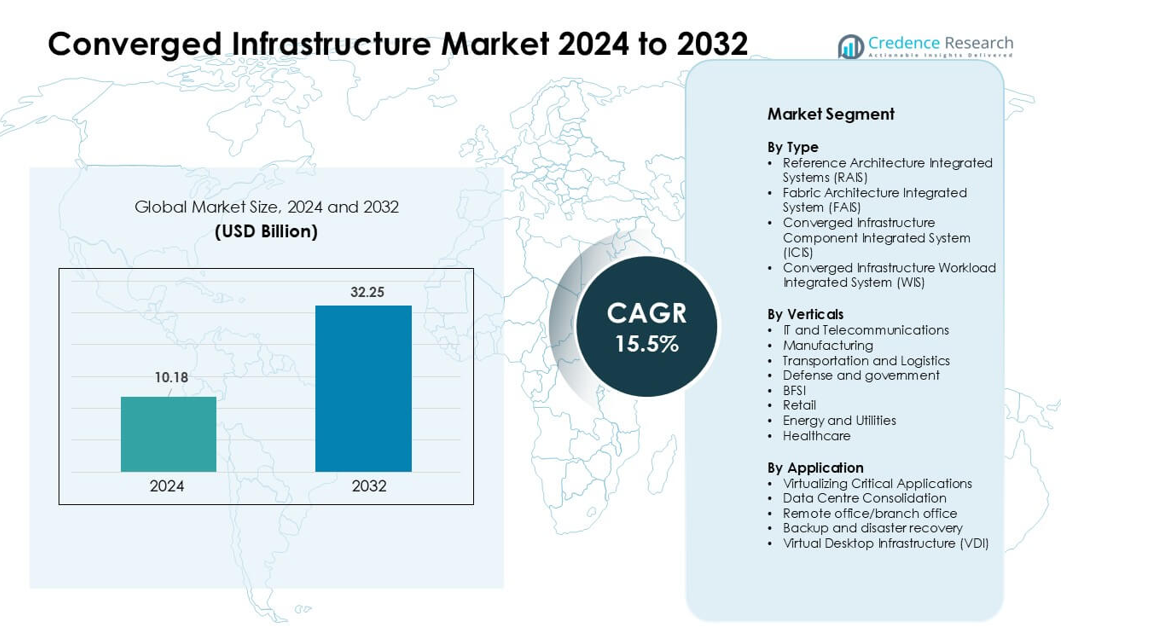
Converged Infrastructure Market was valued at USD 10.18 billion in 2024 and is anticipated to reach USD 32.25 billion by 2032, growing at a CAGR of 15.5 % during the forecast period.
| REPORT ATTRIBUTE |
DETAILS |
| Historical Period |
2020-2023 |
| Base Year |
2024 |
| Forecast Period |
2025-2032 |
| Converged Infrastructure Market Size 2024 |
USD 10.18 billion |
| Converged Infrastructure Market, CAGR |
15.5% |
| Converged Infrastructure Market Size 2032 |
USD 32.25 billion |
The converged infrastructure market includes key players such as Scale Computing, Huawei Technologies Co., Ltd., Quantum Corporation, Cisco Systems, Inc., NetApp, Microsoft, Broadcom, Nutanix, Hewlett Packard Enterprise Development LP, and Dell Inc. These companies compete through integrated platforms that simplify deployment, enhance workload performance, and support hybrid-cloud environments. Strong portfolios in software-defined storage, automation, and edge-ready systems help them serve enterprise and telecom demand. North America remained the leading region in 2024 with about 38% share, supported by high IT spending, rapid cloud adoption, and strong vendor presence across large and mid-sized enterprises
Market Insights
- The converged infrastructure market reached USD 10.18 billion in 2024 and is projected to hit USD 32.25 billion by 2032, growing at a CAGR of 15.5%.
- Demand rose as enterprises shifted to simplified architectures that merge compute, storage, and networking into unified systems for faster deployment and lower management effort.
- Trends showed strong movement toward hybrid-cloud integration, edge-ready systems, and software-defined designs, with workload-optimized platforms gaining steady traction across IT and telecom.
- Competition intensified among vendors offering automation, high-performance systems, and secure virtualization, with leading firms expanding through cloud partnerships and workload-specific solutions.
- North America led with 38% share, while Virtualizing Critical Applications remained the largest application segment; Asia Pacific showed the fastest growth due to rising data-centre modernization and strong enterprise cloud adoption.
Access crucial information at unmatched prices!
Request your sample report today & start making informed decisions powered by Credence Research Inc.!
Download Sample
Market Segmentation Analysis:
By Type
Reference Architecture Integrated Systems (RAIS) held the largest share in 2024 due to strong adoption among enterprises seeking faster deployment and reduced integration effort. RAIS gained traction because vendors offer pre-validated designs that cut setup time and improve reliability for cloud and analytics workloads. Fabric Architecture Integrated Systems expanded as hyperscale environments used high-speed fabrics for better throughput. ICIS solutions grew in mixed-vendor environments, while WIS adoption increased in AI, ERP, and database-focused deployments that benefit from workload-specific optimization.
- For instance, Cisco’s Nexus HyperFabric AI cluster uses Cisco Nexus 9000 series spine and leaf switches that support 400G and 800G Ethernet. These switches are designed for high-bandwidth AI and cloud workloads and provide low-latency, high-throughput data-center networking. This capability helps enterprises scale converged and AI-driven infrastructure.
By Verticals
IT and Telecommunications dominated the verticals segment in 2024 with the highest share, supported by rising demand for unified systems that manage heavy data traffic and virtualized network functions. This sector adopted converged setups to boost agility, reduce downtime, and simplify scaling across core and edge sites. Manufacturing and transportation also expanded use as smart-factory and logistics automation increased. BFSI and healthcare grew adoption for compliance-driven workloads, while energy and retail used converged setups to manage distributed operations.
- For instance, Reliance Jio partnered with Cisco to deploy an end-to-end converged IP network built on Cisco 8000 Series Routers and cloud-native broadband gateway architecture. The network design supports massive national-scale capacity for hundreds of millions of mobile and home broadband users. This setup helps Jio deliver high-speed, scalable connectivity across India.
By Application
Virtualizing Critical Applications led the application segment in 2024, recording the largest share due to high deployment in ERP, CRM, analytics, and AI workloads. Organizations preferred this segment because converged infrastructure boosts processing speed, lowers latency, and ensures predictable performance for mission-critical systems. Data Centre Consolidation accelerated as firms reduced hardware sprawl and operating cost. Backup and disaster recovery grew with rising cybersecurity concerns, while VDI adoption expanded in hybrid-work environments seeking centralized management and stronger security.
Key Growth Drivers
Rising Demand for Simplified IT Management
Enterprises adopt converged infrastructure to reduce complexity in managing diverse hardware, storage, and networking layers. Many organizations face rising workloads, larger data volumes, and pressure to support cloud-native systems. Converged platforms help streamline operations by combining core components into a single, pre-validated system that cuts manual integration and reduces the need for specialized staff. This approach improves deployment speed and lowers operational effort for teams that handle critical applications. Businesses also value predictable performance, which helps maintain stable uptime. As workloads expand across hybrid setups, simplified management becomes a strong reason for firms to shift from traditional siloed infrastructure.
- For instance, Dell Technologies’ VxBlock System 1000 is a pre-engineered converged system that integrates Cisco UCS compute, Dell storage platforms, and VMware virtualization. The system supports unified lifecycle automation through VMware Cloud Foundation. It reduces manual configuration by using standardized, policy-based management across the stack.
Expanding Hybrid and Multi-Cloud Adoption
The fast growth of hybrid and multi-cloud strategies drives demand for converged infrastructure because enterprises need unified systems that support both on-premises and cloud-linked workloads. These systems create a stable foundation for moving data between cloud services and internal environments. Organizations use converged architecture to reduce latency, improve security control, and maintain cost predictability when running sensitive workloads outside public clouds. Many firms also adopt modern platforms to improve integration with virtual machines and containers. As cloud use expands, converged setups help maintain consistent performance and reduce mistakes linked to complex multi-platform management.
- For instance, Cisco HyperFlex combines Cisco UCS compute with the HX Data Platform to deliver a unified hyperconverged system with built-in support for VMware environments and Kubernetes through the HyperFlex Application Platform. The platform provides log-structured, distributed storage with inline deduplication and compression.
Increasing Need for High-Performance Workload Optimization
Companies rely on converged systems to support workloads that demand faster processing, better storage throughput, and consistent system behavior. AI, analytics, ERP, and virtualization tasks benefit from tightly integrated compute and storage layers that reduce delays. Converged platforms deliver tuned performance for these workloads by aligning hardware and software under a unified design. This alignment helps firms run heavy applications without unexpected bottlenecks. As more sectors adopt data-intensive operations, demand rises for systems that can scale smoothly. Improved reliability and reduced downtime further strengthen the push toward performance-optimized converged designs.
Key Trend & Opportunity
Growth of Edge Deployments and Distributed Workloads
Edge computing expands the opportunity for converged infrastructure as companies run analytics, IoT, and real-time apps closer to users. Many sectors invest in compact, high-performance converged systems that operate in factories, retail sites, hospitals, and remote facilities. These setups improve response time and help reduce network pressure by handling tasks locally. Vendors now design ruggedized and modular systems suited for edge conditions. As distributed workloads grow, converged platforms create strong value by enabling unified control across many small locations. This shift supports industries that need steady uptime and simple remote management.
- For instance, HPE’s Edgeline EL8000 converged edge system supports up to four independent server nodes in a 17-inch-deep chassis and delivers GPU-accelerated processing for real-time analytics, enabling deployments in telecom, manufacturing, and rugged field conditions.
Rising Integration of AI-Driven Automation
AI-based tools create a major opportunity for converged infrastructure by improving monitoring, predictive maintenance, and resource optimization. Vendors now embed intelligent automation into management consoles to track performance, detect failures early, and tune resources without manual checks. These functions help reduce downtime and improve long-term system efficiency. AI-driven insights also support capacity planning as workloads expand. Companies benefit from automated adjustments that keep virtual machines, storage pools, and networking stable under changing load conditions. As automation becomes standard in modern IT, converged platforms with built-in AI gain wider acceptance.
- For instance, Nutanix Cloud Platform delivers software-defined storage and networking through its Acropolis Operating System, supporting linear scaling from a three-node cluster to hundreds of nodes while maintaining predictable performance through distributed metadata and automated data balancing.
Strong Shift Toward Software-Defined Infrastructure
The move toward software-defined systems opens new opportunities for converged infrastructure because enterprises prefer flexible designs over fixed hardware setups. Software-defined storage, networking, and compute give businesses more control over performance, security, and scaling. Vendors integrate these features into converged systems to help customers adopt cloud-style agility on-premises. This approach supports automation, improves resource pooling, and enables faster provisioning for new applications. As firms aim to modernize data centres without heavy redesigns, software-driven converged infrastructure becomes a practical option for long-term upgrades.
Key Challenge
High Upfront Investment and Integration Shift
Many organizations hesitate to adopt converged infrastructure due to high initial cost. These systems combine premium hardware and advanced software features, which raise the capital required in early stages. Firms that run older setups may also face additional cost to replace legacy servers and storage units. Transitioning to an integrated model requires training and changes to internal processes, which slows decision-making. Although long-term savings are possible, the upfront shift often challenges small and mid-sized companies. Budget limits and uncertainty about workload expansion make adoption slower across several sectors.
Risk of Vendor Lock-In and Limited Flexibility
A major challenge in converged infrastructure is the risk of depending heavily on one vendor for compute, storage, networking, and support. These systems are designed as unified packages, which reduces the ability to mix components from different suppliers. Companies may face issues if pricing changes or product lines evolve. Some firms also find it difficult to adjust capacity if the vendor’s roadmap does not match future workload needs. This dependence lowers flexibility and makes long-term planning more complex. As a result, organizations review vendor strategies carefully before adopting converged systems.
Regional Analysis
North America
North America held the largest share in 2024 due to strong enterprise adoption of virtualized workloads, cloud-linked systems, and high-performance data centre upgrades. Large companies in the United States led deployments to support AI, analytics, and hybrid-cloud expansion. Many firms preferred converged platforms to reduce integration effort and improve uptime across distributed sites. Investments in edge computing and 5G networks further supported adoption in telecom and managed service sectors. Canada also expanded use in healthcare and BFSI. The region’s advanced IT spending and focus on operational efficiency kept North America in a leading position.
Europe
Europe recorded the second-largest share in 2024 as organizations invested in converged systems to support digital transformation, data governance, and secure on-premises workloads. Strong demand came from Germany, the United Kingdom, and France, where enterprises used converged setups to reduce hardware sprawl and meet compliance needs. Manufacturing, energy, and public sector users increased adoption to manage critical applications with consistent performance. Edge deployments grew in logistics and automotive hubs. Rising interest in software-defined systems and hybrid-cloud integration helped strengthen the regional market across mid-sized and large enterprises.
Asia Pacific
Asia Pacific achieved fast growth and held a significant share in 2024 driven by rapid modernization of data centres, high cloud adoption, and strong investment from telecom, BFSI, and manufacturing sectors. China, India, Japan, and South Korea increased use of converged platforms to run analytics, ERP, and virtualized workloads at scale. Expanding 5G rollouts and edge computing deployments pushed demand for compact, high-performance systems. Many regional enterprises selected converged designs to improve workload efficiency and reduce operational load. Rising digital infrastructure spending positioned Asia Pacific as the fastest-growing regional market.
Latin America
Latin America maintained a moderate share in 2024, supported by rising digitalization across Brazil, Mexico, and Chile. Enterprises adopted converged systems to streamline IT operations and enhance performance for critical workloads in retail, telecom, and banking. Many firms used these platforms to consolidate ageing data centre hardware and reduce operating cost. Growth was also driven by expanding cloud connectivity and the need for better security management. Despite budget constraints, the region showed steady movement toward simplified infrastructure models to support modern applications.
Middle East & Africa
The Middle East & Africa held a smaller yet expanding share in 2024, driven by ongoing investment in digital transformation across the UAE, Saudi Arabia, and South Africa. Organizations deployed converged infrastructure to support cloud migration, government digital projects, and analytics-based operations. Telecom providers and energy companies adopted integrated systems to improve reliability and manage distributed workloads. Growing interest in edge computing and cybersecurity readiness supported further upgrades. Although adoption varies by country, rising regional IT spending helped strengthen market penetration across key sectors.
Market Segmentations:
By Type
- Reference Architecture Integrated Systems (RAIS)
- Fabric Architecture Integrated System (FAIS)
- Converged Infrastructure Component Integrated System (ICIS)
- Converged Infrastructure Workload Integrated System (WIS)
By Verticals
- IT and Telecommunications
- Manufacturing
- Transportation and Logistics
- Defense and government
- BFSI
- Retail
- Energy and Utilities
- Healthcare
By Application
- Virtualizing Critical Applications
- Data Centre Consolidation
- Remote office/branch office
- Backup and disaster recovery
- Virtual Desktop Infrastructure (VDI)
By Geography
- North America
- Europe
- Germany
- France
- U.K.
- Italy
- Spain
- Rest of Europe
- Asia Pacific
- China
- Japan
- India
- South Korea
- South-east Asia
- Rest of Asia Pacific
- Latin America
- Brazil
- Argentina
- Rest of Latin America
- Middle East & Africa
- GCC Countries
- South Africa
- Rest of the Middle East and Africa
Competitive Landscape
The competitive landscape of the converged infrastructure market features major players such as Scale Computing, Huawei Technologies Co., Ltd., Quantum Corporation, Cisco Systems, Inc., NetApp, Microsoft, Broadcom, Nutanix, Hewlett Packard Enterprise Development LP, and Dell Inc. These companies compete by offering integrated platforms that combine compute, storage, networking, and virtualization under unified architectures. Vendors focus on performance gains, simplified management, and strong hybrid-cloud integration to serve enterprise workloads. Many firms strengthen portfolios with AI-driven automation, software-defined features, and edge-ready systems. Partnerships with cloud providers, managed service operators, and telecom firms expand market reach. Continuous product upgrades, security enhancements, and workload-optimized designs support strong positioning. North America holds the highest share due to deep vendor presence and high enterprise adoption.
Shape Your Report to Specific Countries or Regions & Enjoy 30% Off!
Key Player Analysis
Recent Developments
- In November 2025, Dell Technologies Michael Dell stated that the VMware-based VxRail hyperconverged platform is no longer a thing, as Dell shifts focus toward its own storage and private cloud offerings and incentivizes partners to move customers from VxRail to newer Dell Private Cloud solutions.
- In June 2025 Huawei Technologies Co., Ltd.: The OceanStor Dorado All‑Flash Storage got listed among the 2025–26 DCIG Top 5 Cybersecure 10 PB+ NAS Solutions, highlighting its resilience, ransomware protection, reliability, and suitability for large-scale enterprise storage.
Report Coverage
The research report offers an in-depth analysis based on Type, Verticals, Application and Geography. It details leading market players, providing an overview of their business, product offerings, investments, revenue streams, and key applications. Additionally, the report includes insights into the competitive environment, SWOT analysis, current market trends, as well as the primary drivers and constraints. Furthermore, it discusses various factors that have driven market expansion in recent years. The report also explores market dynamics, regulatory scenarios, and technological advancements that are shaping the industry. It assesses the impact of external factors and global economic changes on market growth. Lastly, it provides strategic recommendations for new entrants and established companies to navigate the complexities of the market
Future Outlook
- Converged systems will gain wider use as enterprises modernize data centres for higher efficiency.
- Hybrid-cloud adoption will push firms to deploy integrated platforms that support seamless workload mobility.
- AI-driven automation will enhance system monitoring, predictive repairs, and resource optimization.
- Edge computing growth will raise demand for compact, rugged, and remote-managed converged setups.
- Software-defined functions will expand, making systems more flexible and easier to scale.
- Security-focused architectures will grow as firms protect critical applications and sensitive data.
- Workload-specific platforms will rise due to growing use of analytics, ERP, and virtualization.
- Partnerships between vendors and cloud providers will deepen to support multi-cloud strategies.
- Reduced hardware sprawl and lower operating cost will continue to attract mid-sized firms.
- Global adoption will strengthen as telecom, BFSI, healthcare, and manufacturing increase investment.


