CHAPTER NO. 1 : INTRODUCTION 29
1.1.1. Report Description 29
Purpose of the Report 29
USP & Key Offerings 29
1.1.2. Key Benefits for Stakeholders 29
1.1.3. Target Audience 30
1.1.4. Report Scope 30
1.1.5. Regional Scope 31
CHAPTER NO. 2 : EXECUTIVE SUMMARY 32
2.1. Corporate Training Market Snapshot 32
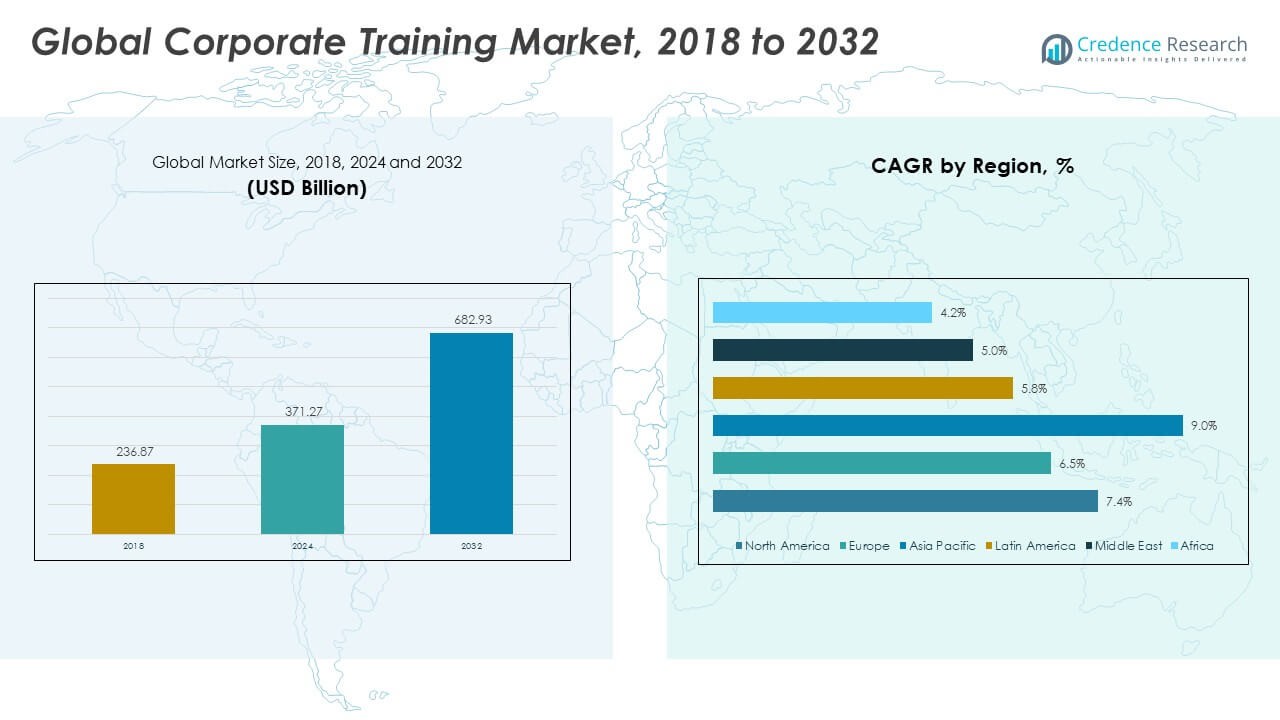
2.1.1. Global Corporate Training Market, 2018 – 2032 (USD Million) 34
CHAPTER NO. 3 : CORPORATE TRAINING MARKET – INDUSTRY ANALYSIS 35
3.1. Introduction 35
3.2. Market Drivers 36
3.2.1. Increasing Need for Workforce Upskilling & Digital Skills 36
3.2.2. Rapid Technological Advancements (AI, Automation, Cybersecurity) 37
3.3. Market Restraints 38
3.3.1. High Cost of Customized Training Programs 38
3.4. Market Opportunities 39
3.4.1. Market Opportunity Analysis 39
3.5. Porter’s Five Forces Analysis 40
3.6. Value Chain Analysis 41
3.7. Buying Criteria 42
CHAPTER NO. 4 : ANALYSIS COMPETITIVE LANDSCAPE 43
4.1. Company Market Share Analysis – 2024 43
4.1.1. Global Corporate Training Market: Company Market Share, by Volume, 2024 43
4.1.2. Global Corporate Training Market: Company Market Share, by Revenue, 2024 44
4.1.3. Global Corporate Training Market: Top 6 Company Market Share, by Revenue, 2024 44
4.1.4. Global Corporate Training Market: Top 3 Company Market Share, by Revenue, 2024 45
4.2. Global Corporate Training Market Company Volume Market Share, 2024 46
4.3. Global Corporate Training Market Company Revenue Market Share, 2024 47
4.4. Company Assessment Metrics, 2023 48
4.4.1. Stars 48
4.4.2. Emerging Leaders 48
4.4.3. Pervasive Players 48
4.4.4. Participants 48
4.5. Start-ups /SMEs Assessment Metrics, 2023 48
4.5.1. Progressive Companies 48
4.5.2. Responsive Companies 48
4.5.3. Dynamic Companies 48
4.5.4. Starting Blocks 48
4.6. Strategic Developments 49
4.6.1. Acquisitions & Mergers 49
New Product Launch 49
Regional Expansion 49
4.7. Key Players Product Matrix 50
CHAPTER NO. 5 : PESTEL & ADJACENT MARKET ANALYSIS 51
5.1. PESTEL 51
5.1.1. Political Factors 51
5.1.2. Economic Factors 51
5.1.3. Social Factors 51
5.1.4. Technological Factors 51
5.1.5. Environmental Factors 51
5.1.6. Legal Factors 51
5.2. Adjacent Market Analysis 51
CHAPTER NO. 6 : CORPORATE TRAINING MARKET – BY TRAINING DELIVERY METHODS SEGMENT ANALYSIS 52
6.1. Corporate Training Market Overview, by Training Delivery Methods Segment 52
6.1.1. Corporate Training Market Revenue Share, By Training Delivery Methods, 2023 & 2032 53
6.1.2. Corporate Training Market Attractiveness Analysis, By Training Delivery Methods 54
6.1.3. Incremental Revenue Growth Opportunity, by Training Delivery Methods, 2024 – 2032 54
6.1.4. Corporate Training Market Revenue, By Training Delivery Methods, 2018, 2023, 2027 & 2032 55
6.2. In-Person Training 56
6.3. Online or E-Learning 57
6.4. Blended Learning 58
6.5. Virtual Instructor-Led Training (VILT) 59
6.6. On-Demand and Self-Paced Learning 60
6.7. Mobile Learning 61
6.8. Simulations and Gamification 62
6.9. Video-Based Training 63
CHAPTER NO. 7 : CORPORATE TRAINING MARKET – BY TRAINING TOPICS AND SUBJECTS SEGMENT ANALYSIS 64
7.1. Corporate Training Market Overview, by Training Topics and Subjects Segment 64
7.1.1. Corporate Training Market Revenue Share, By Training Topics and Subjects, 2023 & 2032 65
7.1.2. Corporate Training Market Attractiveness Analysis, By Training Topics and Subjects 66
7.1.3. Incremental Revenue Growth Opportunity, by Training Topics and Subjects, 2024 – 2032 66
7.1.4. Corporate Training Market Revenue, By Training Topics and Subjects, 2018, 2023, 2027 & 2032 67
7.2. Leadership and Management Training 68
7.3. Technical and IT Training 69
7.4. Soft Skills and Communication Training 70
7.5. Compliance and Regulatory Training 71
7.6. Sales and Marketing Training 72
7.7. Customer Service and Support Training 73
7.8. Diversity and Inclusion Training 74
7.9. Cybersecurity Training 75
7.10. Health and Safety Training 76
7.11. Project Management Training 77
7.12. Language and Cultural Training 78
CHAPTER NO. 8 : CORPORATE TRAINING MARKET – BY COMPANY SIZE SEGMENT ANALYSIS 79
8.1. Corporate Training Market Overview, by Company Size Segment 79
8.1.1. Corporate Training Market Revenue Share, By Company Size, 2023 & 2032 80
8.1.2. Corporate Training Market Attractiveness Analysis, By Company Size 81
8.1.3. Incremental Revenue Growth Opportunity, by Company Size, 2024 – 2032 81
8.1.4. Corporate Training Market Revenue, By Company Size, 2018, 2023, 2027 & 2032 82
8.2. Small and Medium-sized Enterprises (SMEs) 83
8.3. Large Enterprises 84
CHAPTER NO. 9 : CORPORATE TRAINING MARKET – BY TRAINING PROVIDERS SEGMENT ANALYSIS 85
9.1. Corporate Training Market Overview, by Training Providers Segment 85
9.1.1. Corporate Training Market Revenue Share, By Training Providers, 2023 & 2032 86
9.1.2. Corporate Training Market Attractiveness Analysis, By Training Providers 87
9.1.3. Incremental Revenue Growth Opportunity, by Training Providers, 2024 – 2032 87
9.1.4. Corporate Training Market Revenue, By Training Providers, 2018, 2023, 2027 & 2032 88
9.2. Internal Training Departments 89
9.3. External Training Providers 90
9.4. Universities and Educational Institutions 91
9.5. Online Learning Platforms 92
CHAPTER NO. 10 : CORPORATE TRAINING MARKET – BY CUSTOMIZATION AND TAILORED TRAINING SEGMENT ANALYSIS 93
10.1. Corporate Training Market Overview, by Customization and Tailored Training Segment 93
10.1.1. Corporate Training Market Revenue Share, By Customization and Tailored Training, 2023 & 2032 94
10.1.2. Corporate Training Market Attractiveness Analysis, By Customization and Tailored Training 95
10.1.3. Incremental Revenue Growth Opportunity, by Customization and Tailored Training, 2024 – 2032 95
10.1.4. Corporate Training Market Revenue, By Customization and Tailored Training, 2018, 2023, 2027 & 2032 96
10.2. Off-the-Shelf Training Programs 97
10.3. Customized and Tailored Training 98
CHAPTER NO. 11 : CORPORATE TRAINING MARKET – BY INDUSTRY VERTICAL SEGMENT ANALYSIS 99
11.1. Corporate Training Market Overview, by Industry Vertical Segment 99
11.1.1. Corporate Training Market Revenue Share, By Industry Vertical, 2023 & 2032 100
11.1.2. Corporate Training Market Attractiveness Analysis, By Industry Vertical 101
11.1.3. Incremental Revenue Growth Opportunity, by Industry Vertical, 2024 – 2032 101
11.1.4. Corporate Training Market Revenue, By Industry Vertical, 2018, 2023, 2027 & 2032 102
11.2. IT and Technology 103
11.3. Healthcare 104
11.4. Finance and Banking 105
11.5. Manufacturing 106
11.6. Retail 107
11.7. Hospitality and Tourism 108
11.8. Education 109
11.9. Government and Public Sector 110
CHAPTER NO. 12 : CORPORATE TRAINING MARKET – REGIONAL ANALYSIS 111
12.1. Corporate Training Market Overview, by Regional Segments 111
12.2. Region 112
12.2.1. Global Corporate Training Market Revenue Share, By Region, 2023 & 2032 112
12.2.2. Corporate Training Market Attractiveness Analysis, By Region 113
12.2.3. Incremental Revenue Growth Opportunity, by Region, 2024 – 2032 113
12.2.4. Corporate Training Market Revenue, By Region, 2018, 2023, 2027 & 2032 114
12.2.5. Global Corporate Training Market Revenue, By Region, 2018 – 2023 (USD Million) 115
12.2.6. Global Corporate Training Market Revenue, By Region, 2024 – 2032 (USD Million) 115
12.3. Training Delivery Methods 116
12.3.1. Global Corporate Training Market Revenue, By Training Delivery Methods, 2018 – 2023 (USD Million) 116
12.4. Global Corporate Training Market Revenue, By Training Delivery Methods, 2024 – 2032 (USD Million) 117
12.5. Training Topics and Subjects 118
12.5.1. Global Corporate Training Market Revenue, By Training Topics and Subjects, 2018 – 2023 (USD Million) 118
12.5.2. Global Corporate Training Market Revenue, By Training Topics and Subjects, 2024 – 2032 (USD Million) 119
12.6. Company Size 121
12.6.1. Global Corporate Training Market Revenue, By Company Size, 2018 – 2023 (USD Million) 121
12.6.2. Global Corporate Training Market Revenue, By Company Size, 2024 – 2032 (USD Million) 121
12.7. Training Providers 122
12.7.1. Global Corporate Training Market Revenue, By Training Providers, 2018 – 2023 (USD Million) 122
12.7.2. Global Corporate Training Market Revenue, By Training Providers, 2024 – 2032 (USD Million) 122
12.8. Customization and Tailored Training 123
12.8.1. Global Corporate Training Market Revenue, By Customization and Tailored Training, 2018 – 2023 (USD Million) 123
12.8.2. Global Corporate Training Market Revenue, By Customization and Tailored Training, 2024 – 2032 (USD Million) 124
12.9. Industry Vertical 125
12.9.1. Global Corporate Training Market Revenue, By Industry Vertical, 2018 – 2023 (USD Million) 125
12.9.2. Global Corporate Training Market Revenue, By Industry Vertical, 2024 – 2032 (USD Million) 126
CHAPTER NO. 13 : CORPORATE TRAINING MARKET – NORTH AMERICA 127
13.1. North America 127
13.1.1. Key Highlights 127
13.1.2. North America Corporate Training Market Revenue, By Country, 2018 – 2023 (USD Million) 128
13.1.3. North America Corporate Training Market Revenue, By Training Delivery Methods, 2018 – 2023 (USD Million) 129
13.1.4. North America Corporate Training Market Revenue, By Training Topics and Subjects, 2018 – 2023 (USD Million) 131
13.1.5. North America Corporate Training Market Revenue, By Company Size, 2018 – 2023 (USD Million) 133
13.1.6. North America Corporate Training Market Revenue, By Training Providers, 2018 – 2023 (USD Million) 134
13.1.7. North America Corporate Training Market Revenue, By Customization and Tailored Training, 2018 – 2023 (USD Million) 135
13.1.8. North America Corporate Training Market Revenue, By Industry Vertical, 2018 – 2023 (USD Million) 136
13.2. U.S. 138
13.3. Canada 138
13.4. Mexico 138
CHAPTER NO. 14 : CORPORATE TRAINING MARKET – EUROPE 139
14.1. Europe 139
14.1.1. Key Highlights 139
14.1.2. Europe Corporate Training Market Revenue, By Country, 2018 – 2023 (USD Million) 140
14.1.3. Europe Corporate Training Market Revenue, By Training Delivery Methods, 2018 – 2023 (USD Million) 141
14.1.4. Europe Corporate Training Market Revenue, By Training Topics and Subjects, 2018 – 2023 (USD Million) 143
14.1.5. Europe Corporate Training Market Revenue, By Company Size, 2018 – 2023 (USD Million) 145
14.1.6. Europe Corporate Training Market Revenue, By Training Providers, 2018 – 2023 (USD Million) 146
14.1.7. Europe Corporate Training Market Revenue, By Customization and Tailored Training, 2018 – 2023 (USD Million) 147
14.1.8. Europe Corporate Training Market Revenue, By Industry Vertical, 2018 – 2023 (USD Million) 148
14.2. UK 150
14.3. France 150
14.4. Germany 150
14.5. Italy 150
14.6. Spain 150
14.7. Russia 150
14.8. Belgium 150
14.9. Netherland 150
14.10. Austria 150
14.11. Sweden 150
14.12. Poland 150
14.13. Denmark 150
14.14. Switzerland 150
14.15. Rest of Europe 150
CHAPTER NO. 15 : CORPORATE TRAINING MARKET – ASIA PACIFIC 151
15.1. Asia Pacific 151
15.1.1. Key Highlights 151
15.1.2. Asia Pacific Corporate Training Market Revenue, By Country, 2018 – 2023 (USD Million) 152
15.1.3. Asia Pacific Corporate Training Market Revenue, By Training Delivery Methods, 2018 – 2023 (USD Million) 153
15.1.4. Asia Pacific Corporate Training Market Revenue, By Training Topics and Subjects, 2018 – 2023 (USD Million) 155
15.1.5. Asia Pacific Corporate Training Market Revenue, By Company Size, 2018 – 2023 (USD Million) 157
15.1.6. Asia Pacific Corporate Training Market Revenue, By Training Providers, 2018 – 2023 (USD Million) 158
15.1.7. Asia Pacific Corporate Training Market Revenue, By Customization and Tailored Training, 2018 – 2023 (USD Million) 159
15.1.8. Asia Pacific Corporate Training Market Revenue, By Industry Vertical, 2018 – 2023 (USD Million) 160
15.2. China 162
15.3. Japan 162
15.4. South Korea 162
15.5. India 162
15.6. Australia 162
15.7. Thailand 162
15.8. Indonesia 162
15.9. Vietnam 162
15.10. Malaysia 162
15.11. Philippines 162
15.12. Taiwan 162
15.13. Rest of Asia Pacific 162
CHAPTER NO. 16 : CORPORATE TRAINING MARKET – LATIN AMERICA 163
16.1. Latin America 163
16.1.1. Key Highlights 163
16.1.2. Latin America Corporate Training Market Revenue, By Country, 2018 – 2023 (USD Million) 164
16.1.3. Latin America Corporate Training Market Revenue, By Training Delivery Methods, 2018 – 2023 (USD Million) 165
16.1.4. Latin America Corporate Training Market Revenue, By Training Topics and Subjects, 2018 – 2023 (USD Million) 167
16.1.5. Latin America Corporate Training Market Revenue, By Company Size, 2018 – 2023 (USD Million) 169
16.1.6. Latin America Corporate Training Market Revenue, By Training Providers, 2018 – 2023 (USD Million) 170
16.1.7. Latin America Corporate Training Market Revenue, By Customization and Tailored Training, 2018 – 2023 (USD Million) 171
16.1.8. Latin America Corporate Training Market Revenue, By Industry Vertical, 2018 – 2023 (USD Million) 172
16.2. Brazil 174
16.3. Argentina 174
16.4. Peru 174
16.5. Chile 174
16.6. Colombia 174
16.7. Rest of Latin America 174
CHAPTER NO. 17 : CORPORATE TRAINING MARKET – MIDDLE EAST 175
17.1. Middle East 175
17.1.1. Key Highlights 175
17.1.2. Middle East Corporate Training Market Revenue, By Country, 2018 – 2023 (USD Million) 176
17.1.3. Middle East Corporate Training Market Revenue, By Training Delivery Methods, 2018 – 2023 (USD Million) 177
17.1.4. Middle East Corporate Training Market Revenue, By Training Topics and Subjects, 2018 – 2023 (USD Million) 179
17.1.5. Middle East Corporate Training Market Revenue, By Company Size, 2018 – 2023 (USD Million) 181
17.1.6. Middle East Corporate Training Market Revenue, By Training Providers, 2018 – 2023 (USD Million) 182
17.1.7. Middle East Corporate Training Market Revenue, By Customization and Tailored Training, 2018 – 2023 (USD Million) 183
17.1.8. Middle East Corporate Training Market Revenue, By Industry Vertical, 2018 – 2023 (USD Million) 184
17.2. UAE 186
17.3. KSA 186
17.4. Israel 186
17.5. Turkey 186
17.6. Iran 186
17.7. Rest of Middle East 186
CHAPTER NO. 18 : CORPORATE TRAINING MARKET – AFRICA 187
18.1. Africa 187
18.1.1. Key Highlights 187
18.1.2. Africa Corporate Training Market Revenue, By Country, 2018 – 2023 (USD Million) 188
18.1.3. Africa Corporate Training Market Revenue, By Training Delivery Methods, 2018 – 2023 (USD Million) 189
18.1.4. Africa Corporate Training Market Revenue, By Training Topics and Subjects, 2018 – 2023 (USD Million) 191
18.1.5. Africa Corporate Training Market Revenue, By Company Size, 2018 – 2023 (USD Million) 193
18.1.6. Africa Corporate Training Market Revenue, By Training Providers, 2018 – 2023 (USD Million) 194
18.1.7. Africa Corporate Training Market Revenue, By Customization and Tailored Training, 2018 – 2023 (USD Million) 195
18.1.8. Africa Corporate Training Market Revenue, By Industry Vertical, 2018 – 2023 (USD Million) 196
18.2. Egypt 198
18.3. Nigeria 198
18.4. Algeria 198
18.5. Morocco 198
18.6. Rest of Africa 198
CHAPTER NO. 19 : COMPANY PROFILES 199
19.1. Allen Communication Learning Services 199
19.1.1. Company Overview 199
19.1.2. Product Portfolio 199
19.1.3. Swot Analysis 199
19.1.4. Business Strategy 200
19.1.5. Financial Overview 200
19.2. City And Guilds International Limited 201
19.3. Cornerstone Ondemand, Inc. 201
19.4. Wilson Learning Worldwide, Inc. 201
19.5. Simplilearn Solutions 201
19.6. D Two L, Business Training Library, Inc. 201
19.7. Skillsoft 201
19.8. Company 8 201
19.9. Company 9 201
19.10. Company 10 201
19.11. Company 11 201
19.12. Company 12 201
19.13. Company 13 201
19.14. Company 14 201
List of Figures
FIG NO. 1. Global Corporate Training Market Revenue, 2018 – 2032 (USD Million) 34
FIG NO. 2. Porter’s Five Forces Analysis for Global Corporate Training Market 40
FIG NO. 3. Value Chain Analysis for Global Corporate Training Market 41
FIG NO. 4. Company Share Analysis, 2024 43
FIG NO. 5. Company Share Analysis, 2024 44
FIG NO. 6. Company Share Analysis, 2024 44
FIG NO. 7. Company Share Analysis, 2024 45
FIG NO. 8. Corporate Training Market – Company Volume Market Share, 2024 46
FIG NO. 9. Corporate Training Market – Company Revenue Market Share, 2024 47
FIG NO. 10. Corporate Training Market Revenue Share, By Training Delivery Methods, 2023 & 2032 53
FIG NO. 11. Market Attractiveness Analysis, By Training Delivery Methods 54
FIG NO. 12. Incremental Revenue Growth Opportunity by Training Delivery Methods, 2024 – 2032 54
FIG NO. 13. Corporate Training Market Revenue, By Training Delivery Methods, 2018, 2023, 2027 & 2032 55
FIG NO. 14. Global Corporate Training Market for In-Person Training, Revenue (USD Million) 2018 – 2032 56
FIG NO. 15. Global Corporate Training Market for Online or E-Learning, Revenue (USD Million) 2018 – 2032 57
FIG NO. 16. Global Corporate Training Market for Blended Learning, Revenue (USD Million) 2018 – 2032 58
FIG NO. 17. Global Corporate Training Market for Virtual Instructor-Led Training (VILT), Revenue (USD Million) 2018 – 2032 59
FIG NO. 18. Global Corporate Training Market for On-Demand and Self-Paced Learning, Revenue (USD Million) 2018 – 2032 60
FIG NO. 19. Global Corporate Training Market for Mobile Learning, Revenue (USD Million) 2018 – 2032 61
FIG NO. 20. Global Corporate Training Market for Simulations and Gamification, Revenue (USD Million) 2018 – 2032 62
FIG NO. 21. Global Corporate Training Market for Video-Based Training, Revenue (USD Million) 2018 – 2032 63
FIG NO. 22. Corporate Training Market Revenue Share, By Training Topics and Subjects, 2023 & 2032 65
FIG NO. 23. Market Attractiveness Analysis, By Training Topics and Subjects 66
FIG NO. 24. Incremental Revenue Growth Opportunity by Training Topics and Subjects, 2024 – 2032 66
FIG NO. 25. Corporate Training Market Revenue, By Training Topics and Subjects, 2018, 2023, 2027 & 2032 67
FIG NO. 26. Global Corporate Training Market for Leadership and Management Training, Revenue (USD Million) 2018 – 2032 68
FIG NO. 27. Global Corporate Training Market for Technical and IT Training, Revenue (USD Million) 2018 – 2032 69
FIG NO. 28. Global Corporate Training Market for Soft Skills and Communication Training, Revenue (USD Million) 2018 – 2032 70
FIG NO. 29. Global Corporate Training Market for Compliance and Regulatory Training, Revenue (USD Million) 2018 – 2032 71
FIG NO. 30. Global Corporate Training Market for Sales and Marketing Training, Revenue (USD Million) 2018 – 2032 72
FIG NO. 31. Global Corporate Training Market for Customer Service and Support Training, Revenue (USD Million) 2018 – 2032 73
FIG NO. 32. Global Corporate Training Market for Diversity and Inclusion Training, Revenue (USD Million) 2018 – 2032 74
FIG NO. 33. Global Corporate Training Market for Cybersecurity Training, Revenue (USD Million) 2018 – 2032 75
FIG NO. 34. Global Corporate Training Market for Health and Safety Training, Revenue (USD Million) 2018 – 2032 76
FIG NO. 35. Global Corporate Training Market for Project Management Training, Revenue (USD Million) 2018 – 2032 77
FIG NO. 36. Global Corporate Training Market for Language and Cultural Training, Revenue (USD Million) 2018 – 2032 78
FIG NO. 37. Corporate Training Market Revenue Share, By Company Size, 2023 & 2032 80
FIG NO. 38. Market Attractiveness Analysis, By Company Size 81
FIG NO. 39. Incremental Revenue Growth Opportunity by Company Size, 2024 – 2032 81
FIG NO. 40. Corporate Training Market Revenue, By Company Size, 2018, 2023, 2027 & 2032 82
FIG NO. 41. Global Corporate Training Market for Small and Medium-sized Enterprises (SMEs), Revenue (USD Million) 2018 – 2032 83
FIG NO. 42. Global Corporate Training Market for Large Enterprises, Revenue (USD Million) 2018 – 2032 84
FIG NO. 43. Corporate Training Market Revenue Share, By Training Providers, 2023 & 2032 86
FIG NO. 44. Market Attractiveness Analysis, By Training Providers 87
FIG NO. 45. Incremental Revenue Growth Opportunity by Training Providers, 2024 – 2032 87
FIG NO. 46. Corporate Training Market Revenue, By Training Providers, 2018, 2023, 2027 & 2032 88
FIG NO. 47. Global Corporate Training Market for Internal Training Departments, Revenue (USD Million) 2018 – 2032 89
FIG NO. 48. Global Corporate Training Market for External Training Providers, Revenue (USD Million) 2018 – 2032 90
FIG NO. 49. Global Corporate Training Market for Universities and Educational Institutions, Revenue (USD Million) 2018 – 2032 91
FIG NO. 50. Global Corporate Training Market for Online Learning Platforms, Revenue (USD Million) 2018 – 2032 92
FIG NO. 51. Corporate Training Market Revenue Share, By Customization and Tailored Training, 2023 & 2032 94
FIG NO. 52. Market Attractiveness Analysis, By Customization and Tailored Training 95
FIG NO. 53. Incremental Revenue Growth Opportunity by Customization and Tailored Training, 2024 – 2032 95
FIG NO. 54. Corporate Training Market Revenue, By Customization and Tailored Training, 2018, 2023, 2027 & 2032 96
FIG NO. 55. Global Corporate Training Market for Off-the-Shelf Training Programs, Revenue (USD Million) 2018 – 2032 97
FIG NO. 56. Global Corporate Training Market for Customized and Tailored Training, Revenue (USD Million) 2018 – 2032 98
FIG NO. 57. Corporate Training Market Revenue Share, By Industry Vertical, 2023 & 2032 100
FIG NO. 58. Market Attractiveness Analysis, By Industry Vertical 101
FIG NO. 59. Incremental Revenue Growth Opportunity by Industry Vertical, 2024 – 2032 101
FIG NO. 60. Corporate Training Market Revenue, By Industry Vertical, 2018, 2023, 2027 & 2032 102
FIG NO. 61. Global Corporate Training Market for IT and Technology, Revenue (USD Million) 2018 – 2032 103
FIG NO. 62. Global Corporate Training Market for Healthcare, Revenue (USD Million) 2018 – 2032 104
FIG NO. 63. Global Corporate Training Market for Finance and Banking, Revenue (USD Million) 2018 – 2032 105
FIG NO. 64. Global Corporate Training Market for Manufacturing, Revenue (USD Million) 2018 – 2032 106
FIG NO. 65. Global Corporate Training Market for Retail, Revenue (USD Million) 2018 – 2032 107
FIG NO. 66. Global Corporate Training Market for Hospitality and Tourism, Revenue (USD Million) 2018 – 2032 108
FIG NO. 67. Global Corporate Training Market for Education, Revenue (USD Million) 2018 – 2032 109
FIG NO. 68. Global Corporate Training Market for Government and Public Sector, Revenue (USD Million) 2018 – 2032 110
FIG NO. 69. Global Corporate Training Market Revenue Share, By Region, 2023 & 2032 112
FIG NO. 70. Market Attractiveness Analysis, By Region 113
FIG NO. 71. Incremental Revenue Growth Opportunity by Region, 2024 – 2032 113
FIG NO. 72. Corporate Training Market Revenue, By Region, 2018, 2023, 2027 & 2032 114
FIG NO. 73. North America Corporate Training Market Revenue, 2018 – 2032 (USD Million) 127
FIG NO. 74. Europe Corporate Training Market Revenue, 2018 – 2032 (USD Million) 139
FIG NO. 75. Asia Pacific Corporate Training Market Revenue, 2018 – 2032 (USD Million) 151
FIG NO. 76. Latin America Corporate Training Market Revenue, 2018 – 2032 (USD Million) 163
FIG NO. 77. Middle East Corporate Training Market Revenue, 2018 – 2032 (USD Million) 175
FIG NO. 78. Africa Corporate Training Market Revenue, 2018 – 2032 (USD Million) 187
List of Tables
TABLE NO. 1. : Global Corporate Training Market: Snapshot 32
TABLE NO. 2. : Drivers for the Corporate Training Market: Impact Analysis 36
TABLE NO. 3. : Restraints for the Corporate Training Market: Impact Analysis 38
TABLE NO. 4. : Global Corporate Training Market Revenue, By Region, 2018 – 2023 (USD Million) 115
TABLE NO. 5. : Global Corporate Training Market Revenue, By Region, 2024 – 2032 (USD Million) 115
TABLE NO. 6. : Global Corporate Training Market Revenue, By Training Delivery Methods, 2018 – 2023 (USD Million) 116
TABLE NO. 7. : Global Corporate Training Market Revenue, By Training Delivery Methods, 2024 – 2032 (USD Million) 117
TABLE NO. 8. : Global Corporate Training Market Revenue, By Training Topics and Subjects, 2018 – 2023 (USD Million) 118
TABLE NO. 9. : Global Corporate Training Market Revenue, By Training Topics and Subjects, 2024 – 2032 (USD Million) 119
TABLE NO. 10. : Global Corporate Training Market Revenue, By Company Size, 2018 – 2023 (USD Million) 121
TABLE NO. 11. : Global Corporate Training Market Revenue, By Company Size, 2024 – 2032 (USD Million) 121
TABLE NO. 12. : Global Corporate Training Market Revenue, By Training Providers, 2018 – 2023 (USD Million) 122
TABLE NO. 13. : Global Corporate Training Market Revenue, By Training Providers, 2024 – 2032 (USD Million) 122
TABLE NO. 14. : Global Corporate Training Market Revenue, By Customization and Tailored Training, 2018 – 2023 (USD Million) 123
TABLE NO. 15. : Global Corporate Training Market Revenue, By Customization and Tailored Training, 2024 – 2032 (USD Million) 124
TABLE NO. 16. : Global Corporate Training Market Revenue, By Industry Vertical, 2018 – 2023 (USD Million) 125
TABLE NO. 17. : Global Corporate Training Market Revenue, By Industry Vertical, 2024 – 2032 (USD Million) 126
TABLE NO. 18. : North America Corporate Training Market Revenue, By Country, 2018 – 2023 (USD Million) 128
TABLE NO. 19. : North America Corporate Training Market Revenue, By Country, 2024 – 2032 (USD Million) 128
TABLE NO. 20. : North America Corporate Training Market Revenue, By Training Delivery Methods, 2018 – 2023 (USD Million) 129
TABLE NO. 21. : North America Corporate Training Market Revenue, By Training Delivery Methods, 2024 – 2032 (USD Million) 130
TABLE NO. 22. : North America Corporate Training Market Revenue, By Training Topics and Subjects, 2018 – 2023 (USD Million) 131
TABLE NO. 23. : North America Corporate Training Market Revenue, By Training Topics and Subjects, 2024 – 2032 (USD Million) 132
TABLE NO. 24. : North America Corporate Training Market Revenue, By Company Size, 2018 – 2023 (USD Million) 133
TABLE NO. 25. : North America Corporate Training Market Revenue, By Company Size, 2024 – 2032 (USD Million) 133
TABLE NO. 26. : North America Corporate Training Market Revenue, By Training Providers, 2018 – 2023 (USD Million) 134
TABLE NO. 27. : North America Corporate Training Market Revenue, By Training Providers, 2024 – 2032 (USD Million) 134
TABLE NO. 28. : North America Corporate Training Market Revenue, By Customization and Tailored Training, 2018 – 2023 (USD Million) 135
TABLE NO. 29. : North America Corporate Training Market Revenue, By Customization and Tailored Training, 2024 – 2032 (USD Million) 135
TABLE NO. 30. : North America Corporate Training Market Revenue, By Industry Vertical, 2018 – 2023 (USD Million) 136
TABLE NO. 31. : North America Corporate Training Market Revenue, By Industry Vertical, 2024 – 2032 (USD Million) 137
TABLE NO. 32. : Europe Corporate Training Market Revenue, By Country, 2018 – 2023 (USD Million) 140
TABLE NO. 33. : Europe Corporate Training Market Revenue, By Country, 2024 – 2032 (USD Million) 140
TABLE NO. 34. : Europe Corporate Training Market Revenue, By Training Delivery Methods, 2018 – 2023 (USD Million) 141
TABLE NO. 35. : Europe Corporate Training Market Revenue, By Training Delivery Methods, 2024 – 2032 (USD Million) 142
TABLE NO. 36. : Europe Corporate Training Market Revenue, By Training Topics and Subjects, 2018 – 2023 (USD Million) 143
TABLE NO. 37. : Europe Corporate Training Market Revenue, By Training Topics and Subjects, 2024 – 2032 (USD Million) 144
TABLE NO. 38. : Europe Corporate Training Market Revenue, By Company Size, 2018 – 2023 (USD Million) 145
TABLE NO. 39. : Europe Corporate Training Market Revenue, By Company Size, 2024 – 2032 (USD Million) 145
TABLE NO. 40. : Europe Corporate Training Market Revenue, By Training Providers, 2018 – 2023 (USD Million) 146
TABLE NO. 41. : Europe Corporate Training Market Revenue, By Training Providers, 2024 – 2032 (USD Million) 146
TABLE NO. 42. : Europe Corporate Training Market Revenue, By Customization and Tailored Training, 2018 – 2023 (USD Million) 147
TABLE NO. 43. : Europe Corporate Training Market Revenue, By Customization and Tailored Training, 2024 – 2032 (USD Million) 147
TABLE NO. 44. : Europe Corporate Training Market Revenue, By Industry Vertical, 2018 – 2023 (USD Million) 148
TABLE NO. 45. : Europe Corporate Training Market Revenue, By Industry Vertical, 2024 – 2032 (USD Million) 149
TABLE NO. 46. : Asia Pacific Corporate Training Market Revenue, By Country, 2018 – 2023 (USD Million) 152
TABLE NO. 47. : Asia Pacific Corporate Training Market Revenue, By Country, 2024 – 2032 (USD Million) 152
TABLE NO. 48. : Asia Pacific Corporate Training Market Revenue, By Training Delivery Methods, 2018 – 2023 (USD Million) 153
TABLE NO. 49. : Asia Pacific Corporate Training Market Revenue, By Training Delivery Methods, 2024 – 2032 (USD Million) 154
TABLE NO. 50. : Asia Pacific Corporate Training Market Revenue, By Training Topics and Subjects, 2018 – 2023 (USD Million) 155
TABLE NO. 51. : Asia Pacific Corporate Training Market Revenue, By Training Topics and Subjects, 2024 – 2032 (USD Million) 156
TABLE NO. 52. : Asia Pacific Corporate Training Market Revenue, By Company Size, 2018 – 2023 (USD Million) 157
TABLE NO. 53. : Asia Pacific Corporate Training Market Revenue, By Company Size, 2024 – 2032 (USD Million) 157
TABLE NO. 54. : Asia Pacific Corporate Training Market Revenue, By Training Providers, 2018 – 2023 (USD Million) 158
TABLE NO. 55. : Asia Pacific Corporate Training Market Revenue, By Training Providers, 2024 – 2032 (USD Million) 158
TABLE NO. 56. : Asia Pacific Corporate Training Market Revenue, By Customization and Tailored Training, 2018 – 2023 (USD Million) 159
TABLE NO. 57. : Asia Pacific Corporate Training Market Revenue, By Customization and Tailored Training, 2024 – 2032 (USD Million) 159
TABLE NO. 58. : Asia Pacific Corporate Training Market Revenue, By Industry Vertical, 2018 – 2023 (USD Million) 160
TABLE NO. 59. : Asia Pacific Corporate Training Market Revenue, By Industry Vertical, 2024 – 2032 (USD Million) 161
TABLE NO. 60. : Latin America Corporate Training Market Revenue, By Country, 2018 – 2023 (USD Million) 164
TABLE NO. 61. : Latin America Corporate Training Market Revenue, By Country, 2024 – 2032 (USD Million) 164
TABLE NO. 62. : Latin America Corporate Training Market Revenue, By Training Delivery Methods, 2018 – 2023 (USD Million) 165
TABLE NO. 63. : Latin America Corporate Training Market Revenue, By Training Delivery Methods, 2024 – 2032 (USD Million) 166
TABLE NO. 64. : Latin America Corporate Training Market Revenue, By Training Topics and Subjects, 2018 – 2023 (USD Million) 167
TABLE NO. 65. : Latin America Corporate Training Market Revenue, By Training Topics and Subjects, 2024 – 2032 (USD Million) 168
TABLE NO. 66. : Latin America Corporate Training Market Revenue, By Company Size, 2018 – 2023 (USD Million) 169
TABLE NO. 67. : Latin America Corporate Training Market Revenue, By Company Size, 2024 – 2032 (USD Million) 169
TABLE NO. 68. : Latin America Corporate Training Market Revenue, By Training Providers, 2018 – 2023 (USD Million) 170
TABLE NO. 69. : Latin America Corporate Training Market Revenue, By Training Providers, 2024 – 2032 (USD Million) 170
TABLE NO. 70. : Latin America Corporate Training Market Revenue, By Customization and Tailored Training, 2018 – 2023 (USD Million) 171
TABLE NO. 71. : Latin America Corporate Training Market Revenue, By Customization and Tailored Training, 2024 – 2032 (USD Million) 171
TABLE NO. 72. : Latin America Corporate Training Market Revenue, By Industry Vertical, 2018 – 2023 (USD Million) 172
TABLE NO. 73. : Latin America Corporate Training Market Revenue, By Industry Vertical, 2024 – 2032 (USD Million) 173
TABLE NO. 74. : Middle East Corporate Training Market Revenue, By Country, 2018 – 2023 (USD Million) 176
TABLE NO. 75. : Middle East Corporate Training Market Revenue, By Country, 2024 – 2032 (USD Million) 176
TABLE NO. 76. : Middle East Corporate Training Market Revenue, By Training Delivery Methods, 2018 – 2023 (USD Million) 177
TABLE NO. 77. : Middle East Corporate Training Market Revenue, By Training Delivery Methods, 2024 – 2032 (USD Million) 178
TABLE NO. 78. : Middle East Corporate Training Market Revenue, By Training Topics and Subjects, 2018 – 2023 (USD Million) 179
TABLE NO. 79. : Middle East Corporate Training Market Revenue, By Training Topics and Subjects, 2024 – 2032 (USD Million) 180
TABLE NO. 80. : Middle East Corporate Training Market Revenue, By Company Size, 2018 – 2023 (USD Million) 181
TABLE NO. 81. : Middle East Corporate Training Market Revenue, By Company Size, 2024 – 2032 (USD Million) 181
TABLE NO. 82. : Middle East Corporate Training Market Revenue, By Training Providers, 2018 – 2023 (USD Million) 182
TABLE NO. 83. : Middle East Corporate Training Market Revenue, By Training Providers, 2024 – 2032 (USD Million) 182
TABLE NO. 84. : Middle East Corporate Training Market Revenue, By Customization and Tailored Training, 2018 – 2023 (USD Million) 183
TABLE NO. 85. : Middle East Corporate Training Market Revenue, By Customization and Tailored Training, 2024 – 2032 (USD Million) 183
TABLE NO. 86. : Middle East Corporate Training Market Revenue, By Industry Vertical, 2018 – 2023 (USD Million) 184
TABLE NO. 87. : Middle East Corporate Training Market Revenue, By Industry Vertical, 2024 – 2032 (USD Million) 185
TABLE NO. 88. : Africa Corporate Training Market Revenue, By Country, 2018 – 2023 (USD Million) 188
TABLE NO. 89. : Africa Corporate Training Market Revenue, By Country, 2024 – 2032 (USD Million) 188
TABLE NO. 90. : Africa Corporate Training Market Revenue, By Training Delivery Methods, 2018 – 2023 (USD Million) 189
TABLE NO. 91. : Africa Corporate Training Market Revenue, By Training Delivery Methods, 2024 – 2032 (USD Million) 190
TABLE NO. 92. : Africa Corporate Training Market Revenue, By Training Topics and Subjects, 2018 – 2023 (USD Million) 191
TABLE NO. 93. : Africa Corporate Training Market Revenue, By Training Topics and Subjects, 2024 – 2032 (USD Million) 192
TABLE NO. 94. : Africa Corporate Training Market Revenue, By Company Size, 2018 – 2023 (USD Million) 193
TABLE NO. 95. : Africa Corporate Training Market Revenue, By Company Size, 2024 – 2032 (USD Million) 193
TABLE NO. 96. : Africa Corporate Training Market Revenue, By Training Providers, 2018 – 2023 (USD Million) 194
TABLE NO. 97. : Africa Corporate Training Market Revenue, By Training Providers, 2024 – 2032 (USD Million) 194
TABLE NO. 98. : Africa Corporate Training Market Revenue, By Customization and Tailored Training, 2018 – 2023 (USD Million) 195
TABLE NO. 99. : Africa Corporate Training Market Revenue, By Customization and Tailored Training, 2024 – 2032 (USD Million) 195
TABLE NO. 100. : Africa Corporate Training Market Revenue, By Industry Vertical, 2018 – 2023 (USD Million) 196
TABLE NO. 101. : Africa Corporate Training Market Revenue, By Industry Vertical, 2024 – 2032 (USD Million) 197
 Market Drivers:
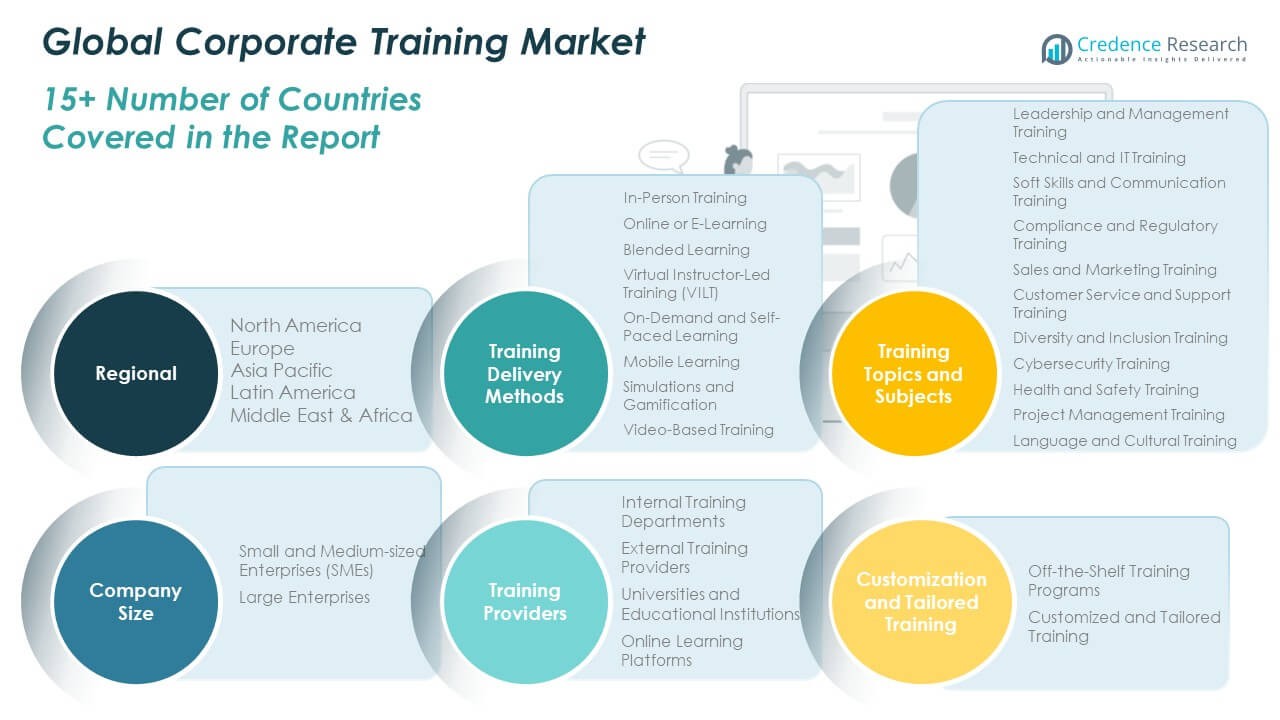 Market Trends:
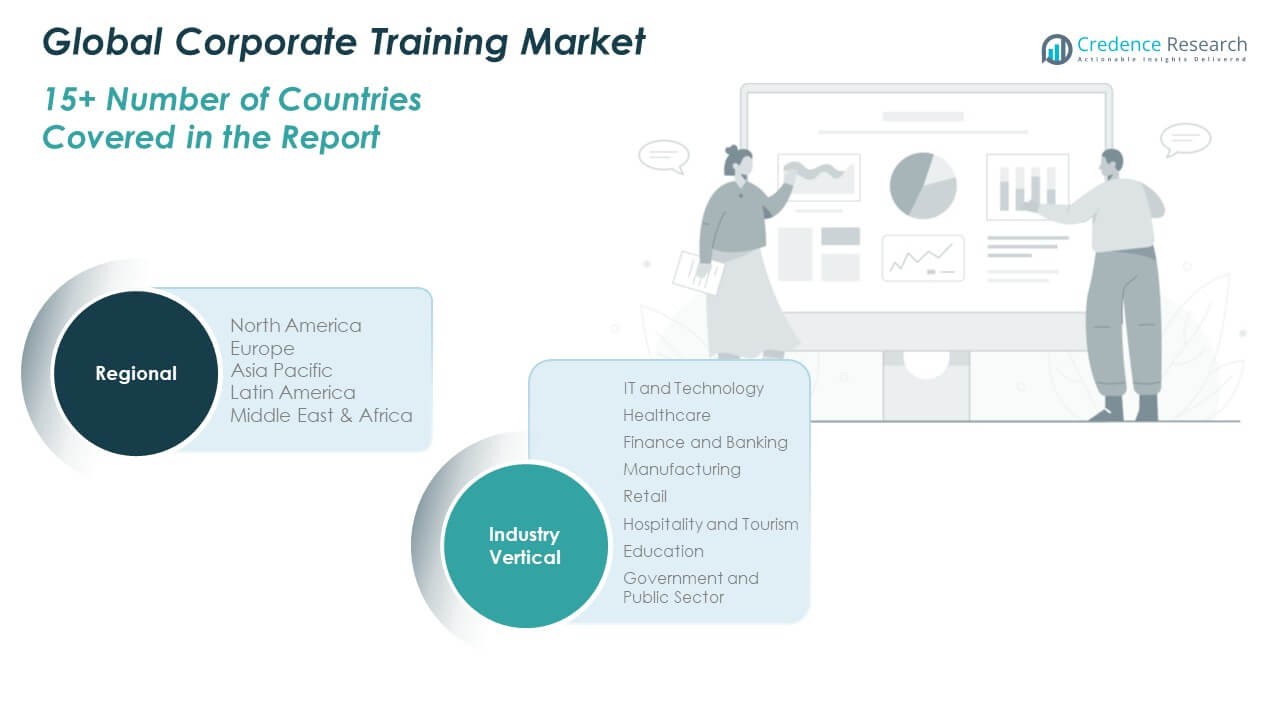 Market Challenges Analysis:
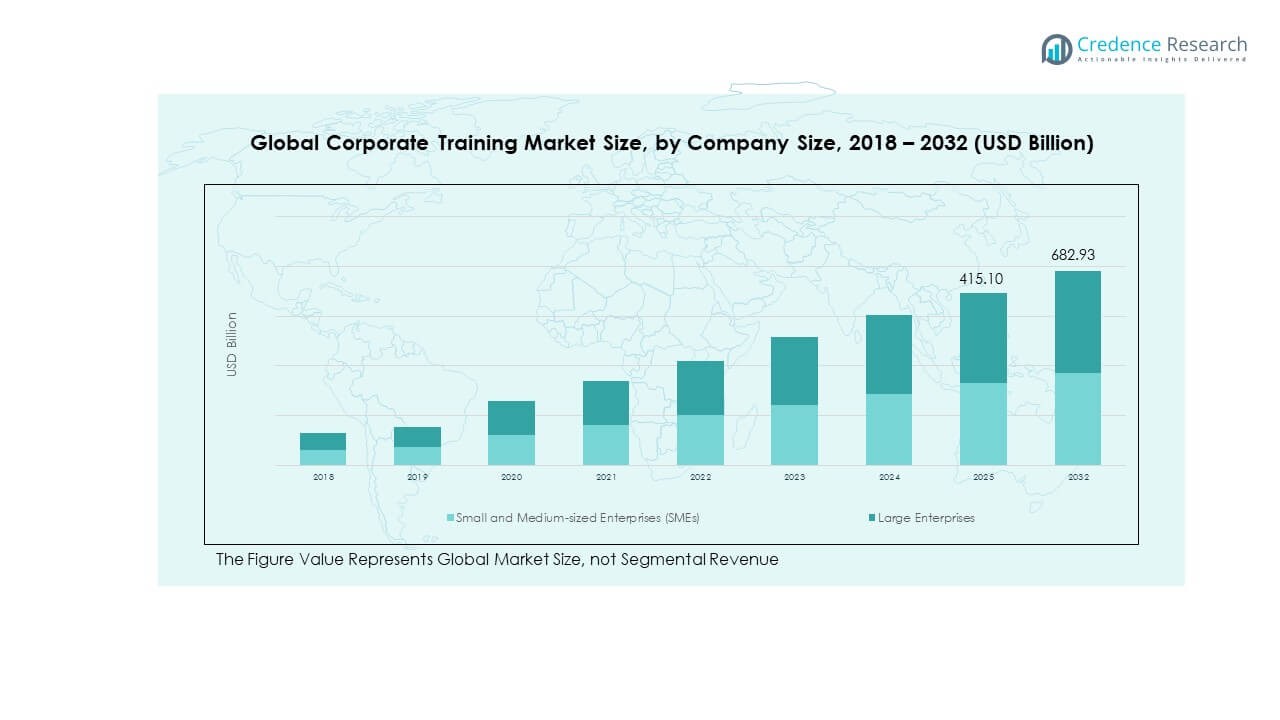 Market Segmentation Analysis:

