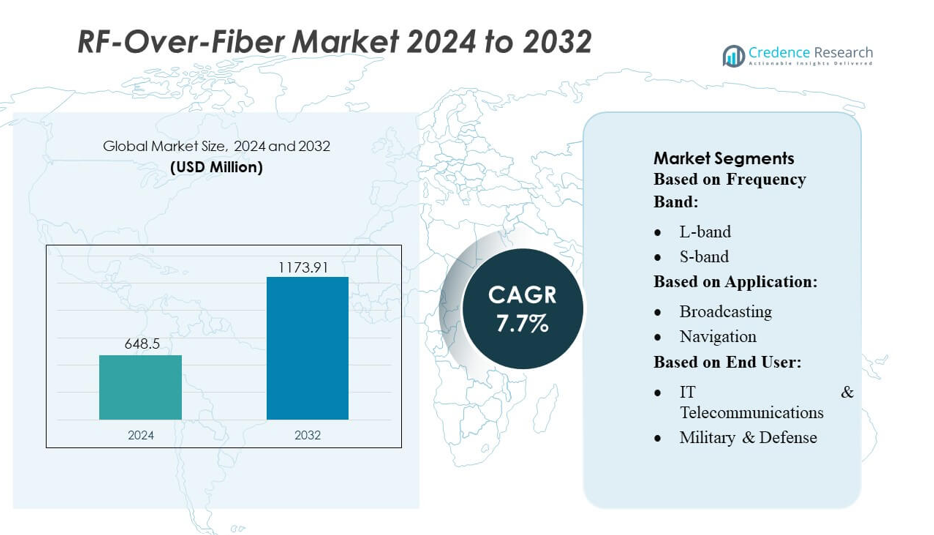
RF-Over-Fiber Market By Modules (Transceivers, Optical Amplifiers, Antennas, Optical Switches, Optical Cables, Others) By Vertical (Civil, Military) By Organization Size (Large Scale Organization, Medium Scale Organization, Small Scale Organization) By Application (Telecommunications, Broadcast, Navigation, Radar, Broadband)-Growth, Future Prospects & Competitive Analysis, 2016 – 2030

Price: $4999

Published: | Report ID: 18101 | Report Format : PDF

Key Highlights of the Report

The global RF-over-fiber market is segmented by modules, frequency band, vertical, frequency range, organization size, application, and region. Transceivers is the most popular category based on modules segment. The L band is the most commonly used frequency band, whereas the civil category in RF over fiber market based on vertical is expected to grow at the highest rate. In addition, less than 30 GHz frequency range dominates the market, while, the large scale organization and telecommunication category held the largest position throughout the forecast period, with Asia Pacific leading the market growth.

The primary force driving market development is the expanding telecoms sector. Telecommunication is the market’s largest end-use sector since RF over fibre is the main way of transmitting data between locations. The sector is expanding significantly as a result of the growing usage of mobile devices and the accompanying bandwidth connectivity. The telecommunications sector is propelled by rising demand for broadband services and big data management. The number of linked devices is steadily increasing with the increase in device connectivity and usage. In the world’s developing economies, the telecommunications business is expanding quickly. However, increased cost of RF over fiber devices for installation. The main market restraint is the initial installation cost of RF versus fiber products and services.

Nonetheless, the global RF-over-fiber market offers significant growth opportunities, including incorporating the expanding 5G and 6G infrastructure globally and the growing demand for RFOF in defense applications.

Market Overview

The global RF-over-fiber market has witnessed steady growth in recent years and is expected to continue growing at a CAGR of 10.50% between 2023 and 2030. The market was valued at USD 0.55 billion in 2022 and is expected to reach USD 1.11 billion in 2030.

Design Element 2

Access crucial information at unmatched prices!

Request your free sample report today & start making informed decisions powered by Credence Research!

Download Free Sample
CTA Design Element 3

What Are the Main Drivers of The Global RF-over-fiber Market?

A number of variables influence the worldwide RF-over-fiber market, but the expanding telecommunications sector is the key force behind market growth. Telecommunication is the market’s largest end-use sector since RF over fibre is the main way of transmitting data between locations. The sector is expanding significantly as a result of the growing usage of mobile devices and the accompanying bandwidth connectivity. The telecommunications sector is propelled by rising demand for broadband services and big data management. The number of linked devices is steadily increasing with the increase in device connectivity and usage. In the world’s developing economies, the telecommunications business is expanding quickly.

What Are the Major Challenges Faced by The Global RF-over-fiber Market?

The global RF-over-fiber market also faces several challenges, including the expensive initial investment needed to create the infrastructure, which can impact consumer spending and may hamper the market.

What Are the Growth Opportunities in The Global RF-over-fiber Market?

The global RF-over-fiber market offers significant growth opportunities, including incorporating the expanding 5G and 6G infrastructure globally and the growing demand for RFOF in defense applications.

Executive Summary

Overview of the Global RF-over-fiber Market

Consumer demand for high-definition content is fueling the market’s expansion. RF over fiber industry is the high bandwidth provided by fiber-optic networks. The expensive initial outlay needed to create the infrastructure could hamper the market’s expansion.

Market Definition

Light is amplified, modulated, and transmitted with a radio signal over an optical fiber link to enable wireless access. This technique is known as radio over fiber (RF over fiber). RoF is most frequently linked with wireless access, even though it is used for various applications, such as cable television (CATV) networks and satellite base stations. In RoF systems, wireless signals are initially sent between a central station and a group of base stations in optical form before being broadcast. For the base station to communicate with a mobile station, the mobile station must be within radio range of at least one user.

Market Insights

  • The global demand for RF-over-fibers was valued at USD 0.55 Billion in 2022 and is expected to reach USD 1.11 Billion in 2030, growing at a CAGR of 10.50% between 2023 and 2030.
  • Transceivers are the leading segment by module and held over 43% share in terms of value in 2022 during the forecast period.
  • With a significant share of over 80% in 2020 and the potential for high CAGR growth, the L band sector now controls the market for RF-over-fibers on a worldwide scale.The civil segment is expected to post the highest CAGR during the forecast period.
  • Less than 30 GHz is the leading segment by frequency range and held over 43% share in terms of value in 2022 during the forecast period.
  • Large scale organization is the leading segment by organization size and held over 43% share in value in 2022 during the forecast period.
  • Telecommunications is the leading segment by applications and held over 43% share in terms of value in 2022 during the forecast period.
  • Asia Pacific is fueling the growth of the RF-over-fiber industry with an over one-third share in 2022, while North America and Europe collectively accounted for just under 50% share in 2022. Europe held over 22% share in 2022.
  • The government’s initiatives to promote international trade post-Cavidian are contributing to expanding the Asia-Pacific RF over the fiber market. Additionally, the advantages of RF over fiber for maximizing costs and routes increase the demand for RF over fiber.
  • However, the market expansion is constrained by trade route congestion and trade restrictions between some countries. The pandemic-related closure of manufacturing plants has greatly affected the market.

Segmentation by Material

  • Transceivers are the leading module segment and held over 43% share in value in 2022.
  • The optical amplifiers segment will likely exhibit the fastest CAGR during the forecast period.

Segmentation by Frequency Band

  • L band is the leading segment by frequency band and held over 43% share in terms of value in 2022.
  • The L band amplifiers segment will likely exhibit the fastest CAGR during the forecast period.

Segmentation by Vertical

  • Civil is the leading segment by vertical and held over 43% share in terms of value in 2022.
  • The military segment will likely exhibit the fastest CAGR during the forecast period.

Segmentation by Frequency Range

  • Less than 30 GHz is the leading segment by frequency range and held over 43% share in value in 2022, and 40 GHz to 50 GHz is expected to hold the highest CAGR during the forecast period.

Segmentation by Organization Size

  • Large scale organization is the leading segment by organization size and held over 43% share in value in 2022.
  • The medium-scale organization is expected to hold the highest CAGR during the forecast period.

Segmentation by Application

  • The telecommunications segment governs the demand for RF-over-fibers globally, holding a massive share of over 80% in 2022, and broadband is also expected to grow at a rapid CAGR.

Segmentation by Region

  • With more than a third of market share in 2022, Asia Pacific is promoting the expansion of the RF-over-fiber sector.
  • Europe will control over 22% of the market in 2022, with North America and Europe accounting for just under 50% of the total.
  • The remaining portion of the world’s RF-over-fibers demand comes from Latin America, the Middle East, and Africa.

The United States is one of North America’s largest RF-over-fibers markets, with a significant share of the market. The biggest market for RF-over-Fiber solutions is in North America. This technology was first designed to handle the signals carried to and from satellites, but with just minor modifications, it later found use in various sectors. To date, the entertainment and navigation industries use RF-over-Fiber Solutions. Every day, many new applications appear on the market that, due to their special characteristics, call for RF-over-Fiber solutions.

China is also a major market for RF over-fibers in the Asia Pacific region, with a significant market share. Due to its large production capacity and the outsourced manufacturing capabilities of big corporations that result in exports from the region, China is predicted to dominate the Asia-Pacific region.

 The expanding telecommunications industry is the primary engine fueling market development. Telecommunications is the market’s largest end-use industry since RF over fibre is the major means of transmitting data from one site to another. The sector is rapidly growing as a result of the increased usage of mobile devices and the accompanying bandwidth connectivity. The telecoms industry is being spurred forward by increased demand for broadband services and big data management. The number of linked devices is steadily increasing with the increase in device connectivity and usage. In the world’s developing economies, the telecommunications business is expanding quickly.

However, increased cost of RF over fiber devices for installation. The main market restraint is the initial installation cost of RF versus fiber products and services.

RF-over-fiber Market

Escalating Need for Fibre Optic Cable to Support Greater Bandwidth

Fibre optic bandwidth is substantial, allowing for long-distance data transmission without attenuation. Through many materials, including glass wire, the optical fiber may transport data as pulses of light, enabling data to move at the speed of light. A beam of light can transfer information from transmitter to receiver through optical communication. Optical frequency is typically between 1000 GHz and an infrared ray. The network receives data of the highest quality and with minimal signal interference, thanks to fiber optics.

Fibre Optic Cable Performs More Effectively than Copper Cable

In terms of speed and frequency, copper cable bandwidth is constrained. Optical fiber uses a significantly larger range of frequencies for data transmission. Unlike copper cable, which transmits data slowly using electrical signals, optical fiber transports data by light-based impulses, allowing it to move more data between locations in minutes.

RFoF’s low power consumption benefit

A system’s energy efficiency can also be determined by the energy consumed per bit of data transmitted. The power consumption of an access network infrastructure is produced utilizing network segmentation, and it may be calculated as the power consumption per user vs. the average access rate (Watts/Mbps). The energy consumption of each system component is calculated for a range of access rates using manufacturer data on equipment energy consumption for a variety of common types of hardware. With the number of users and the average access rate per user growing quickly, this perspective offers a better framework for estimating the rise in power usage.

High Upfront Costs for Investments

RF over fiber networks and have many advantages, including high bandwidth, fast speed, and low weight. However, all of them come at a hefty investment cost. It costs a lot to build a fiber optic network. Since cost is a significant consideration when selecting the type of network, copper cables are still chosen. Because of this, the RF over fiber market may not expand as quickly as anticipated. The cost of all the components, including transceivers, raises overall costs, which forces the corporation to make large investments. Due to its affordability, the telecom sectors favor using copper cable infrastructure for end customers.

Greater Use of Mobile Devices

The consumer electronics market is driven by rising disposable income and the need for improved electronic items. Consumers are embracing new technology at work, in daily life, for personal enjoyment, and in other areas as they become more technologically adept. Due to better control, functionality, and other capabilities, smart devices are gaining a significant market share.

Simple RFoF installation and upkeep

Most RoF approaches do not require local oscillators or ancillary equipment at the Remote Antenna Units (RAU). RAUs are made easier because the complicated and expensive equipment is maintained at the head end of RoF networks. Due to their high cost and power consumption, high-frequency electro-optical modulators and electronics must be avoided at the CS (central station). Additionally, elaborate downlink transmission system implementations should be avoided due to high production and maintenance costs. The modulation and switching hardware that numerous RAUs share is housed at the head end. This arrangement makes RAUs lighter and smaller, lowering the system installation and upkeep costs.

Competitive Landscape

Key Players

The global RF-over-fiber market is highly competitive, with the presence of several key players. Some of the major players in the market and their market share are as follows:

  • Broadcom
  • EMCORE Corporation
  • APIC Corporation
  • Optical Zonu Corp
  • Gooch & Housego PLC
  • ViaLite
  • Global Invacom
  • HUBER+SUHNER
  • Glenair
  • SEIKOH GIKEN CO.
  • LTD.
  • II-VI Incorporated
  • DEV Systemtechnik GmbH
  • Octane Wireless
  • Syntonics LLC
  • Intelibs, Inc.
  • ETL Systems Ltd
  • Narda-MITEQ
  • Olabs Technology Company Limited
  • RFOptic Ltd.
  • Elkay
  • MicroComp Nordic AB
  • Microwave Photonic Systems, Inc.
  • others

These companies focus on product innovation, expanding their distribution channels, and mergers and acquisitions to stay ahead in the market. The major players in the global RF-over-fiber market constantly strive to stay ahead by introducing new products and innovations.

In December 2017, ZONUConnect Base Station-to-DAS Fibre Transport System for simple web-based setup and SNMP remote monitoring and control was released, according to Optical Zonu (US).

In November 2017, the advent of the Integrated Tunable Transmitter and Receiver Assembly (ITTRA) by Finisar was intended to make it simple for clients to integrate it into coherent line cards or DCO (Digital Coherent Optics) transceivers, allowing them to shorten their time to market and cut costs associated with program and development.

Shape Your Report to Specific Countries or Regions & Enjoy 30% Off!

Summary of Key Findings

  • The telecommunications sector is propelled by rising demand for broadband services and big data management. The number of linked devices is steadily increasing with the increase in device connectivity and usage. In the world’s developing economies, the telecommunications business is expanding quickly, driving market growth
  • The market is segmented by modules, frequency band, vertical, frequency range, organization size, application, and region.
  • Transceivers RF-over-fibers are the most popular segment.
  • L band is the most commonly used frequency band.
  • Whereas the RF over fiber market for the civil vertical is expected to grow at the highest rate
  • In addition, less Than 30 GHz frequency range dominates the market
  • The large-scale organizations held the largest position throughout the forecast period
  • Asia Pacific is leading market growth; the market is highly competitive with key players including Broadcom, EMCORE Corporation, APIC Corporation, Optical Zonu Corp, Gooch & Housego PLC, ViaLite, Global Invacom, HUBER+SUHNER, Glenair, SEIKOH GIKEN CO., LTD., II-VI Incorporated, DEV Systemtechnik GmbH, Octane Wireless, Syntonics LLC, Intelibs, Inc., ETL Systems Ltd, Narda-MITEQ, Olabs Technology Company Limited, RFOptic Ltd., Elkay, MicroComp Nordic AB, Microwave Photonic Systems, Inc., among others.

Future Outlook

  • Positive outlook for the global RF-over-fiber market with significant growth potential in the Asia Pacific region
  • The incorporation of the expanding 5G and 6G infrastructure globally, as well as the growing demand for RFOF in defense applications to drive growth
  • Issues like trade route congestion and trade restrictions between some countries constrain market expansion challenges. The pandemic-related closure of manufacturing plants has greatly affected the market.
  • Key players to focus on product innovation, expanding market reach and maintaining competitive pricing to stay ahead.

Segmentation

  • By Modules
    • Transceivers
    • Optical Amplifiers
    • Antennas
    • Optical Switches
    • Optical Cables
    • Others
  • By Frequency Band
    • L Band
    • S Band
    • Ka Band
    • C Band
    • K Band
    • X Band
    • Ku Band
  • By Vertical
    • Civil
    • Military
  • By Frequency Range
    • Less Than 30 GHz
    • 30 GHz to 40 GHz
    • 40 GHz to 50 GHz
    • More Than 50 GHz
  • By Organization Size
    • Large Scale Organization
    • Medium Scale Organization
    • Small Scale Organization
  • By Application
    • Telecommunications
    • Broadcast
    • Navigation
    • Radar
    • Broadband
  • By Region
  • North America
    • The US.
    • Canada
    • Mexico
  • Europe
    • Germany
    • France
    • The U.K.
    • Italy
    • Spain
    • Rest of Europe
  • Asia Pacific
    • China
    • Japan
    • India
    • South Korea
    • South-east Asia
    • Rest of Asia Pacific
  • Latin America
    • Brazil
    • Argentina
    • Rest of Latin America
  • Middle East & Africa
    • GCC Countries
    • South Africa
    • Rest of the Middle East and Africa

1. Preface
1.1. Report Description
1.1.1. Purpose of the Report
1.1.2. Target Audience
1.1.3. USP and Key Offerings
1.2. Research Scope
1.3. Research Methodology
1.3.1. Phase I – Secondary Research
1.3.2. Phase II – Data Modelling
1.3.2.1. Company Share Analysis Model
1.3.2.2. Revenue Based Modelling
1.3.3. Phase III – Primary Research
1.3.4. Research Limitations
1.3.5. Assumptions
1.4. Market Introduction
1.5. Market Research Scope

2. Executive Summary
2.1. Market Snapshot: Global RF-over-fiber Market
2.2. Global RF-over-fiber Market, By Modules
2.3. Global RF-over-fiber Market, By Frequency Band
2.4. Global RF-over-fiber Market, By Vertical
2.5. Global RF-over-fiber Market, By Frequency Range
2.6. Global RF-over-fiber Market, By Organization Size
2.7. Global RF-over-fiber Market, By Application
2.8. Global RF-over-fiber Market, By Region

3. Market Dynamics & Factors Analysis
3.1. Introduction
3.1.1. Global RF-over-fiber Market Value, 2017-2030, (US$ Bn)
3.1.2. Y-o-Y Growth Trend Analysis
3.2. Market Dynamics
3.2.1. Market Drivers
3.2.1.1. Driver 1
3.2.1.2. Driver 2
3.2.1.3. Driver 3
3.2.2. Market Restraints
3.2.2.1. Restraint 1
3.2.2.2. Restraint 2
3.2.3. Market Opportunities
3.2.3.1. Opportunity 1
3.2.3.2. Opportunity 2
3.2.4. Major Industry Challenges
3.2.4.1. Challenge 1
3.2.4.2. Challenge 2
3.3. Growth and Development Patterns
3.4. Investment Feasibility Analysis
3.5. Market Opportunity Analysis
3.5.1. Modules
3.5.2. Frequency Band
3.5.3. Vertical
3.5.4. Geography

4. Premium Insights
4.1. STAR (Situation, Task, Action, Results) Analysis
4.2. Porter’s Five Forces Analysis
4.2.1. Threat of New Entrants
4.2.2. Bargaining Power of Buyers/Consumers
4.2.3. Bargaining Power of Suppliers
4.2.4. Threat of Substitute Modules
4.2.5. Intensity of Competitive Rivalry
4.3. Key Market Trends
4.3.1. Demand Side Trends
4.3.2. Supply Side Trends
4.4. Value Chain Analysis
4.5. Modules Analysis
4.6. Analysis and Recommendations
4.7. Marketing Strategy Analysis
4.7.1. Direct Marketing
4.7.2. Indirect Marketing
4.7.3. Marketing Channel Development Trend

5. Market Positioning of Key Players, 2022
5.1. Company market share of key players, 2022
5.2. Competitive Benchmarking
5.3. Market Positioning of Key Vendors
5.4. Geographical Presence Analysis
5.5. Major Strategies Adopted by Key Players
5.5.1. Key Strategies Analysis
5.5.2. Mergers and Acquisitions
5.5.3. Partnerships
5.5.4. Product Launch
5.5.5. Geographical Expansion
5.5.6. Others

6. Economic Impact Analysis
6.1. Recession Impact
6.1.1. North America
6.1.2. Europe
6.1.3. Asia Pacific
6.1.4. Latin America
6.1.5. Middle East and Africa
6.2. Ukraine-Russia War Impact
6.2.1. North America
6.2.2. Europe
6.2.3. Asia Pacific
6.2.4. Latin America
6.2.5. Middle East and Africa
6.3. COVID-19 Impact Analysis
6.3.1. North America
6.3.2. Europe
6.3.3. Asia Pacific
6.3.4. Latin America
6.3.5. Middle East and Africa

7. Global RF-over-fiber Market, By Modules
7.1. Global RF-over-fiber Market Overview, by Modules
7.1.1. Global RF-over-fiber Market Revenue Share, By Modules, 2022 Vs 2030 (in %)
7.2. Transceivers
7.2.1. Global RF-over-fiber Market, By Region, 2017-2030 (US$ Bn)
7.3. Optical Amplifiers
7.3.1. Global RF-over-fiber Market, By Region, 2017-2030 (US$ Bn)
7.4. Antennas
7.4.1. Global RF-over-fiber Market, By Region, 2017-2030 (US$ Bn)
7.5. Optical Switches
7.5.1. Global RF-over-fiber Market, By Region, 2017-2030 (US$ Bn)
7.6. Optical Cables
7.6.1. Global RF-over-fiber Market, By Region, 2017-2030 (US$ Bn)
7.7. Others
7.7.1. Global RF-over-fiber Market, By Region, 2017-2030 (US$ Bn)

8. Global RF-over-fiber Market, By Frequency Band
8.1. Global RF-over-fiber Market Overview, by Frequency Band
8.1.1. Global RF-over-fiber Market, By Frequency Band, 2022 vs 2030 (in %)
8.2. L Band
8.2.1. Global RF-over-fiber Market, By Region, 2017-2030 (US$ Bn)
8.3. S Band
8.3.1. Global RF-over-fiber Market, By Region, 2017-2030 (US$ Bn)
8.4. Ka Band
8.4.1. Global RF-over-fiber Market, By Region, 2017-2030 (US$ Bn)
8.5. C Band
8.5.1. Global RF-over-fiber Market, By Region, 2017-2030 (US$ Bn)
8.6. K Band
8.6.1. Global RF-over-fiber Market, By Region, 2017-2030 (US$ Bn)
8.7. X Band
8.7.1. Global RF-over-fiber Market, By Region, 2017-2030 (US$ Bn)
8.8. Ku Band
8.8.1. Global RF-over-fiber Market, By Region, 2017-2030 (US$ Bn)

9. Global RF-over-fiber Market, by Vertical, 2017-2030 (US$ Bn)
9.1. Global RF-over-fiber Market Overview, by Vertical
9.1.1. Global RF-over-fiber Market, By Vertical, 2022 vs 2030 (in%)
9.2. Civil
9.2.1. Global RF-over-fiber Market, By Region, 2017-2030 (US$ Bn)
9.3. Military
9.3.1. Global RF-over-fiber Market, By Region, 2017-2030 (US$ Bn)

10. Global RF-over-fiber Market, By Frequency Range
10.1. Global RF-over-fiber Market Overview, by Frequency Range
10.1.1. Global RF-over-fiber Market Revenue Share, By Frequency Range, 2022 Vs 2030 (in %)
10.2. Less Than 30 GHz
10.2.1. Global RF-over-fiber Market, By Region, 2017-2030 (US$ Bn)
10.3. 30 GHz to 40 GHz
10.3.1. Global RF-over-fiber Market, By Region, 2017-2030 (US$ Bn)
10.4. 40 GHz to 50 GHz
10.4.1. Global RF-over-fiber Market, By Region, 2017-2030 (US$ Bn)
10.5. More Than 50 GHz
10.5.1. Global RF-over-fiber Market, By Region, 2017-2030 (US$ Bn)

11. Global RF-over-fiber Market, By Organization Size
11.1. Global RF-over-fiber Market Overview, by Organization Size
11.1.1. Global RF-over-fiber Market Revenue Share, By Organization Size, 2022 Vs 2030 (in %)
11.2. Large Scale Organization
11.2.1. Global RF-over-fiber Market, By Region, 2017-2030 (US$ Bn)
11.3. Medium Scale Organization
11.3.1. Global RF-over-fiber Market, By Region, 2017-2030 (US$ Bn)
11.4. Small Scale Organization
11.4.1. Global RF-over-fiber Market, By Region, 2017-2030 (US$ Bn)

12. Global RF-over-fiber Market, By Application
12.1. Global RF-over-fiber Market Overview, by Application
12.1.1. Global RF-over-fiber Market, By Frequency Band, 2022 vs 2030 (in %)
12.2. Telecommunications
12.2.1. Global RF-over-fiber Market, By Region, 2017-2030 (US$ Bn)
12.3. Broadcast
12.3.1. Global RF-over-fiber Market, By Region, 2017-2030 (US$ Bn)
12.4. Navigation
12.4.1. Global RF-over-fiber Market, By Region, 2017-2030 (US$ Bn)
12.5. Radar
12.5.1. Global RF-over-fiber Market, By Region, 2017-2030 (US$ Bn)
12.6. Broadband
12.6.1. Global RF-over-fiber Market, By Region, 2017-2030 (US$ Bn)

13. Global RF-over-fiber Market, By Region
13.1. Global RF-over-fiber Market Overview, by Region
13.1.1. Global RF-over-fiber Market, By Region, 2022 vs 2030 (in%)
13.2. Modules
13.2.1. Global RF-over-fiber Market, By Modules, 2017-2030 (US$ Bn)
13.3. Frequency Band
13.3.1. Global RF-over-fiber Market, By Frequency Band, 2017-2030 (US$ Bn)
13.4. Vertical
13.4.1. Global RF-over-fiber Market, By Vertical, 2017-2030 (US$ Bn)
13.5. Frequency Range
13.5.1. Global RF-over-fiber Market, By Frequency Range, 2017-2030 (US$ Bn)
13.6. Organization Size
13.6.1. Global RF-over-fiber Market, By Organization Size, 2017-2030 (US$ Bn)
13.7. Application
13.7.1. Global RF-over-fiber Market, By Application, 2017-2030 (US$ Bn)

14. North America RF-over-fiber Market Analysis
14.1. North America RF-over-fiber Market, by Modules, 2017-2030(US$ Bn)
14.1.1. Overview
14.1.2. SRC Analysis
14.2. North America RF-over-fiber Market, by Frequency Band, 2017-2030(US$ Bn)
14.2.1. Overview
14.2.2. SRC Analysis
14.3. North America RF-over-fiber Market, by Vertical, 2017-2030(US$ Bn)
14.3.1. Overview
14.3.2. SRC Analysis
14.4. North America RF-over-fiber Market, by Frequency Range, 2017-2030(US$ Bn)
14.4.1. Overview
14.4.2. SRC Analysis
14.5. North America RF-over-fiber Market, by Organization Size, 2017-2030(US$ Bn)
14.5.1. Overview
14.5.2. SRC Analysis
14.6. North America RF-over-fiber Market, by Application, 2017-2030(US$ Bn)
14.6.1. Overview
14.6.2. SRC Analysis
14.7. North America RF-over-fiber Market, by Country, 2017-2030 (US$ Bn)
14.7.1. North America RF-over-fiber Market, by Country, 2022 Vs 2030 (in%)
14.7.2. U.S.
14.7.2.1. U.S. RF-over-fiber Market Estimates and Forecast, 2017-2030 (US$ Bn)
14.7.2.2. U.S. RF-over-fiber, By Modules, 2017-2030 (US$ Bn)
14.7.2.3. U.S. RF-over-fiber, By Frequency Band, 2017-2030 (US$ Bn)
14.7.2.4. U.S. RF-over-fiber, By Vertical, 2017-2030 (US$ Bn)
14.7.2.5. U.S. RF-over-fiber, By Frequency Range, 2017-2030 (US$ Bn)
14.7.2.6. U.S. RF-over-fiber, By Organization Size, 2017-2030 (US$ Bn)
14.7.2.7. U.S. RF-over-fiber, By Application, 2017-2030 (US$ Bn)
14.7.3. Canada
14.7.3.1. Canada RF-over-fiber Market Estimates and Forecast, 2017-2030 (US$ Bn)
14.7.3.2. Canada RF-over-fiber, By Modules, 2017-2030 (US$ Bn)
14.7.3.3. Canada RF-over-fiber, By Frequency Band, 2017-2030 (US$ Bn)
14.7.3.4. Canada RF-over-fiber, By Vertical, 2017-2030 (US$ Bn)
14.7.3.5. Canada RF-over-fiber, By Frequency Range, 2017-2030 (US$ Bn)
14.7.3.6. Canada RF-over-fiber, By Organization Size, 2017-2030 (US$ Bn)
14.7.3.7. Canada RF-over-fiber, By Application, 2017-2030 (US$ Bn)
14.7.4. Mexico
14.7.4.1. Mexico RF-over-fiber Market Estimates and Forecast, 2017-2030 (US$ Bn)
14.7.4.2. Mexico RF-over-fiber, By Modules, 2017-2030 (US$ Bn)
14.7.4.3. Mexico RF-over-fiber, By Frequency Band, 2017-2030 (US$ Bn)
14.7.4.4. Mexico RF-over-fiber, By Vertical, 2017-2030 (US$ Bn)
14.7.4.5. Mexico RF-over-fiber, By Frequency Range, 2017-2030 (US$ Bn)
14.7.4.6. Mexico RF-over-fiber, By Organization Size, 2017-2030 (US$ Bn)
14.7.4.7. Mexico RF-over-fiber, By Application, 2017-2030 (US$ Bn)

15. Europe RF-over-fiber Market Analysis
15.1. Europe RF-over-fiber Market, by Modules, 2017-2030(US$ Bn)
15.1.1. Overview
15.1.2. SRC Analysis
15.2. Europe RF-over-fiber Market, by Frequency Band, 2017-2030(US$ Bn)
15.2.1. Overview
15.2.2. SRC Analysis
15.3. Europe RF-over-fiber Market, by Vertical, 2017-2030(US$ Bn)
15.3.1. Overview
15.3.2. SRC Analysis
15.4. Europe RF-over-fiber Market, by Frequency Range, 2017-2030(US$ Bn)
15.4.1. Overview
15.4.2. SRC Analysis
15.5. Europe RF-over-fiber Market, by Organization Size, 2017-2030(US$ Bn)
15.5.1. Overview
15.5.2. SRC Analysis
15.6. Europe RF-over-fiber Market, by Application, 2017-2030(US$ Bn)
15.6.1. Overview
15.6.2. SRC Analysis
15.7. Europe RF-over-fiber Market, by Country, 2017-2030 (US$ Bn)
15.7.1. Europe RF-over-fiber Market, by Country, 2022 Vs 2030 (in%)
15.7.2. Germany
15.7.2.1. Germany RF-over-fiber Market Estimates and Forecast, 2017-2030 (US$ Bn)
15.7.2.2. Germany RF-over-fiber, By Modules, 2017-2030 (US$ Bn)
15.7.2.3. Germany RF-over-fiber, By Frequency Band, 2017-2030 (US$ Bn)
15.7.2.4. Germany RF-over-fiber, By Vertical, 2017-2030 (US$ Bn)
15.7.2.5. Germany RF-over-fiber, By Frequency Range, 2017-2030 (US$ Bn)
15.7.2.6. Germany RF-over-fiber, By Organization Size, 2017-2030 (US$ Bn)
15.7.2.7. Germany RF-over-fiber, By Application, 2017-2030 (US$ Bn)
15.7.3. France
15.7.3.1. France RF-over-fiber Market Estimates and Forecast, 2017-2030 (US$ Bn)
15.7.3.2. France RF-over-fiber, By Modules, 2017-2030 (US$ Bn)
15.7.3.3. France RF-over-fiber, By Frequency Band, 2017-2030 (US$ Bn)
15.7.3.4. France RF-over-fiber, By Vertical, 2017-2030 (US$ Bn)
15.7.3.5. France RF-over-fiber, By Frequency Range, 2017-2030 (US$ Bn)
15.7.3.6. France RF-over-fiber, By Organization Size, 2017-2030 (US$ Bn)
15.7.3.7. France RF-over-fiber, By Application, 2017-2030 (US$ Bn)
15.7.4. UK
15.7.4.1. UK RF-over-fiber Market Estimates and Forecast, 2017-2030 (US$ Bn)
15.7.4.2. UK RF-over-fiber, By Modules, 2017-2030 (US$ Bn)
15.7.4.3. UK RF-over-fiber, By Frequency Band, 2017-2030 (US$ Bn)
15.7.4.4. UK RF-over-fiber, By Vertical, 2017-2030 (US$ Bn)
15.7.4.5. UK RF-over-fiber, By Frequency Range, 2017-2030 (US$ Bn)
15.7.4.6. UK RF-over-fiber, By Organization Size, 2017-2030 (US$ Bn)
15.7.4.7. UK RF-over-fiber, By Application, 2017-2030 (US$ Bn)
15.7.5. Italy
15.7.5.1. Italy RF-over-fiber Market Estimates and Forecast, 2017-2030 (US$ Bn)
15.7.5.2. Italy RF-over-fiber, By Modules, 2017-2030 (US$ Bn)
15.7.5.3. Italy RF-over-fiber, By Frequency Band, 2017-2030 (US$ Bn)
15.7.5.4. Italy RF-over-fiber, By Vertical, 2017-2030 (US$ Bn)
15.7.5.5. Italy RF-over-fiber, By Frequency Range, 2017-2030 (US$ Bn)
15.7.5.6. Italy RF-over-fiber, By Organization Size, 2017-2030 (US$ Bn)
15.7.5.7. Italy RF-over-fiber, By Application, 2017-2030 (US$ Bn)
15.7.6. Spain
15.7.6.1. Spain RF-over-fiber Market Estimates and Forecast, 2017-2030 (US$ Bn)
15.7.6.2. Spain RF-over-fiber, By Modules, 2017-2030 (US$ Bn)
15.7.6.3. Spain RF-over-fiber, By Frequency Band, 2017-2030 (US$ Bn)
15.7.6.4. Spain RF-over-fiber, By Vertical, 2017-2030 (US$ Bn)
15.7.6.5. Spain RF-over-fiber, By Frequency Range, 2017-2030 (US$ Bn)
15.7.6.6. Spain RF-over-fiber, By Organization Size, 2017-2030 (US$ Bn)
15.7.6.7. Spain RF-over-fiber, By Application, 2017-2030 (US$ Bn)
15.7.7. Rest of Europe
15.7.7.1. Rest of Europe RF-over-fiber Market Estimates and Forecast, 2017-2030 (US$ Bn)
15.7.7.2. Rest of Europe RF-over-fiber, By Modules, 2017-2030 (US$ Bn)
15.7.7.3. Rest of Europe RF-over-fiber, By Frequency Band, 2017-2030 (US$ Bn)
15.7.7.4. Rest of Europe RF-over-fiber, By Vertical, 2017-2030 (US$ Bn)
15.7.7.5. Rest of Europe RF-over-fiber, By Frequency Range, 2017-2030 (US$ Bn)
15.7.7.6. Rest of Europe RF-over-fiber, By Organization Size, 2017-2030 (US$ Bn)
15.7.7.7. Rest of Europe RF-over-fiber, By Application, 2017-2030 (US$ Bn)

16. Asia Pacific RF-over-fiber Market Analysis
16.1. Asia Pacific RF-over-fiber Market, by Modules, 2017-2030(US$ Bn)
16.1.1. Overview
16.1.2. SRC Analysis
16.2. Asia Pacific RF-over-fiber Market, by Frequency Band, 2017-2030(US$ Bn)
16.2.1. Overview
16.2.2. SRC Analysis
16.3. Asia Pacific RF-over-fiber Market, by Vertical, 2017-2030(US$ Bn)
16.3.1. Overview
16.3.2. SRC Analysis
16.4. Asia Pacific RF-over-fiber Market, by Frequency Range, 2017-2030(US$ Bn)
16.4.1. Overview
16.4.2. SRC Analysis
16.5. Asia Pacific RF-over-fiber Market, by Organization Size, 2017-2030(US$ Bn)
16.5.1. Overview
16.5.2. SRC Analysis
16.6. Asia Pacific RF-over-fiber Market, by Application, 2017-2030(US$ Bn)
16.6.1. Overview
16.6.2. SRC Analysis
16.7. Asia Pacific RF-over-fiber Market, by Country, 2017-2030 (US$ Bn)
16.7.1. Asia Pacific RF-over-fiber Market, by Country, 2022 Vs 2030 (in%)
16.7.2. China
16.7.2.1. China RF-over-fiber Market Estimates and Forecast, 2017-2030 (US$ Bn)
16.7.2.2. China RF-over-fiber, By Modules, 2017-2030 (US$ Bn)
16.7.2.3. China RF-over-fiber, By Frequency Band, 2017-2030 (US$ Bn)
16.7.2.4. China RF-over-fiber, By Vertical, 2017-2030 (US$ Bn)
16.7.2.5. China RF-over-fiber, By Frequency Range, 2017-2030 (US$ Bn)
16.7.2.6. China RF-over-fiber, By Organization Size, 2017-2030 (US$ Bn)
16.7.2.7. China RF-over-fiber, By Application, 2017-2030 (US$ Bn)
16.7.3. Japan
16.7.3.1. Japan RF-over-fiber Market Estimates and Forecast, 2017-2030 (US$ Bn)
16.7.3.2. Japan RF-over-fiber, By Modules, 2017-2030 (US$ Bn)
16.7.3.3. Japan RF-over-fiber, By Frequency Band, 2017-2030 (US$ Bn)
16.7.3.4. Japan RF-over-fiber, By Vertical, 2017-2030 (US$ Bn)
16.7.3.5. Japan RF-over-fiber, By Frequency Range, 2017-2030 (US$ Bn)
16.7.3.6. Japan RF-over-fiber, By Organization Size, 2017-2030 (US$ Bn)
16.7.3.7. Japan RF-over-fiber, By Application, 2017-2030 (US$ Bn)
16.7.4. India
16.7.4.1. India RF-over-fiber Market Estimates and Forecast, 2017-2030 (US$ Bn)
16.7.4.2. India RF-over-fiber, By Modules, 2017-2030 (US$ Bn)
16.7.4.3. India RF-over-fiber, By Frequency Band, 2017-2030 (US$ Bn)
16.7.4.4. India RF-over-fiber, By Vertical, 2017-2030 (US$ Bn)
16.7.4.5. India RF-over-fiber, By Frequency Range, 2017-2030 (US$ Bn)
16.7.4.6. India RF-over-fiber, By Organization Size, 2017-2030 (US$ Bn)
16.7.4.7. India RF-over-fiber, By Application, 2017-2030 (US$ Bn)
16.7.5. South Korea
16.7.5.1. South Korea RF-over-fiber Market Estimates and Forecast, 2017-2030 (US$ Bn)
16.7.5.2. South Korea RF-over-fiber, By Modules, 2017-2030 (US$ Bn)
16.7.5.3. South Korea RF-over-fiber, By Frequency Band, 2017-2030 (US$ Bn)
16.7.5.4. South Korea RF-over-fiber, By Vertical, 2017-2030 (US$ Bn)
16.7.5.5. South Korea RF-over-fiber, By Frequency Range, 2017-2030 (US$ Bn)
16.7.5.6. South Korea RF-over-fiber, By Organization Size, 2017-2030 (US$ Bn)
16.7.5.7. South Korea RF-over-fiber, By Application, 2017-2030 (US$ Bn)
16.7.6. South-East Asia
16.7.6.1. South-East Asia RF-over-fiber Market Estimates and Forecast, 2017-2030 (US$ Bn)
16.7.6.2. South-East Asia RF-over-fiber, By Modules, 2017-2030 (US$ Bn)
16.7.6.3. South-East Asia RF-over-fiber, By Frequency Band, 2017-2030 (US$ Bn)
16.7.6.4. South-East Asia RF-over-fiber, By Vertical, 2017-2030 (US$ Bn)
16.7.6.5. South East Asia RF-over-fiber, By Frequency Range, 2017-2030 (US$ Bn)
16.7.6.6. South East Asia RF-over-fiber, By Organization Size, 2017-2030 (US$ Bn)
16.7.6.7. South East Asia RF-over-fiber, By Application, 2017-2030 (US$ Bn)
16.7.7. Rest of Asia Pacific
16.7.7.1. Rest of Asia Pacific RF-over-fiber Market Estimates and Forecast, 2017-2030 (US$ Bn)
16.7.7.2. Rest of Asia Pacific RF-over-fiber, By Modules, 2017-2030 (US$ Bn)
16.7.7.3. Rest of Asia Pacific RF-over-fiber, By Frequency Band, 2017-2030 (US$ Bn)
16.7.7.4. Rest of Asia Pacific RF-over-fiber, By Vertical, 2017-2030 (US$ Bn)
16.7.7.5. Rest of Asia Pacific RF-over-fiber, By Frequency Range, 2017-2030 (US$ Bn)
16.7.7.6. Rest of Asia Pacific RF-over-fiber, By Organization Size, 2017-2030 (US$ Bn)
16.7.7.7. Rest of Asia Pacific RF-over-fiber, By Application, 2017-2030 (US$ Bn)

17. Latin America RF-over-fiber Market Analysis
17.1. Latin America RF-over-fiber Market, by Modules, 2017-2030(US$ Bn)
17.1.1. Overview
17.1.2. SRC Analysis
17.2. Latin America RF-over-fiber Market, by Frequency Band, 2017-2030(US$ Bn)
17.2.1. Overview
17.2.2. SRC Analysis
17.3. Latin America RF-over-fiber Market, by Vertical, 2017-2030(US$ Bn)
17.3.1. Overview
17.3.2. SRC Analysis
17.4. Latin America RF-over-fiber Market, by Frequency Range, 2017-2030(US$ Bn)
17.4.1. Overview
17.4.2. SRC Analysis
17.5. Latin America RF-over-fiber Market, by Organization Size, 2017-2030(US$ Bn)
17.5.1. Overview
17.5.2. SRC Analysis
17.6. Latin America RF-over-fiber Market, by Application, 2017-2030(US$ Bn)
17.6.1. Overview
17.6.2. SRC Analysis
17.7. Latin America RF-over-fiber Market, by Country, 2017-2030 (US$ Bn)
17.7.1. Latin America RF-over-fiber Market, by Country, 2022 Vs 2030 (in%)
17.7.2. Brazil
17.7.2.1. Brazil RF-over-fiber Market Estimates and Forecast, 2017-2030 (US$ Bn)
17.7.2.2. Brazil RF-over-fiber, By Modules, 2017-2030 (US$ Bn)
17.7.2.3. Brazil RF-over-fiber, By Frequency Band, 2017-2030 (US$ Bn)
17.7.2.4. Brazil RF-over-fiber, By Vertical, 2017-2030 (US$ Bn)
17.7.2.5. Brazil RF-over-fiber, By Frequency Range, 2017-2030 (US$ Bn)
17.7.2.6. Brazil RF-over-fiber, By Organization Size, 2017-2030 (US$ Bn)
17.7.2.7. Brazil RF-over-fiber, By Application, 2017-2030 (US$ Bn)
17.7.3. Argentina
17.7.3.1. Argentina RF-over-fiber Market Estimates and Forecast, 2017-2030 (US$ Bn)
17.7.3.2. Argentina RF-over-fiber, By Modules, 2017-2030 (US$ Bn)
17.7.3.3. Argentina RF-over-fiber, By Frequency Band, 2017-2030 (US$ Bn)
17.7.3.4. Argentina RF-over-fiber, By Vertical, 2017-2030 (US$ Bn)
17.7.3.5. Argentina RF-over-fiber, By Frequency Range, 2017-2030 (US$ Bn)
17.7.3.6. Argentina RF-over-fiber, By Organization Size, 2017-2030 (US$ Bn)
17.7.3.7. Argentina RF-over-fiber, By Application, 2017-2030 (US$ Bn)
17.7.4. Rest of Latin America
17.7.4.1. Rest of Latin America RF-over-fiber Market Estimates and Forecast, 2017-2030 (US$ Bn)
17.7.4.2. Rest of Latin America RF-over-fiber, By Modules, 2017-2030 (US$ Bn)
17.7.4.3. Rest of Latin America RF-over-fiber, By Frequency Band, 2017-2030 (US$ Bn)
17.7.4.4. Rest of Latin America RF-over-fiber, By Vertical, 2017-2030 (US$ Bn)
17.7.4.5. Rest of Latin America RF-over-fiber, By Frequency Range, 2017-2030 (US$ Bn)
17.7.4.6. Rest of Latin America RF-over-fiber, By Organization Size, 2017-2030 (US$ Bn)
17.7.4.7. Rest of Latin America RF-over-fiber, By Application, 2017-2030 (US$ Bn)

18. Middle East and Africa RF-over-fiber Market Analysis
18.1. Middle East and Africa RF-over-fiber Market, by Modules, 2017-2030(US$ Bn)
18.1.1. Overview
18.1.2. SRC Analysis
18.2. Middle East and Africa RF-over-fiber Market, by Frequency Band, 2017-2030(US$ Bn)
18.2.1. Overview
18.2.2. SRC Analysis
18.3. Middle East and Africa RF-over-fiber Market, by Vertical, 2017-2030(US$ Bn)
18.3.1. Overview
18.3.2. SRC Analysis
18.4. Middle East and Africa RF-over-fiber Market, by Frequency Range, 2017-2030(US$ Bn)
18.4.1. Overview
18.4.2. SRC Analysis
18.5. Middle East and Africa RF-over-fiber Market, by Organization Size, 2017-2030(US$ Bn)
18.5.1. Overview
18.5.2. SRC Analysis
18.6. Middle East and Africa RF-over-fiber Market, by Application, 2017-2030(US$ Bn)
18.6.1. Overview
18.6.2. SRC Analysis
18.7. Middle East and Africa RF-over-fiber Market, by Country, 2017-2030 (US$ Bn)
18.7.1. Middle East and Africa RF-over-fiber Market, by Country, 2022 Vs 2030 (in%)
18.7.2. GCC Countries
18.7.2.1. GCC Countries RF-over-fiber Market Estimates and Forecast, 2017-2030 (US$ Bn)
18.7.2.2. GCC Countries RF-over-fiber, By Modules, 2017-2030 (US$ Bn)
18.7.2.3. GCC Countries RF-over-fiber, By Frequency Band, 2017-2030 (US$ Bn)
18.7.2.4. GCC Countries RF-over-fiber, By Vertical, 2017-2030 (US$ Bn)
18.7.2.5. GCC Countries RF-over-fiber, By Frequency Range, 2017-2030 (US$ Bn)
18.7.2.6. GCC Countries RF-over-fiber, By Organization Size, 2017-2030 (US$ Bn)
18.7.2.7. GCC Countries RF-over-fiber, By Application, 2017-2030 (US$ Bn)
18.7.3. South Africa
18.7.3.1. South Africa RF-over-fiber Market Estimates and Forecast, 2017-2030 (US$ Bn)
18.7.3.2. South Africa RF-over-fiber, By Modules, 2017-2030 (US$ Bn)
18.7.3.3. South Africa RF-over-fiber, By Frequency Band, 2017-2030 (US$ Bn)
18.7.3.4. South Africa RF-over-fiber, By Vertical, 2017-2030 (US$ Bn)
18.7.3.5. South Africa RF-over-fiber, By Frequency Range, 2017-2030 (US$ Bn)
18.7.3.6. South Africa RF-over-fiber, By Organization Size, 2017-2030 (US$ Bn)
18.7.3.7. South Africa RF-over-fiber, By Application, 2017-2030 (US$ Bn)
18.7.4. Rest of Middle East and Africa
18.7.4.1. Rest of Middle East and Africa RF-over-fiber Market Estimates and Forecast, 2017-2030 (US$ Bn)
18.7.4.2. Rest of Middle East and Africa RF-over-fiber, By Modules, 2017-2030 (US$ Bn)
18.7.4.3. Rest of Middle East and Africa RF-over-fiber, By Frequency Band, 2017-2030 (US$ Bn)
18.7.4.4. Rest of Middle East and Africa RF-over-fiber, By Vertical, 2017-2030 (US$ Bn)
18.7.4.5. Rest of Middle East and Africa RF-over-fiber, By Frequency Range, 2017-2030 (US$ Bn)
18.7.4.6. Rest of Middle East & Africa RF-over-fiber, By Organization Size, 2017-2030 (US$ Bn)
18.7.4.7. Rest of Middle East and Africa RF-over-fiber, By Application, 2017-2030 (US$ Bn)

19. Company Profiles
19.1. Broadcom
19.1.1. Company Overview
19.1.2. Products/Services Portfolio
19.1.3. Geographical Presence
19.1.4. Financial Summary
19.1.4.1. Market Revenue and Net Profit (2019-2022)
19.1.4.2. Business Segment Revenue Analysis
19.1.4.3. Geographical Revenue Analysis
19.2. EMCORE Corporation
19.3. APIC Corporation
19.4. Optical Zonu Corp
19.5. Gooch & Housego PLC
19.6. ViaLite
19.7. Global Invacom
19.8. HUBER+SUHNER
19.9. Glenair
19.10. SEIKOH GIKEN CO., LTD.
19.11. II-VI Incorporated
19.12. DEV Systemtechnik GmbH
19.13. Octane Wireless
19.14. Syntonics LLC
19.15. Intelibs, Inc.
19.16. ETL Systems Ltd
19.17. Narda-MITEQ
19.18. Olabs Technology Company Limited
19.19. RFOptic Ltd.
19.20. Elkay
19.21. MicroComp Nordic AB
19.22. Microwave Photonic Systems, Inc.

List of Figures
FIG. 1 Global RF-over-fiber Market: Research Methodology
FIG. 2 Market Size Estimation – Top Down & Bottom up Approach
FIG. 3 Global RF-over-fiber Market Segmentation
FIG. 4 Global RF-over-fiber Market, by Modules, 2022 (US$ Bn)
FIG. 5 Global RF-over-fiber Market, by Frequency Band, 2022 (US$ Bn)
FIG. 6 Global RF-over-fiber Market, by Vertical, 2022 (US$ Bn)
FIG. 7 Global RF-over-fiber Market, by Frequency Range, 2022 (US$ Bn)
FIG. 8 Global RF-over-fiber Market, by Organization Size, 2022 (US$ Bn)
FIG. 9 Global RF-over-fiber Market, by Application, 2022 (US$ Bn)
FIG. 10 Global RF-over-fiber Market, by Geography, 2022 (US$ Bn)
FIG. 11 Attractive Investment Proposition, by Modules, 2022
FIG. 12 Attractive Investment Proposition, by Frequency Band, 2022
FIG. 13 Attractive Investment Proposition, by Vertical, 2022
FIG. 14 Attractive Investment Proposition, by Frequency Range, 2022
FIG. 15 Attractive Investment Proposition, by Organization Size, 2022
FIG. 16 Attractive Investment Proposition, by Application, 2022
FIG. 17 Attractive Investment Proposition, by Geography, 2022
FIG. 18 Global Market Share Analysis of Key RF-over-fiber Market Manufacturers, 2022
FIG. 19 Global Market Positioning of Key RF-over-fiber Market Manufacturers, 2022
FIG. 20 Global RF-over-fiber Market Value Contribution, By Modules, 2022 & 2030 (Value %)
FIG. 21 Global RF-over-fiber Market, by Transceivers, Value, 2017-2030 (US$ Bn)
FIG. 22 Global RF-over-fiber Market, by Optical Amplifiers, Value, 2017-2030 (US$ Bn)
FIG. 23 Global RF-over-fiber Market, by Antennas, Value, 2017-2030 (US$ Bn)
FIG. 24 Global RF-over-fiber Market, by Optical Switches, Value, 2017-2030 (US$ Bn)
FIG. 25 Global RF-over-fiber Market, by Optical Cables, Value, 2017-2030 (US$ Bn)
FIG. 26 Global RF-over-fiber Market, by Others, Value, 2017-2030 (US$ Bn)
FIG. 27 Global RF-over-fiber Market Value Contribution, By Frequency Band, 2022 & 2030 (Value %)
FIG. 28 Global RF-over-fiber Market, by L Band, Value, 2017-2030 (US$ Bn)
FIG. 29 Global RF-over-fiber Market, by S Band, 2017-2030 (US$ Bn)
FIG. 30 Global RF-over-fiber Market, by Ka Band, 2017-2030 (US$ Bn)
FIG. 31 Global RF-over-fiber Market, by C Band, 2017-2030 (US$ Bn)
FIG. 32 Global RF-over-fiber Market, by K Band, 2017-2030 (US$ Bn)
FIG. 33 Global RF-over-fiber Market, by X Band, 2017-2030 (US$ Bn)
FIG. 34 Global RF-over-fiber Market, by Ku Band, 2017-2030 (US$ Bn)
FIG. 35 Global RF-over-fiber Market Value Contribution, By Vertical, 2022 & 2030 (Value %)
FIG. 36 Global RF-over-fiber Market, by Civil, Value, 2017-2030 (US$ Bn)
FIG. 37 Global RF-over-fiber Market, by Military, 2017-2030 (US$ Bn)
FIG. 38 Global RF-over-fiber Market Value Contribution, By Frequency Range, 2022 & 2030 (Value %)
FIG. 39 Global RF-over-fiber Market, by Less Than 30 GHz, Value, 2017-2030 (US$ Bn)
FIG. 40 Global RF-over-fiber Market, by 30 GHz to 40 GHz, 2017-2030 (US$ Bn)
FIG. 41 Global RF-over-fiber Market, by 40 GHz to 50 GHz, 2017-2030 (US$ Bn)
FIG. 42 Global RF-over-fiber Market, by More Than 50 GHz, 2017-2030 (US$ Bn)
FIG. 43 Global RF-over-fiber Market Value Contribution, By Organization Size, 2022 & 2030 (Value %)
FIG. 44 Global RF-over-fiber Market, by Large Scale Organization, Value, 2017-2030 (US$ Bn)
FIG. 45 Global RF-over-fiber Market, by Medium Scale Organization, 2017-2030 (US$ Bn)
FIG. 46 Global RF-over-fiber Market, by Small Scale Organization, 2017-2030 (US$ Bn)
FIG. 47 Global RF-over-fiber Market Value Contribution, By Application, 2022 & 2030 (Value %)
FIG. 48 Global RF-over-fiber Market, by Telecommunications, Value, 2017-2030 (US$ Bn)
FIG. 49 Global RF-over-fiber Market, by Broadcast, 2017-2030 (US$ Bn)
FIG. 50 Global RF-over-fiber Market, by Navigation, 2017-2030 (US$ Bn)
FIG. 51 Global RF-over-fiber Market, by Radar, 2017-2030 (US$ Bn)
FIG. 52 Global RF-over-fiber Market, by Broadband, 2017-2030 (US$ Bn)
FIG. 53 North America RF-over-fiber Market, 2017-2030 (US$ Bn)
FIG. 54 U.S. RF-over-fiber Market, 2017-2030 (US$ Bn)
FIG. 55 Canada RF-over-fiber Market, 2017-2030 (US$ Bn)
FIG. 56 Europe RF-over-fiber Market, 2017-2030 (US$ Bn)
FIG. 57 Germany RF-over-fiber Market, 2017-2030 (US$ Bn)
FIG. 58 France RF-over-fiber Market, 2017-2030 (US$ Bn)
FIG. 59 U.K. RF-over-fiber Market, 2017-2030 (US$ Bn)
FIG. 60 Italy RF-over-fiber Market, 2017-2030 (US$ Bn)
FIG. 61 Spain RF-over-fiber Market, 2017-2030 (US$ Bn)
FIG. 62 Rest of Europe RF-over-fiber Market, 2017-2030 (US$ Bn)
FIG. 63 Asia Pacific RF-over-fiber Market, 2017-2030 (US$ Bn)
FIG. 64 China RF-over-fiber Market, 2017-2030 (US$ Bn)
FIG. 65 Japan RF-over-fiber Market, 2017-2030 (US$ Bn)
FIG. 66 India RF-over-fiber Market, 2017-2030 (US$ Bn)
FIG. 67 South Korea RF-over-fiber Market, 2017-2030 (US$ Bn)
FIG. 68 South-East Asia RF-over-fiber Market, 2017-2030 (US$ Bn)
FIG. 69 Rest of Asia Pacific RF-over-fiber Market, 2017-2030 (US$ Bn)
FIG. 70 Latin America RF-over-fiber Market, 2017-2030 (US$ Bn)
FIG. 71 Brazil RF-over-fiber Market, 2017-2030 (US$ Bn)
FIG. 72 Mexico RF-over-fiber Market, 2017-2030 (US$ Bn)
FIG. 73 Rest of Latin America RF-over-fiber Market, 2017-2030 (US$ Bn)
FIG. 74 Middle East & Africa RF-over-fiber Market, 2017-2030 (US$ Bn)
FIG. 75 GCC Countries RF-over-fiber Market, 2017-2030 (US$ Bn)
FIG. 76 South Africa RF-over-fiber Market, 2017-2030 (US$ Bn)
FIG. 77 Rest of Middle East and Africa RF-over-fiber Market, 2017-2030 (US$ Bn)

List of Tables
TABLE 1 Market Snapshot: Global RF-over-fiber Market
TABLE 2 Global RF-over-fiber Market: Market Drivers Impact Analysis
TABLE 3 Global RF-over-fiber Market: Market Restraints Impact Analysis
TABLE 4 Global RF-over-fiber Market, by Competitive Benchmarking, 2022
TABLE 5 Global RF-over-fiber Market, by Geographical Presence Analysis, 2022
TABLE 6 Global RF-over-fiber Market, by Key Strategies Analysis, 2022
TABLE 7 Global RF-over-fiber Market, by Transceivers, By Region, 2017-2022 (US$ Bn)
TABLE 8 Global RF-over-fiber Market, by Transceivers, By Region, 2023-2030 (US$ Bn)
TABLE 9 Global RF-over-fiber Market, by Optical Amplifiers, By Region, 2017-2022 (US$ Bn)
TABLE 10 Global RF-over-fiber Market, by Optical Amplifiers, By Region, 2023-2030 (US$ Bn)
TABLE 11 Global RF-over-fiber Market, by Antennas, By Region, 2017-2022 (US$ Bn)
TABLE 12 Global RF-over-fiber Market, by Antennas, By Region, 2023-2030 (US$ Bn)
TABLE 13 Global RF-over-fiber Market, by Optical Switches, By Region, 2017-2022 (US$ Bn)
TABLE 14 Global RF-over-fiber Market, by Optical Switches, By Region, 2023-2030 (US$ Bn)
TABLE 15 Global RF-over-fiber Market, by Optical Cables, By Region, 2017-2022 (US$ Bn)
TABLE 16 Global RF-over-fiber Market, by Optical Cables, By Region, 2023-2030 (US$ Bn)
TABLE 17 Global RF-over-fiber Market, by Others, By Region, 2017-2022 (US$ Bn)
TABLE 18 Global RF-over-fiber Market, by Others, By Region, 2023-2030 (US$ Bn)
TABLE 19 Global RF-over-fiber Market, by L Band, By Region, 2017-2022 (US$ Bn)
TABLE 20 Global RF-over-fiber Market, by L Band, By Region, 2023-2030 (US$ Bn)
TABLE 21 Global RF-over-fiber Market, by S Band, By Region, 2017-2022 (US$ Bn)
TABLE 22 Global RF-over-fiber Market, by S Band, By Region, 2023-2030 (US$ Bn)
TABLE 23 Global RF-over-fiber Market, by Ka Band, By Region, 2017-2022 (US$ Bn)
TABLE 24 Global RF-over-fiber Market, by Ka Band, By Region, 2023-2030 (US$ Bn)
TABLE 25 Global RF-over-fiber Market, by C Band, By Region, 2017-2022 (US$ Bn)
TABLE 26 Global RF-over-fiber Market, by C Band, By Region, 2023-2030 (US$ Bn)
TABLE 27 Global RF-over-fiber Market, by K Band, By Region, 2017-2022 (US$ Bn)
TABLE 28 Global RF-over-fiber Market, by K Band, By Region, 2023-2030 (US$ Bn)
TABLE 29 Global RF-over-fiber Market, by X Band, By Region, 2017-2022 (US$ Bn)
TABLE 30 Global RF-over-fiber Market, by X Band, By Region, 2023-2030 (US$ Bn)
TABLE 31 Global RF-over-fiber Market, by Ku Band, By Region, 2017-2022 (US$ Bn)
TABLE 32 Global RF-over-fiber Market, by Ku Band, By Region, 2023-2030 (US$ Bn)
TABLE 33 Global RF-over-fiber Market, by Civil, By Region, 2017-2022 (US$ Bn)
TABLE 34 Global RF-over-fiber Market, by Civil, By Region, 2023-2030 (US$ Bn)
TABLE 35 Global RF-over-fiber Market, by Military, By Region, 2017-2022 (US$ Bn)
TABLE 36 Global RF-over-fiber Market, by Military, By Region, 2023-2030 (US$ Bn)
TABLE 37 Global RF-over-fiber Market, by Less Than 30 GHz, By Region, 2017-2022 (US$ Bn)
TABLE 38 Global RF-over-fiber Market, by Less Than 30 GHz, By Region, 2023-2030 (US$ Bn)
TABLE 39 Global RF-over-fiber Market, by 30 GHz to 40 GHz, By Region, 2017-2022 (US$ Bn)
TABLE 40 Global RF-over-fiber Market, by 30 GHz to 40 GHz, By Region, 2023-2030 (US$ Bn)
TABLE 41 Global RF-over-fiber Market, by 40 GHz to 50 GHz, By Region, 2017-2022 (US$ Bn)
TABLE 42 Global RF-over-fiber Market, by 40 GHz to 50 GHz, By Region, 2023-2030 (US$ Bn)
TABLE 43 Global RF-over-fiber Market, by More Than 50 GHz, By Region, 2017-2022 (US$ Bn)
TABLE 44 Global RF-over-fiber Market, by More Than 50 GHz, By Region, 2023-2030 (US$ Bn)
TABLE 45 Global RF-over-fiber Market, by Large Scale Organization, By Region, 2017-2022 (US$ Bn)
TABLE 46 Global RF-over-fiber Market, by Large Scale Organization, By Region, 2023-2030 (US$ Bn)
TABLE 47 Global RF-over-fiber Market, by Medium Scale Organization, By Region, 2017-2022 (US$ Bn)
TABLE 48 Global RF-over-fiber Market, by Medium Scale Organization, By Region, 2023-2030 (US$ Bn)
TABLE 49 Global RF-over-fiber Market, by Small Scale Organization, By Region, 2017-2022 (US$ Bn)
TABLE 50 Global RF-over-fiber Market, by Small Scale Organization, By Region, 2023-2030 (US$ Bn)
TABLE 51 Global RF-over-fiber Market, by Telecommunications, By Region, 2017-2022 (US$ Bn)
TABLE 52 Global RF-over-fiber Market, by Telecommunications, By Region, 2023-2030 (US$ Bn)
TABLE 53 Global RF-over-fiber Market, by Broadcast, By Region, 2017-2022 (US$ Bn)
TABLE 54 Global RF-over-fiber Market, by Broadcast, By Region, 2023-2030 (US$ Bn)
TABLE 55 Global RF-over-fiber Market, by Navigation, By Region, 2017-2022 (US$ Bn)
TABLE 56 Global RF-over-fiber Market, by Navigation, By Region, 2023-2030 (US$ Bn)
TABLE 57 Global RF-over-fiber Market, by Radar, By Region, 2017-2022 (US$ Bn)
TABLE 58 Global RF-over-fiber Market, by Radar, By Region, 2023-2030 (US$ Bn)
TABLE 59 Global RF-over-fiber Market, by Broadband, By Region, 2017-2022 (US$ Bn)
TABLE 60 Global RF-over-fiber Market, by Broadband, By Region, 2023-2030 (US$ Bn)
TABLE 61 Global RF-over-fiber Market, by Modules, 2017-2022 (US$ Bn)
TABLE 62 Global RF-over-fiber Market, by Modules, 2023-2030 (US$ Bn)
TABLE 63 Global RF-over-fiber Market, by Frequency Band, 2017-2022 (US$ Bn)
TABLE 64 Global RF-over-fiber Market, by Frequency Band, 2023-2030 (US$ Bn)
TABLE 65 Global RF-over-fiber Market, by Vertical, 2017-2022 (US$ Bn)
TABLE 66 Global RF-over-fiber Market, by Vertical, 2023-2030 (US$ Bn)
TABLE 67 Global RF-over-fiber Market, by Frequency Range, 2017-2022 (US$ Bn)
TABLE 68 Global RF-over-fiber Market, by Frequency Range, 2023-2030 (US$ Bn)
TABLE 69 Global RF-over-fiber Market, by Application, 2017-2022 (US$ Bn)
TABLE 70 Global RF-over-fiber Market, by Application, 2023-2030 (US$ Bn)
TABLE 71 Global RF-over-fiber Market, by Region, 2017-2022 (US$ Bn)
TABLE 72 Global RF-over-fiber Market, by Region, 2023-2030 (US$ Bn)
TABLE 73 North America RF-over-fiber Market, by Modules, 2017-2022 (US$ Bn)
TABLE 74 North America RF-over-fiber Market, by Modules, 2023-2030 (US$ Bn)
TABLE 75 North America RF-over-fiber Market, by Frequency Band, 2017-2022 (US$ Bn)
TABLE 76 North America RF-over-fiber Market, by Frequency Band, 2023-2030 (US$ Bn)
TABLE 77 North America RF-over-fiber Market, by Vertical, 2017-2022 (US$ Bn)
TABLE 78 North America RF-over-fiber Market, by Vertical, 2023-2030 (US$ Bn)
TABLE 79 North America RF-over-fiber Market, by Frequency Range, 2017-2022 (US$ Bn)
TABLE 80 North America RF-over-fiber Market, by Frequency Range, 2023-2030 (US$ Bn)
TABLE 81 North America RF-over-fiber Market, by Organization Size, 2017-2022 (US$ Bn)
TABLE 82 North America RF-over-fiber Market, by Organization Size, 2023-2030 (US$ Bn)
TABLE 83 North America RF-over-fiber Market, by Application, 2017-2022 (US$ Bn)
TABLE 84 North America RF-over-fiber Market, by Application, 2023-2030 (US$ Bn)
TABLE 85 North America RF-over-fiber Market, by Country, 2017-2022 (US$ Bn)
TABLE 86 North America RF-over-fiber Market, by Country, 2023-2030 (US$ Bn)
TABLE 87 United States RF-over-fiber Market, by Modules, 2017-2022 (US$ Bn)
TABLE 88 United States RF-over-fiber Market, by Modules, 2023-2030 (US$ Bn)
TABLE 89 United States RF-over-fiber Market, by Frequency Band, 2017-2022 (US$ Bn)
TABLE 90 United States RF-over-fiber Market, by Frequency Band, 2023-2030 (US$ Bn)
TABLE 91 United States RF-over-fiber Market, by Vertical, 2017-2022 (US$ Bn)
TABLE 92 United States RF-over-fiber Market, by Vertical, 2023-2030 (US$ Bn)
TABLE 93 United States RF-over-fiber Market, by Frequency Range, 2017-2022 (US$ Bn)
TABLE 94 United States RF-over-fiber Market, by Frequency Range, 2023-2030 (US$ Bn)
TABLE 95 United States RF-over-fiber Market, by Organization Size, 2017-2022 (US$ Bn)
TABLE 96 United States RF-over-fiber Market, by Organization Size, 2023-2030 (US$ Bn)
TABLE 97 United States RF-over-fiber Market, by Application, 2017-2022 (US$ Bn)
TABLE 98 United States RF-over-fiber Market, by Application, 2023-2030 (US$ Bn)
TABLE 99 Canada RF-over-fiber Market, by Modules, 2017-2022 (US$ Bn)
TABLE 100 Canada RF-over-fiber Market, by Modules, 2023-2030 (US$ Bn)
TABLE 101 Canada RF-over-fiber Market, by Frequency Band, 2017-2022 (US$ Bn)
TABLE 102 Canada RF-over-fiber Market, by Frequency Band, 2023-2030 (US$ Bn)
TABLE 103 Canada RF-over-fiber Market, by Vertical, 2017-2022 (US$ Bn)
TABLE 104 Canada RF-over-fiber Market, by Vertical, 2023-2030 (US$ Bn)
TABLE 105 Canada RF-over-fiber Market, by Frequency Range, 2017-2022 (US$ Bn)
TABLE 106 Canada RF-over-fiber Market, by Frequency Range, 2023-2030 (US$ Bn)
TABLE 107 Canada RF-over-fiber Market, by Organization Size, 2017-2022 (US$ Bn)
TABLE 108 Canada RF-over-fiber Market, by Organization Size, 2023-2030 (US$ Bn)
TABLE 109 Canada RF-over-fiber Market, by Application, 2017-2022 (US$ Bn)
TABLE 110 Canada RF-over-fiber Market, by Application, 2023-2030 (US$ Bn)
TABLE 111 Mexico RF-over-fiber Market, by Modules, 2017-2022 (US$ Bn)
TABLE 112 Mexico RF-over-fiber Market, by Modules, 2023-2030 (US$ Bn)
TABLE 113 Mexico RF-over-fiber Market, by Frequency Band, 2017-2022 (US$ Bn)
TABLE 114 Mexico RF-over-fiber Market, by Frequency Band, 2023-2030 (US$ Bn)
TABLE 115 Mexico RF-over-fiber Market, by Vertical, 2017-2022 (US$ Bn)
TABLE 116 Mexico RF-over-fiber Market, by Vertical, 2023-2030 (US$ Bn)
TABLE 117 Mexico RF-over-fiber Market, by Frequency Range, 2017-2022 (US$ Bn)
TABLE 118 Mexico RF-over-fiber Market, by Frequency Range, 2023-2030 (US$ Bn)
TABLE 119 Mexico RF-over-fiber Market, by Organization Size, 2017-2022 (US$ Bn)
TABLE 120 Mexico RF-over-fiber Market, by Organization Size, 2023-2030 (US$ Bn)
TABLE 121 Mexico RF-over-fiber Market, by Application, 2017-2022 (US$ Bn)
TABLE 122 Mexico RF-over-fiber Market, by Application, 2023-2030 (US$ Bn)
TABLE 123 Europe RF-over-fiber Market, by Modules, 2017-2022 (US$ Bn)
TABLE 124 Europe RF-over-fiber Market, by Modules, 2023-2030 (US$ Bn)
TABLE 125 Europe RF-over-fiber Market, by Frequency Band, 2017-2022 (US$ Bn)
TABLE 126 Europe RF-over-fiber Market, by Frequency Band, 2023-2030 (US$ Bn)
TABLE 127 Europe RF-over-fiber Market, by Vertical, 2017-2022 (US$ Bn)
TABLE 128 Europe RF-over-fiber Market, by Vertical, 2023-2030 (US$ Bn)
TABLE 129 Europe RF-over-fiber Market, by Frequency Range, 2017-2022 (US$ Bn)
TABLE 130 Europe RF-over-fiber Market, by Frequency Range, 2023-2030 (US$ Bn)
TABLE 131 Europe RF-over-fiber Market, by Organization Size, 2017-2022 (US$ Bn)
TABLE 132 Europe RF-over-fiber Market, by Organization Size, 2023-2030 (US$ Bn)
TABLE 133 Europe RF-over-fiber Market, by Application, 2017-2022 (US$ Bn)
TABLE 134 Europe RF-over-fiber Market, by Application, 2023-2030 (US$ Bn)
TABLE 135 Europe RF-over-fiber Market, by Country, 2017-2022 (US$ Bn)
TABLE 136 Europe RF-over-fiber Market, by Country, 2023-2030 (US$ Bn)
TABLE 137 Germany RF-over-fiber Market, by Modules, 2017-2022 (US$ Bn)
TABLE 138 Germany RF-over-fiber Market, by Modules, 2023-2030 (US$ Bn)
TABLE 139 Germany RF-over-fiber Market, by Frequency Band, 2017-2022 (US$ Bn)
TABLE 140 Germany RF-over-fiber Market, by Frequency Band, 2023-2030 (US$ Bn)
TABLE 141 Germany RF-over-fiber Market, by Vertical, 2017-2022 (US$ Bn)
TABLE 142 Germany RF-over-fiber Market, by Vertical, 2023-2030 (US$ Bn)
TABLE 143 Germany RF-over-fiber Market, by Frequency Range, 2017-2022 (US$ Bn)
TABLE 144 Germany RF-over-fiber Market, by Frequency Range, 2023-2030 (US$ Bn)
TABLE 145 Germany RF-over-fiber Market, by Organization Size, 2017-2022 (US$ Bn)
TABLE 146 Germany RF-over-fiber Market, by Organization Size, 2023-2030 (US$ Bn)
TABLE 147 Germany RF-over-fiber Market, by Application, 2017-2022 (US$ Bn)
TABLE 148 Germany RF-over-fiber Market, by Application, 2023-2030 (US$ Bn)
TABLE 149 France RF-over-fiber Market, by Modules, 2017-2022 (US$ Bn)
TABLE 150 France RF-over-fiber Market, by Modules, 2023-2030 (US$ Bn)
TABLE 151 France RF-over-fiber Market, by Frequency Band, 2017-2022 (US$ Bn)
TABLE 152 France RF-over-fiber Market, by Frequency Band, 2023-2030 (US$ Bn)
TABLE 153 France RF-over-fiber Market, by Vertical, 2017-2022 (US$ Bn)
TABLE 154 France RF-over-fiber Market, by Vertical, 2023-2030 (US$ Bn)
TABLE 155 France RF-over-fiber Market, by Frequency Range, 2017-2022 (US$ Bn)
TABLE 156 France RF-over-fiber Market, by Frequency Range, 2023-2030 (US$ Bn)
TABLE 157 France RF-over-fiber Market, by Organization Size, 2017-2022 (US$ Bn)
TABLE 158 France RF-over-fiber Market, by Organization Size, 2023-2030 (US$ Bn)
TABLE 159 France RF-over-fiber Market, by Application, 2017-2022 (US$ Bn)
TABLE 160 France RF-over-fiber Market, by Application, 2023-2030 (US$ Bn)
TABLE 161 United Kingdom RF-over-fiber Market, by Modules, 2017-2022 (US$ Bn)
TABLE 162 United Kingdom RF-over-fiber Market, by Modules, 2023-2030 (US$ Bn)
TABLE 163 United Kingdom RF-over-fiber Market, by Frequency Band, 2017-2022 (US$ Bn)
TABLE 164 United Kingdom RF-over-fiber Market, by Frequency Band, 2023-2030 (US$ Bn)
TABLE 165 United Kingdom RF-over-fiber Market, by Vertical, 2017-2022 (US$ Bn)
TABLE 166 United Kingdom RF-over-fiber Market, by Vertical, 2023-2030 (US$ Bn)
TABLE 167 United Kingdom RF-over-fiber Market, by Frequency Range, 2017-2022 (US$ Bn)
TABLE 168 United Kingdom RF-over-fiber Market, by Frequency Range, 2023-2030 (US$ Bn)
TABLE 169 United Kingdom RF-over-fiber Market, by Organization Size, 2017-2022 (US$ Bn)
TABLE 170 United Kingdom RF-over-fiber Market, by Organization Size, 2023-2030 (US$ Bn)
TABLE 171 United Kingdom RF-over-fiber Market, by Application, 2017-2022 (US$ Bn)
TABLE 172 United Kingdom RF-over-fiber Market, by Application, 2023-2030 (US$ Bn)
TABLE 173 Italy RF-over-fiber Market, by Modules, 2017-2022 (US$ Bn)
TABLE 174 Italy RF-over-fiber Market, by Modules, 2023-2030 (US$ Bn)
TABLE 175 Italy RF-over-fiber Market, by Frequency Band, 2017-2022 (US$ Bn)
TABLE 176 Italy RF-over-fiber Market, by Frequency Band, 2023-2030 (US$ Bn)
TABLE 177 Italy RF-over-fiber Market, by Vertical, 2017-2022 (US$ Bn)
TABLE 178 Italy RF-over-fiber Market, by Vertical, 2023-2030 (US$ Bn)
TABLE 179 Italy RF-over-fiber Market, by Frequency Range, 2017-2022 (US$ Bn)
TABLE 180 Italy RF-over-fiber Market, by Frequency Range, 2023-2030 (US$ Bn)
TABLE 181 Italy RF-over-fiber Market, by Organization Size, 2017-2022 (US$ Bn)
TABLE 182 Italy RF-over-fiber Market, by Organization Size, 2023-2030 (US$ Bn)
TABLE 183 Italy RF-over-fiber Market, by Application, 2017-2022 (US$ Bn)
TABLE 184 Italy RF-over-fiber Market, by Application, 2023-2030 (US$ Bn)
TABLE 185 Spain RF-over-fiber Market, by Modules, 2017-2022 (US$ Bn)
TABLE 186 Spain RF-over-fiber Market, by Modules, 2023-2030 (US$ Bn)
TABLE 187 Spain RF-over-fiber Market, by Frequency Band, 2017-2022 (US$ Bn)
TABLE 188 Spain RF-over-fiber Market, by Frequency Band, 2023-2030 (US$ Bn)
TABLE 189 Spain RF-over-fiber Market, by Vertical, 2017-2022 (US$ Bn)
TABLE 190 Spain RF-over-fiber Market, by Vertical, 2023-2030 (US$ Bn)
TABLE 191 Spain RF-over-fiber Market, by Frequency Range, 2017-2022 (US$ Bn)
TABLE 192 Spain RF-over-fiber Market, by Frequency Range, 2023-2030 (US$ Bn)
TABLE 193 Spain RF-over-fiber Market, by Organization Size, 2017-2022 (US$ Bn)
TABLE 194 Spain RF-over-fiber Market, by Organization Size, 2023-2030 (US$ Bn)
TABLE 195 Spain RF-over-fiber Market, by Application, 2017-2022 (US$ Bn)
TABLE 196 Spain RF-over-fiber Market, by Application, 2023-2030 (US$ Bn)
TABLE 197 Rest of Europe RF-over-fiber Market, by Modules, 2017-2022 (US$ Bn)
TABLE 198 Rest of Europe RF-over-fiber Market, by Modules, 2023-2030 (US$ Bn)
TABLE 199 Rest of Europe RF-over-fiber Market, by Frequency Band, 2017-2022 (US$ Bn)
TABLE 200 Rest of Europe RF-over-fiber Market, by Frequency Band, 2023-2030 (US$ Bn)
TABLE 201 Rest of Europe RF-over-fiber Market, by Vertical, 2017-2022 (US$ Bn)
TABLE 202 Rest of Europe RF-over-fiber Market, by Vertical, 2023-2030 (US$ Bn)
TABLE 203 Rest of Europe RF-over-fiber Market, by Frequency Range, 2017-2022 (US$ Bn)
TABLE 204 Rest of Europe RF-over-fiber Market, by Frequency Range, 2023-2030 (US$ Bn)
TABLE 205 Rest of Europe RF-over-fiber Market, by Organization Size, 2017-2022 (US$ Bn)
TABLE 206 Rest of Europe RF-over-fiber Market, by Organization Size, 2023-2030 (US$ Bn)
TABLE 207 Rest of Europe RF-over-fiber Market, by Application, 2017-2022 (US$ Bn)
TABLE 208 Rest of Europe RF-over-fiber Market, by Application, 2023-2030 (US$ Bn)
TABLE 209 Asia Pacific RF-over-fiber Market, by Modules, 2017-2022 (US$ Bn)
TABLE 210 Asia Pacific RF-over-fiber Market, by Modules, 2023-2030 (US$ Bn)
TABLE 211 Asia Pacific RF-over-fiber Market, by Frequency Band, 2017-2022 (US$ Bn)
TABLE 212 Asia Pacific RF-over-fiber Market, by Frequency Band, 2023-2030 (US$ Bn)
TABLE 213 Asia Pacific RF-over-fiber Market, by Vertical, 2017-2022 (US$ Bn)
TABLE 214 Asia Pacific RF-over-fiber Market, by Vertical, 2023-2030 (US$ Bn)
TABLE 215 Asia Pacific RF-over-fiber Market, by Frequency Range, 2017-2022 (US$ Bn)
TABLE 216 Asia Pacific RF-over-fiber Market, by Frequency Range, 2023-2030 (US$ Bn)
TABLE 217 Asia Pacific RF-over-fiber Market, by Organization Size, 2017-2022 (US$ Bn)
TABLE 218 Asia Pacific RF-over-fiber Market, by Organization Size, 2023-2030 (US$ Bn)
TABLE 219 Asia Pacific RF-over-fiber Market, by Application, 2017-2022 (US$ Bn)
TABLE 220 Asia Pacific RF-over-fiber Market, by Application, 2023-2030 (US$ Bn)
TABLE 221 China RF-over-fiber Market, by Modules, 2017-2022 (US$ Bn)
TABLE 222 China RF-over-fiber Market, by Modules, 2023-2030 (US$ Bn)
TABLE 223 China RF-over-fiber Market, by Frequency Band, 2017-2022 (US$ Bn)
TABLE 224 China RF-over-fiber Market, by Frequency Band, 2023-2030 (US$ Bn)
TABLE 225 China RF-over-fiber Market, by Vertical, 2017-2022 (US$ Bn)
TABLE 226 China RF-over-fiber Market, by Vertical, 2023-2030 (US$ Bn)
TABLE 227 China RF-over-fiber Market, by Frequency Range, 2017-2022 (US$ Bn)
TABLE 228 China RF-over-fiber Market, by Frequency Range, 2023-2030 (US$ Bn)
TABLE 229 China RF-over-fiber Market, by Organization Size, 2017-2022 (US$ Bn)
TABLE 230 China RF-over-fiber Market, by Organization Size, 2023-2030 (US$ Bn)
TABLE 231 China RF-over-fiber Market, by Application, 2017-2022 (US$ Bn)
TABLE 232 China RF-over-fiber Market, by Application, 2023-2030 (US$ Bn)
TABLE 233 Japan RF-over-fiber Market, by Modules, 2017-2022 (US$ Bn)
TABLE 234 Japan RF-over-fiber Market, by Modules, 2023-2030 (US$ Bn)
TABLE 235 Japan RF-over-fiber Market, by Frequency Band, 2017-2022 (US$ Bn)
TABLE 236 Japan RF-over-fiber Market, by Frequency Band, 2023-2030 (US$ Bn)
TABLE 237 Japan RF-over-fiber Market, by Vertical, 2017-2022 (US$ Bn)
TABLE 238 Japan RF-over-fiber Market, by Vertical, 2023-2030 (US$ Bn)
TABLE 239 Japan RF-over-fiber Market, by Frequency Range, 2017-2022 (US$ Bn)
TABLE 240 Japan RF-over-fiber Market, by Frequency Range, 2023-2030 (US$ Bn)
TABLE 241 Japan RF-over-fiber Market, by Organization Size, 2017-2022 (US$ Bn)
TABLE 242 Japan RF-over-fiber Market, by Organization Size, 2023-2030 (US$ Bn)
TABLE 243 Japan RF-over-fiber Market, by Application, 2017-2022 (US$ Bn)
TABLE 244 Japan RF-over-fiber Market, by Application, 2023-2030 (US$ Bn)
TABLE 245 India RF-over-fiber Market, by Modules, 2017-2022 (US$ Bn)
TABLE 246 India RF-over-fiber Market, by Modules, 2023-2030 (US$ Bn)
TABLE 247 India RF-over-fiber Market, by Frequency Band, 2017-2022 (US$ Bn)
TABLE 248 India RF-over-fiber Market, by Frequency Band, 2023-2030 (US$ Bn)
TABLE 249 India RF-over-fiber Market, by Vertical, 2017-2022 (US$ Bn)
TABLE 250 India RF-over-fiber Market, by Vertical, 2023-2030 (US$ Bn)
TABLE 251 India RF-over-fiber Market, by Frequency Range, 2017-2022 (US$ Bn)
TABLE 252 India RF-over-fiber Market, by Frequency Range, 2023-2030 (US$ Bn)
TABLE 253 India RF-over-fiber Market, by Organization Size, 2017-2022 (US$ Bn)
TABLE 254 India RF-over-fiber Market, by Organization Size, 2023-2030 (US$ Bn)
TABLE 255 India RF-over-fiber Market, by Application, 2017-2022 (US$ Bn)
TABLE 256 India RF-over-fiber Market, by Application, 2023-2030 (US$ Bn)
TABLE 257 South Korea RF-over-fiber Market, by Modules, 2017-2022 (US$ Bn)
TABLE 258 South Korea RF-over-fiber Market, by Modules, 2023-2030 (US$ Bn)
TABLE 259 South Korea RF-over-fiber Market, by Frequency Band, 2017-2022 (US$ Bn)
TABLE 260 South Korea RF-over-fiber Market, by Frequency Band, 2023-2030 (US$ Bn)
TABLE 261 South Korea RF-over-fiber Market, by Vertical, 2017-2022 (US$ Bn)
TABLE 262 South Korea RF-over-fiber Market, by Vertical, 2023-2030 (US$ Bn)
TABLE 263 South Korea RF-over-fiber Market, by Frequency Range, 2017-2022 (US$ Bn)
TABLE 264 South Korea RF-over-fiber Market, by Frequency Range, 2023-2030 (US$ Bn)
TABLE 265 South Korea RF-over-fiber Market, by Organization Size, 2017-2022 (US$ Bn)
TABLE 266 South Korea RF-over-fiber Market, by Organization Size, 2023-2030 (US$ Bn)
TABLE 267 South Korea RF-over-fiber Market, by Application, 2017-2022 (US$ Bn)
TABLE 268 South Korea RF-over-fiber Market, by Application, 2023-2030 (US$ Bn)
TABLE 269 South-East Asia RF-over-fiber Market, by Modules, 2017-2022 (US$ Bn)
TABLE 270 South-East Asia RF-over-fiber Market, by Modules, 2023-2030 (US$ Bn)
TABLE 271 South-East Asia RF-over-fiber Market, by Frequency Band, 2017-2022 (US$ Bn)
TABLE 272 South-East Asia RF-over-fiber Market, by Frequency Band, 2023-2030 (US$ Bn)
TABLE 273 South-East Asia RF-over-fiber Market, by Vertical, 2017-2022 (US$ Bn)
TABLE 274 South-East Asia RF-over-fiber Market, by Vertical, 2023-2030 (US$ Bn)
TABLE 275 South East Asia RF-over-fiber Market, by Frequency Range, 2017-2022 (US$ Bn)
TABLE 276 South East Asia RF-over-fiber Market, by Frequency Range, 2023-2030 (US$ Bn)
TABLE 277 South East Asia RF-over-fiber Market, by Organization Size, 2017-2022 (US$ Bn)
TABLE 278 South East Asia RF-over-fiber Market, by Organization Size, 2023-2030 (US$ Bn)
TABLE 279 South East Asia RF-over-fiber Market, by Application, 2017-2022 (US$ Bn)
TABLE 280 South East Asia RF-over-fiber Market, by Application, 2023-2030 (US$ Bn)
TABLE 281 Rest of Asia Pacific RF-over-fiber Market, by Modules, 2017-2022 (US$ Bn)
TABLE 282 Rest of Asia Pacific RF-over-fiber Market, by Modules, 2023-2030 (US$ Bn)
TABLE 283 Rest of Asia Pacific RF-over-fiber Market, by Frequency Band, 2017-2022 (US$ Bn)
TABLE 284 Rest of Asia Pacific RF-over-fiber Market, by Frequency Band, 2023-2030 (US$ Bn)
TABLE 285 Rest of Asia Pacific RF-over-fiber Market, by Vertical, 2017-2022 (US$ Bn)
TABLE 286 Rest of Asia Pacific RF-over-fiber Market, by Vertical, 2023-2030 (US$ Bn)
TABLE 287 Rest of Asia Pacific RF-over-fiber Market, by Frequency Range, 2017-2022 (US$ Bn)
TABLE 288 Rest of Asia Pacific RF-over-fiber Market, by Frequency Range, 2023-2030 (US$ Bn)
TABLE 289 Rest of Asia Pacific RF-over-fiber Market, by Organization Size, 2017-2022 (US$ Bn)
TABLE 290 Rest of Asia Pacific RF-over-fiber Market, by Organization Size, 2023-2030 (US$ Bn)
TABLE 291 Rest of Asia Pacific RF-over-fiber Market, by Application, 2017-2022 (US$ Bn)
TABLE 292 Rest of Asia Pacific RF-over-fiber Market, by Application, 2023-2030 (US$ Bn)
TABLE 293 Latin America RF-over-fiber Market, by Modules, 2017-2022 (US$ Bn)
TABLE 294 Latin America RF-over-fiber Market, by Modules, 2023-2030 (US$ Bn)
TABLE 295 Latin America RF-over-fiber Market, by Frequency Band, 2017-2022 (US$ Bn)
TABLE 296 Latin America RF-over-fiber Market, by Frequency Band, 2023-2030 (US$ Bn)
TABLE 297 Latin America RF-over-fiber Market, by Vertical, 2017-2022 (US$ Bn)
TABLE 298 Latin America RF-over-fiber Market, by Vertical, 2023-2030 (US$ Bn)
TABLE 299 Latin America RF-over-fiber Market, by Frequency Range, 2017-2022 (US$ Bn)
TABLE 300 Latin America RF-over-fiber Market, by Frequency Range, 2023-2030 (US$ Bn)
TABLE 301 Latin America RF-over-fiber Market, by Organization Size, 2017-2022 (US$ Bn)
TABLE 302 Latin America RF-over-fiber Market, by Organization Size, 2023-2030 (US$ Bn)
TABLE 303 Latin America RF-over-fiber Market, by Application, 2017-2022 (US$ Bn)
TABLE 304 Latin America RF-over-fiber Market, by Application, 2023-2030 (US$ Bn)
TABLE 305 Brazil RF-over-fiber Market, by Modules, 2017-2022 (US$ Bn)
TABLE 306 Brazil RF-over-fiber Market, by Modules, 2023-2030 (US$ Bn)
TABLE 307 Brazil RF-over-fiber Market, by Frequency Band, 2017-2022 (US$ Bn)
TABLE 308 Brazil RF-over-fiber Market, by Frequency Band, 2023-2030 (US$ Bn)
TABLE 309 Brazil RF-over-fiber Market, by Vertical, 2017-2022 (US$ Bn)
TABLE 310 Brazil RF-over-fiber Market, by Vertical, 2023-2030 (US$ Bn)
TABLE 311 Brazil RF-over-fiber Market, by Frequency Range, 2017-2022 (US$ Bn)
TABLE 312 Brazil RF-over-fiber Market, by Frequency Range, 2023-2030 (US$ Bn)
TABLE 313 Brazil RF-over-fiber Market, by Organization Size, 2017-2022 (US$ Bn)
TABLE 314 Brazil RF-over-fiber Market, by Organization Size, 2023-2030 (US$ Bn)
TABLE 315 Brazil RF-over-fiber Market, by Application, 2017-2022 (US$ Bn)
TABLE 316 Brazil RF-over-fiber Market, by Application, 2023-2030 (US$ Bn)
TABLE 317 Argentina RF-over-fiber Market, by Modules, 2017-2022 (US$ Bn)
TABLE 318 Argentina RF-over-fiber Market, by Modules, 2023-2030 (US$ Bn)
TABLE 319 Argentina RF-over-fiber Market, by Frequency Band, 2017-2022 (US$ Bn)
TABLE 320 Argentina RF-over-fiber Market, by Frequency Band, 2023-2030 (US$ Bn)
TABLE 321 Argentina RF-over-fiber Market, by Vertical, 2017-2022 (US$ Bn)
TABLE 322 Argentina RF-over-fiber Market, by Vertical, 2023-2030 (US$ Bn)
TABLE 323 Argentina RF-over-fiber Market, by Frequency Range, 2017-2022 (US$ Bn)
TABLE 324 Argentina RF-over-fiber Market, by Frequency Range, 2023-2030 (US$ Bn)
TABLE 325 Argentina RF-over-fiber Market, by Organization Size, 2017-2022 (US$ Bn)
TABLE 326 Argentina RF-over-fiber Market, by Organization Size, 2023-2030 (US$ Bn)
TABLE 327 Argentina RF-over-fiber Market, by Application, 2017-2022 (US$ Bn)
TABLE 328 Argentina RF-over-fiber Market, by Application, 2023-2030 (US$ Bn)
TABLE 329 Rest of Latin America RF-over-fiber Market, by Modules, 2017-2022 (US$ Bn)
TABLE 330 Rest of Latin America RF-over-fiber Market, by Modules, 2023-2030 (US$ Bn)
TABLE 331 Rest of Latin America RF-over-fiber Market, by Frequency Band, 2017-2022 (US$ Bn)
TABLE 332 Rest of Latin America RF-over-fiber Market, by Frequency Band, 2023-2030 (US$ Bn)
TABLE 333 Rest of Latin America RF-over-fiber Market, by Vertical, 2017-2022 (US$ Bn)
TABLE 334 Rest of Latin America RF-over-fiber Market, by Vertical, 2023-2030 (US$ Bn)
TABLE 335 Rest of Latin America RF-over-fiber Market, by Frequency Range, 2017-2022 (US$ Bn)
TABLE 336 Rest of Latin America RF-over-fiber Market, by Frequency Range, 2023-2030 (US$ Bn)
TABLE 337 Rest of Latin America RF-over-fiber Market, by Organization Size, 2017-2022 (US$ Bn)
TABLE 338 Rest of Latin America RF-over-fiber Market, by Organization Size, 2023-2030 (US$ Bn)
TABLE 339 Rest of Latin America RF-over-fiber Market, by Application, 2017-2022 (US$ Bn)
TABLE 340 Rest of Latin America RF-over-fiber Market, by Application, 2023-2030 (US$ Bn)
TABLE 341 Middle East and Africa RF-over-fiber Market, by Modules, 2017-2022 (US$ Bn)
TABLE 342 Middle East and Africa RF-over-fiber Market, by Modules, 2023-2030 (US$ Bn)
TABLE 343 Middle East and Africa RF-over-fiber Market, by Frequency Band, 2017-2022 (US$ Bn)
TABLE 344 Middle East and Africa RF-over-fiber Market, by Frequency Band, 2023-2030 (US$ Bn)
TABLE 345 Middle East and Africa RF-over-fiber Market, by Vertical, 2017-2022 (US$ Bn)
TABLE 346 Middle East and Africa RF-over-fiber Market, by Vertical, 2023-2030 (US$ Bn)
TABLE 347 Middle East and Africa RF-over-fiber Market, by Frequency Range, 2017-2022 (US$ Bn)
TABLE 348 Middle East and Africa RF-over-fiber Market, by Frequency Range, 2023-2030 (US$ Bn)
TABLE 349 Middle East and Africa RF-over-fiber Market, by Organization Size, 2017-2022 (US$ Bn)
TABLE 350 Middle East and Africa RF-over-fiber Market, by Organization Size, 2023-2030 (US$ Bn)
TABLE 351 Middle East and Africa RF-over-fiber Market, by Application, 2017-2022 (US$ Bn)
TABLE 352 Middle East and Africa RF-over-fiber Market, by Application, 2023-2030 (US$ Bn)
TABLE 353 GCC Countries RF-over-fiber Market, by Modules, 2017-2022 (US$ Bn)
TABLE 354 GCC Countries RF-over-fiber Market, by Modules, 2023-2030 (US$ Bn)
TABLE 355 GCC Countries RF-over-fiber Market, by Frequency Band, 2017-2022 (US$ Bn)
TABLE 356 GCC Countries RF-over-fiber Market, by Frequency Band, 2023-2030 (US$ Bn)
TABLE 357 GCC Countries RF-over-fiber Market, by Vertical, 2017-2022 (US$ Bn)
TABLE 358 GCC Countries RF-over-fiber Market, by Vertical, 2023-2030 (US$ Bn)
TABLE 359 GCC Countries RF-over-fiber Market, by Frequency Range, 2017-2022 (US$ Bn)
TABLE 360 GCC Countries RF-over-fiber Market, by Frequency Range, 2023-2030 (US$ Bn)
TABLE 361 GCC Countries RF-over-fiber Market, by Organization Size, 2017-2022 (US$ Bn)
TABLE 362 GCC Countries RF-over-fiber Market, by Organization Size, 2023-2030 (US$ Bn)
TABLE 363 GCC Countries RF-over-fiber Market, by Application, 2017-2022 (US$ Bn)
TABLE 364 GCC Countries RF-over-fiber Market, by Application, 2023-2030 (US$ Bn)
TABLE 365 South Africa RF-over-fiber Market, by Modules, 2017-2022 (US$ Bn)
TABLE 366 South Africa RF-over-fiber Market, by Modules, 2023-2030 (US$ Bn)
TABLE 367 South Africa RF-over-fiber Market, by Frequency Band, 2017-2022 (US$ Bn)
TABLE 368 South Africa RF-over-fiber Market, by Frequency Band, 2023-2030 (US$ Bn)
TABLE 369 South Africa RF-over-fiber Market, by Vertical, 2017-2022 (US$ Bn)
TABLE 370 South Africa RF-over-fiber Market, by Vertical, 2023-2030 (US$ Bn)
TABLE 371 South Africa RF-over-fiber Market, by Frequency Range, 2017-2022 (US$ Bn)
TABLE 372 South Africa RF-over-fiber Market, by Frequency Range, 2023-2030 (US$ Bn)
TABLE 373 South Africa RF-over-fiber Market, by Organization Size, 2017-2022 (US$ Bn)
TABLE 374 South Africa RF-over-fiber Market, by Organization Size, 2023-2030 (US$ Bn)
TABLE 375 South Africa RF-over-fiber Market, by Application, 2017-2022 (US$ Bn)
TABLE 376 South Africa RF-over-fiber Market, by Application, 2023-2030 (US$ Bn)
TABLE 377 Rest of Middle East and Africa RF-over-fiber Market, by Modules, 2017-2022 (US$ Bn)
TABLE 378 Rest of Middle East and Africa RF-over-fiber Market, by Modules, 2023-2030 (US$ Bn)
TABLE 379 Rest of Middle East and Africa RF-over-fiber Market, by Frequency Band, 2017-2022 (US$ Bn)
TABLE 380 Rest of Middle East and Africa RF-over-fiber Market, by Frequency Band, 2023-2030 (US$ Bn)
TABLE 381 Rest of Middle East and Africa RF-over-fiber Market, by Vertical, 2017-2022 (US$ Bn)
TABLE 382 Rest of Middle East and Africa RF-over-fiber Market, by Vertical, 2023-2030 (US$ Bn)
TABLE 383 Rest of Middle East and Africa RF-over-fiber Market, by Frequency Range, 2017-2022 (US$ Bn)
TABLE 384 Rest of Middle East and Africa RF-over-fiber Market, by Frequency Range, 2023-2030 (US$ Bn)
TABLE 385 Rest of Middle East and Africa RF-over-fiber Market, by Organization Size, 2017-2022 (US$ Bn)
TABLE 386 Rest of Middle East and Africa RF-over-fiber Market, by Organization Size, 2023-2030 (US$ Bn)
TABLE 387 Rest of Middle East and Africa RF-over-fiber Market, by Application, 2017-2022 (US$ Bn)
TABLE 388 Rest of Middle East and Africa RF-over-fiber Market, by Application, 2023-2030 (US$ Bn)

Frequently Asked Questions

What is the current size of the global RF-over-fiber market?

The global RF-over-fiber market was valued at USD 0.55 Billion in 2022.

What is the expected growth rate of the RF-over-fiber market between 2023 and 2030?

The RF-over-fiber market is expected to grow at a CAGR of 10.50% between 2023 and 2030, reaching USD 1.11 Billion in 2030.

Which segment is leading the market share in terms of modules?

Transceivers is the leading segment by module, holding over 43% share in value in 2022.

Which frequency band segment governs the demand for RF-over-fibers in the world?

The L band segment governs the demand for RF over-fibers globally, holding a massive share of over 80% in 2022.

Which segment is expected to post the highest CAGR during the forecast period?

The civil segment is expected to post the highest CAGR during the forecast period.

Which region is fueling the growth of the RF-over-fiber industry?

Asia Pacific is fueling the growth of the RF-over-fiber industry, with an over one-third share in 2022.

Who are the major players in the global RF-over-fiber market?

The top players include Broadcom, EMCORE Corporation, APIC Corporation, Optical Zonu Corp, Gooch & Housego PLC, ViaLite, Global Invacom, HUBER+SUHNER, Glenair, SEIKOH GIKEN CO., LTD., II-VI Incorporated, DEV Systemtechnik GmbH, Octane Wireless, Syntonics LLC, Intelibs, Inc., ETL Systems Ltd, Narda-MITEQ, Olabs Technology Company Limited, RFOptic Ltd., Elkay, MicroComp Nordic AB, Microwave Photonic Systems, Inc., among others.

What are the major market drivers of the RF-over-fiber industry?

The major market drivers are the telecommunications sector is propelled by rising demand for broadband services and big data management. The number of linked devices is steadily increasing with the increase in device connectivity and usage. In the world’s developing economies, the telecommunications business is expanding quickly.

What are the major market restraints of the RF-over-fiber industry?

The major market restraints are the expensive initial investment needed to create the infrastructure, which can impact consumer spending and may hamper the market.

What are the major market opportunities of the RF-over-fiber industry?

The incorporation of the expanding 5G and 6G infrastructure globally and the growing demand for RFOF in defense applications are the major opportunities in the RF-over-fiber industry.

Asia Pacific Next Generation Data Storage Market

Published:
Report ID: 35723

Fingerprint Sensor Market

Published:
Report ID: 34098

Unified Communication Market

Published:
Report ID: 11005

Single-Mode Fiber Cable Market

Published:
Report ID: 33075

Land Mobile Radio (LMR) Systems Market

Published:
Report ID: 8017

Switchgear Monitoring System Market

Published:
Report ID: 33284

Email Encryption Market

Published:
Report ID: 6059

Corporate Training Market

Published:
Report ID: 24076

Mobile Wallet And Payment Market

Published:
Report ID: 23434

Predictive Maintenance Market

Published:
Report ID: 11112

Data Science And Predictive Analytics Market

Published:
Report ID: 19989

Purchase Options

$2999
Delivery Format: Excel.
$4999
Designed for the individual purchaser.
$6999
Users located at a single corporate site or regional office.
$7999
Allowed for unlimited sharing globally within one company.
Smallform of Sample request

Have a question?

User Profile

Don’t settle for less – trust Mitul to help you find the best solution.

Report delivery within 24 to 48 hours

– Other Info –

What people say?-

User Review

I am very impressed with the information in this report. The author clearly did their research when they came up with this product and it has already given me a lot of ideas.

Jana Schmidt
CEDAR CX Technologies

– Connect with us –

Phone

+91 6232 49 3207


support

24/7 Research Support


sales@credenceresearch.com

– Research Methodology –

Going beyond the basics: advanced techniques in research methodology

– Trusted By –

Pepshi, LG, Nestle
Motorola, Honeywell, Johnson and johnson
LG Chem, SIEMENS, Pfizer
Unilever, Samsonite, QIAGEN