
Dung moves from farm waste to fuel and fertilizer input
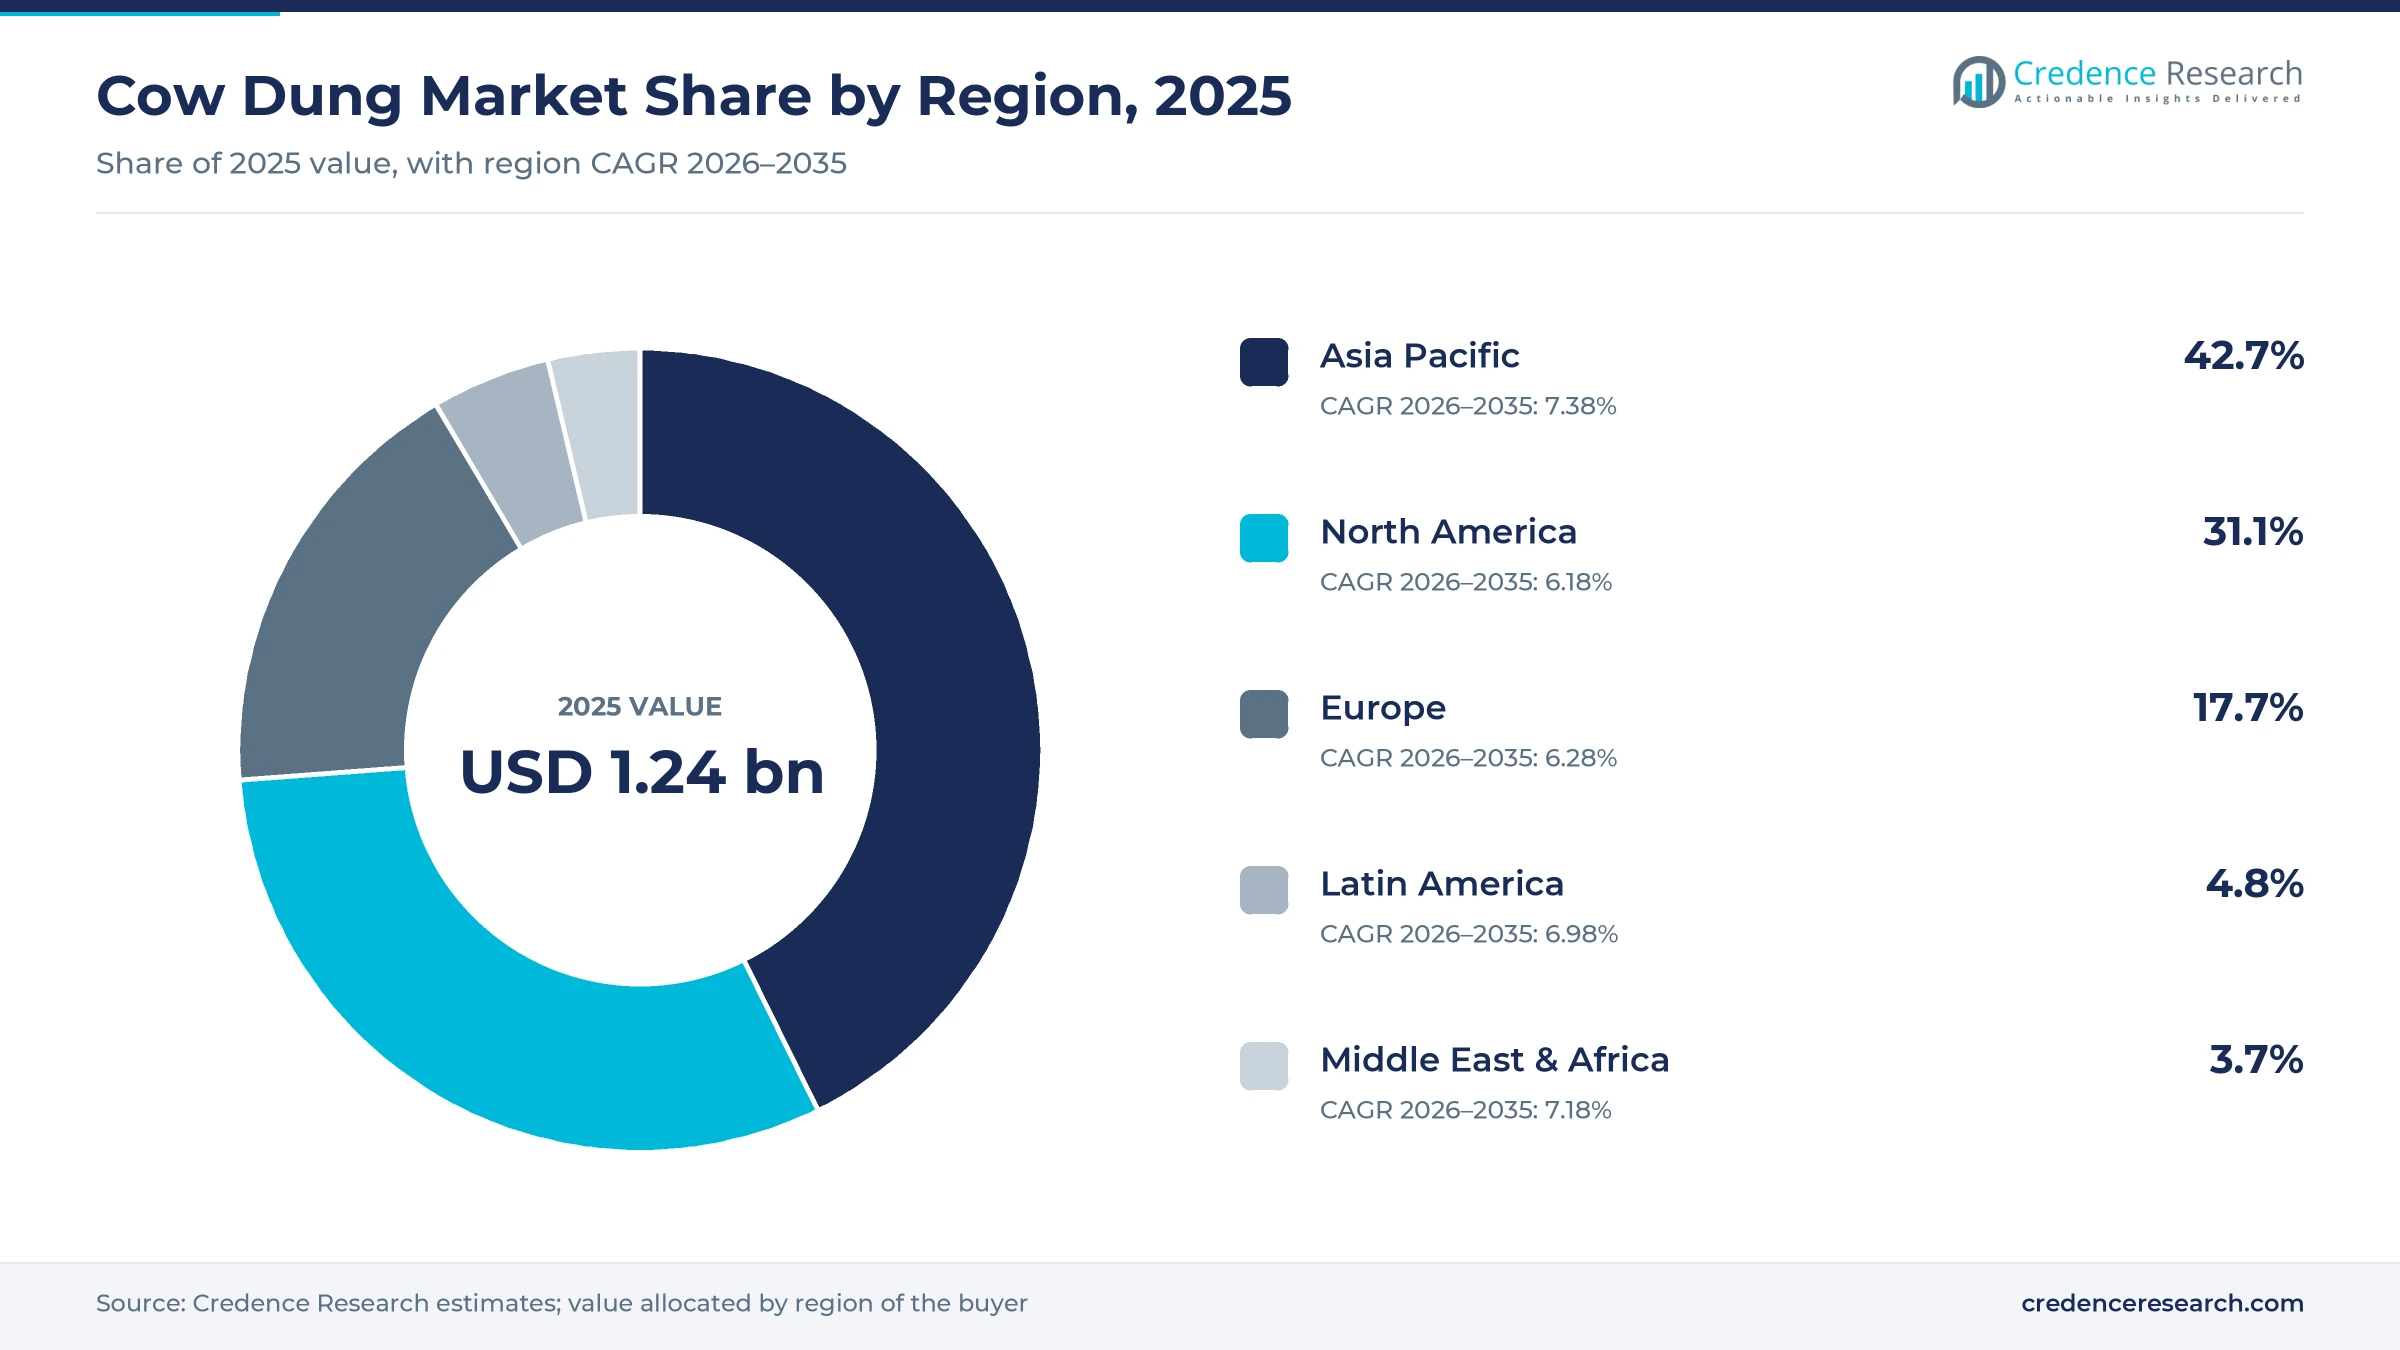
The global cow dung market was valued at USD 1.24 billion in 2025 and is projected to increase from USD 1.33 billion in 2026 to USD 2.40 billion by 2035, registering a CAGR of 6.80% during 2026–2035. Demand comes from farmers who spread or buy composted manure, from biogas and compressed biogas plants that pay for dung as feedstock, and from households and makers of cakes, powder, paint and incense. Asia Pacific held the largest regional share, 42.7% in 2025, because India, China and Pakistan keep large cattle herds and India funds village biogas plants. Asia Pacific is also the fastest-growing region at 7.38% a year, as dairy cooperatives in Gujarat open plants that buy dung from member farmers. The main regulatory change is India's compressed biogas blending obligation, which became mandatory for city gas networks from fiscal 2025-26 and rises to 5% of gas sales by fiscal 2028-29.
What is cow dung and what does the market count?
Cow dung is the excreta of cattle, a mix of undigested plant fiber, water, microbes and nutrients such as nitrogen, phosphorus and potassium. The report counts the value of dung that is sold or processed, including fresh dung bought by biogas plants, dried cakes and powder, pellets and processed organic fertilizers such as fermented organic manure made from digester slurry.
Dung that farmers spread on their own fields without a sale is excluded, as are biogas, electricity and finished paint, which are counted at the dung input value only. The value chain runs from cattle owners and gaushalas through collection centers, dairy cooperatives and processors to fertilizer marketers, energy companies and exporters.
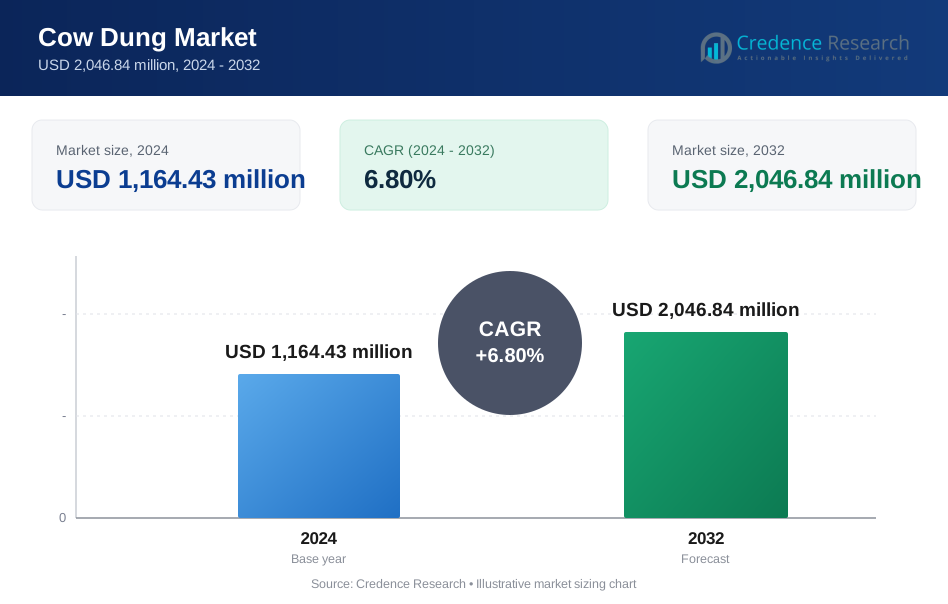
Cow Dung Market Insights
- The global cow dung market was valued at USD 1.24 billion in 2025 and is expected to reach USD 2.40 billion by 2035, growing at a 6.80% CAGR during 2026–2035.
- Asia Pacific held 42.7% of 2025 value, ahead of North America at 31.1%, because India alone counts about 195 million cattle.
- Processed organic fertilizers led product forms with 36.0% of 2025 value, supported by India paying Rs 1,500 per metric ton on fermented organic manure sales.
- Suzuki and Banas Dairy opened a plant in December 2025 that takes up to 100 tons of dung a day for compressed biogas.
- Competition centers on feedstock contracts, as dairies, energy companies and biodigester makers tie farmers to steady dung purchases.
Processed fertilizers and smallholder supply lead demand
Why do processed organic fertilizers lead product forms?
Based on product form, the market is categorized into fresh cow dung, dried cow dung cakes, cow dung powder, cow dung pellets and processed organic fertilizers. Processed Organic Fertilizers led with 36.0% of 2025 value because India pays market development assistance on fermented organic manure from biogas plants. According to Union Minister Jagat Prakash Nadda in a March 2026 Rajya Sabha reply, sales of fermented and liquid fermented organic manure reached 2,065,033 metric tons by Feb. 28, 2026. Cow Dung Powder grows fastest at 7.80% a year, as Gulf date farms buy dried dung, which India Business and Trade reports sells at Rs 5 to Rs 15 per kilogram.
How fast is biogas use of dung growing?
Based on application, the market is categorized into organic fertilizer, fuel, biogas and renewable energy, construction material binder and others. Organic Fertilizer led with 44.0% of 2025 value because composted dung remains the main soil input for organic and low-input farms. The Indian Council of Agricultural Research also began a two-year, Rs 11.79 crore field project on fermented organic manure on Nov. 29, 2024. Biogas and Renewable Energy grows fastest at 8.00% a year, as India had 189 functional compressed biogas projects and 979 community biogas plants under GOBARdhan by Jan. 27, 2026, according to Organiser.
Who supplies and buys most cow dung?
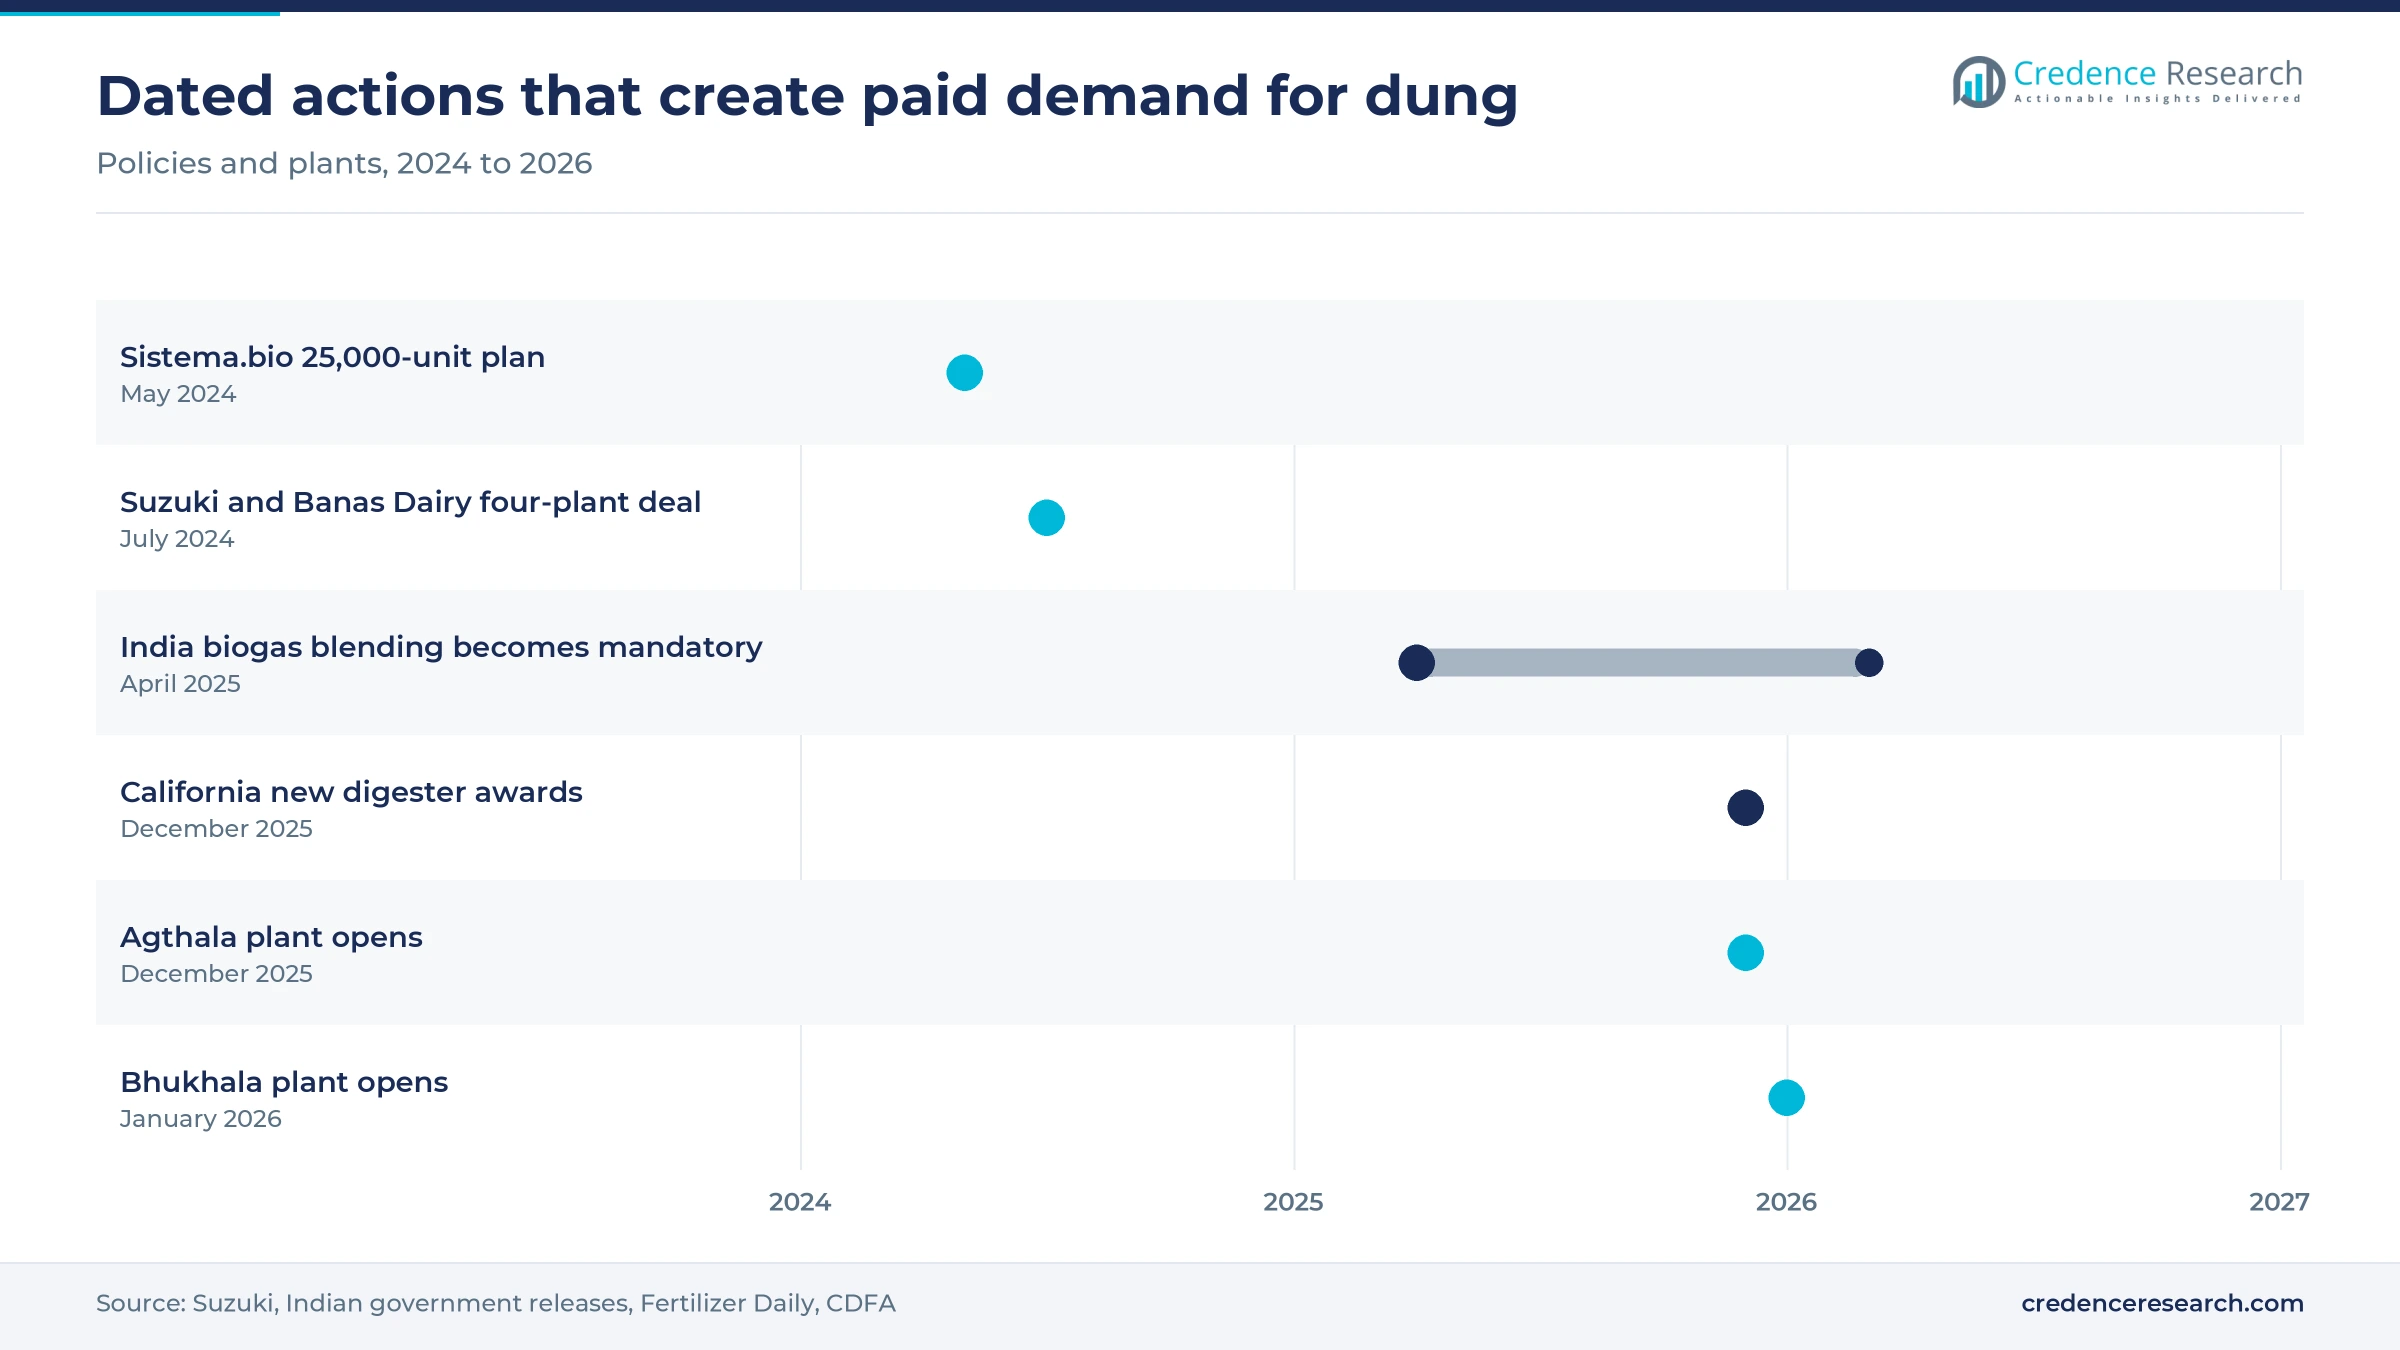
Based on end user, the market is categorized into smallholder farmers, commercial farmers, biogas plants and energy producers, organic farming enterprises and others. Smallholder Farmers led with 34.0% of 2025 value because small herds dominate supply and use. For example, Chhattisgarh bought 12.356 million quintals of dung from cattle rearers by June 30, 2023, according to Business Standard. Biogas Plants and Energy Producers grow fastest at 8.05% a year, as Suzuki opened its second Banaskantha biogas plant at Bhukhala in January 2026, following a July 2024 plan with Banas Dairy for four plants worth over Rs 250 crore.
| Segment Group | Leading Sub-segment | Share, 2025 | Fastest-growing Sub-segment | CAGR, 2026–2035 |
|---|---|---|---|---|
| By Product Form | Processed Organic Fertilizers | 36.0% | Cow Dung Powder | 7.80% |
| By Application | Organic Fertilizer | 44.0% | Biogas and Renewable Energy | 8.00% |
| By End User | Smallholder Farmers | 34.0% | Biogas Plants and Energy Producers | 8.05% |
Request a Free Sample
Fill in your details and we'll send you a free sample report.
- Sample data tables & charts
- Research methodology
Biogas mandates, dairy plants and manure subsidies
Compressed biogas blending rules create a paying feedstock buyer
India turned compressed biogas from a pilot fuel into a regulated product, and dung is its cheapest rural feedstock. The National Biofuels Coordination Committee approved phased blending on Nov. 24, 2023, making the obligation mandatory at 1% of CNG and piped gas sales from fiscal 2025-26. The share then rises to 3% in fiscal 2026-27, 4% in fiscal 2027-28 and 5% from fiscal 2028-29, according to Indian Chemical News. By Nov. 1, 2023, 50 projects had been commissioned under the SATAT program, which signals a growing pool of buyers for dung. The 2023 Union Budget also announced 500 new waste-to-wealth plants with Rs 10,000 crore of investment, which supports orders in the biogas plant sector.
Dairy cooperatives build plants that buy dung from members
Large dairies now treat dung as a second milk check for their members, which locks in steady supply. Suzuki R&D Center India, the National Dairy Development Board and Banas Dairy signed their agreement in September 2023, and the first plant opened at Agthala in Gujarat on Dec. 6, 2025. That plant takes up to 100 tons of dung a day and makes about 1.5 tons of compressed biogas, according to Suzuki. Suzuki says that output can fuel about 850 CNG cars a day, while the leftover slurry is sold as organic fertilizer. About 25,000 dairy farmers attended the opening, which shows how closely the plant is tied to the cooperative.
Fertilizer support turns digester slurry into a traded product
India pays Rs 1,500 per metric ton of market development assistance on fermented organic manure sold from biogas plants, which gives slurry a price. Sales under the program rose from 56,058 metric tons in fiscal 2023-24 to 336,291 metric tons in fiscal 2024-25 and 1,672,683 metric tons in fiscal 2025-26 up to Feb. 28, 2026, according to a Rajya Sabha reply. Total assistance released reached Rs 111.72 crore, and 120 biogas and compressed biogas plants were registered on the fertilizer ministry portal by March 4, 2026. Fertilizer companies had also signed 44 offtake agreements with plant operators, linking digesters to the organic fertilizer trade.
Methane capture payments raise the value of dairy manure
In the United States, climate programs reward farms that capture methane from manure, which turns dung into an energy asset. The U.S. Environmental Protection Agency counted 400 operating livestock digesters in June 2024, of which 343 were on dairy farms, according to AgSTAR data. Those systems cut 14.8 million metric tons of CO2 equivalent in 2023 and produced about 3.29 million MWh equivalent of energy. Vanguard Renewables also announced its Oakmulgee Dairy Farm digester in Virginia in October 2024, with output of more than 259,000 MMBtu of renewable gas a year sold to AstraZeneca. These payments explain why 31.1% of 2025 value sits in North America.
Paint, biodigesters, exports and biomethane openings
Shift toward branded dung paint, cakes and household products
Processors are moving dung into packaged consumer goods with higher prices per kilogram than raw manure. The Khadi and Village Industries Commission launched Khadi Prakritik Paint on Jan. 12, 2021, priced at Rs 120 a liter for distemper and Rs 225 for emulsion, according to the Press Information Bureau. The paint meets Bureau of Indian Standards norms, which helps sales to government buildings. Chhattisgarh reported more than 200,000 liters of dung paint made and 49 of 95 planned units set up by July 2023. Nitin Gadkari said the price is less than half the rate charged by large paint companies, according to the same release.
Rise of small biodigesters on smallholder dairy farms
Prefabricated biodigesters are spreading to farms with two to five cows, which turns household dung into cooking gas and liquid manure. According to Fertilizer Daily in May 2024, Sistema.bio had installed about 4,500 units in Telangana and Andhra Pradesh and planned 25,000 more over two years. The smallest unit costs about Rs 36,000, but subsidies and finance cut the farmer payment to Rs 6,000 to Rs 15,000. Sistema.bio also works with over 75,000 farmers in India and can make more than 9,000 digesters a month, which shows how quickly this channel can scale with credit and carbon finance.
Export opening for dried dung in Gulf and island farms
Importers in the Gulf and the Maldives buy dried Indian dung as a soil conditioner for date palms and vegetable plots. In June 2022, Kuwait ordered 192 metric tons of dung packed at the Sunrise Organic Park of Sripinjrapole Gaushala in Jaipur, according to Times Kuwait. The shipment moved by rail to Mundra port under customs supervision, which set a template for later orders. India Business and Trade cites the Department of Animal Husbandry and Dairying figure of over 3 million metric tons of dung produced in India each day, so supply is not the limit. Exporters that dry, sieve and certify the product can sell at Rs 5 to Rs 15 per kilogram.
Opportunity in European biomethane plants that need manure
Europe is adding biomethane capacity that needs steady agricultural feedstock, and cattle manure is a large, low-cost input. The European Biogas Association reported in December 2025 that combined biogas and biomethane output reached 22 billion cubic meters in 2024, up from 21.7 billion in 2023. The region had 1,620 biomethane plants at the end of 2024, which was 111 more than a year earlier. Shell completed its purchase of Danish producer Nature Energy in February 2023, gaining 14 operating plants and about 30 projects, according to Bioenergy International. Each new plant in the biomethane sector needs long-term manure supply contracts with farms.
Idle plants, thin farm prices and subsidy dependence
Many registered biogas plants are still not running
The plant pipeline is far larger than the plants that actually buy dung today. By January 2024, 536 compressed biogas plants and 1,193 biogas plants had registered on the GOBARdhan portal, according to the Ministry of Jal Shakti. Yet only 189 compressed biogas projects were functional by Jan. 27, 2026. Delays in finance, land and gas offtake leave farmers without a buyer, so state support and faster approvals remain the main fix.
Low farmgate prices limit collection effort
Prices paid for raw dung are low, which limits the effort farmers put into collection and storage. Chhattisgarh bought dung at Rs 2 a kilogram and paid Rs 247.12 crore for three years of purchases, a small sum spread across many herders. Total scheme spending reached Rs 507.14 crore by mid-2023, showing that much of the value depended on public budgets. Processors that pay more for cleaner, drier dung can improve quality and loyalty.
Fermented manure sales started slowly
Farmers were slow to buy digester slurry products in the first year of support, which shows a trust gap against chemical fertilizer. Sales of fermented organic manure under market development assistance were only 56,058 metric tons in fiscal 2023-24, and no assistance was released that year. Fertilizer companies then held 15,690 farmer meetings between February 2025 and January 2026 to build demand. Field trials and clear labeling remain needed to keep sales growing.
Dairy digesters still depend on public grants
Manure digesters are costly to build, and many farm projects still need grants to make the numbers work. California added $2.6 million for two new dairy digester projects in December 2025, and its Dairy Plus round gave nearly $27 million in federal grants to 23 projects, according to the California Department of Food and Agriculture. Those grants were matched by more than $28 million from private and state funds. Smaller herds struggle to raise such capital without shared cluster plants.
Asia Pacific leads on herd size and biogas programs
| Region | Value, 2025 (USD billion) | Share, 2025 | CAGR, 2026–2035 |
|---|---|---|---|
| Asia Pacific | 0.53 | 42.7% | 7.38% |
| North America | 0.39 | 31.1% | 6.18% |
| Europe | 0.22 | 17.7% | 6.28% |
| Latin America | 0.06 | 4.8% | 6.98% |
| Middle East & Africa | 0.05 | 3.7% | 7.18% |
Asia Pacific leads on herd size and village biogas plants
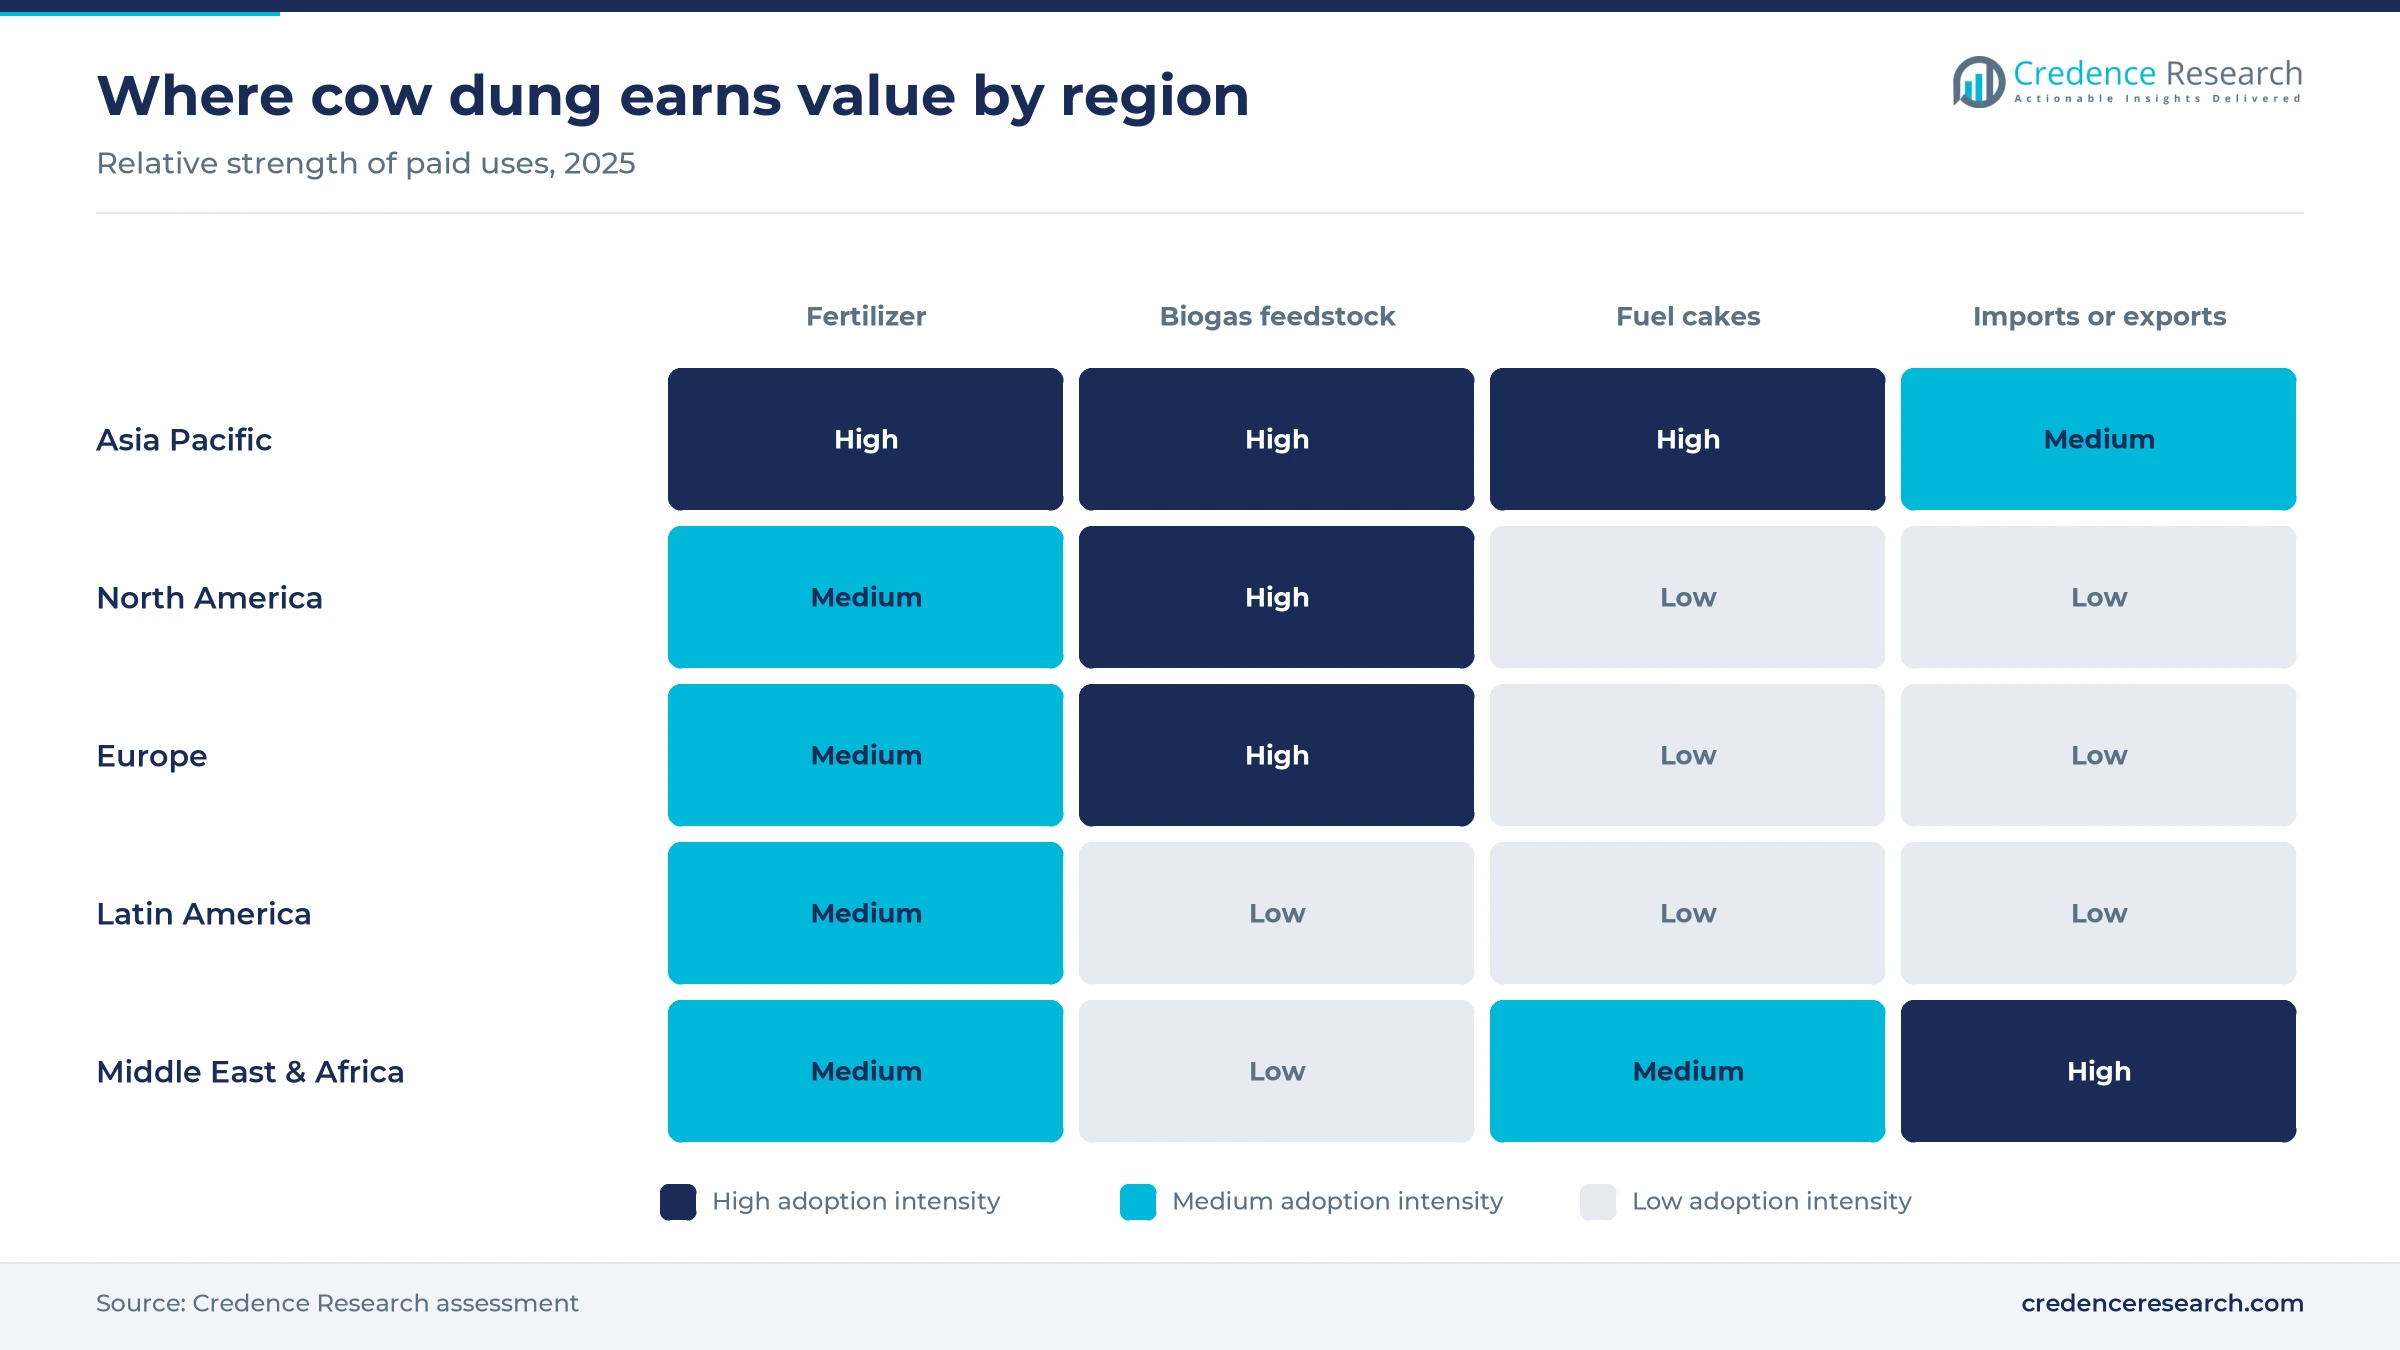
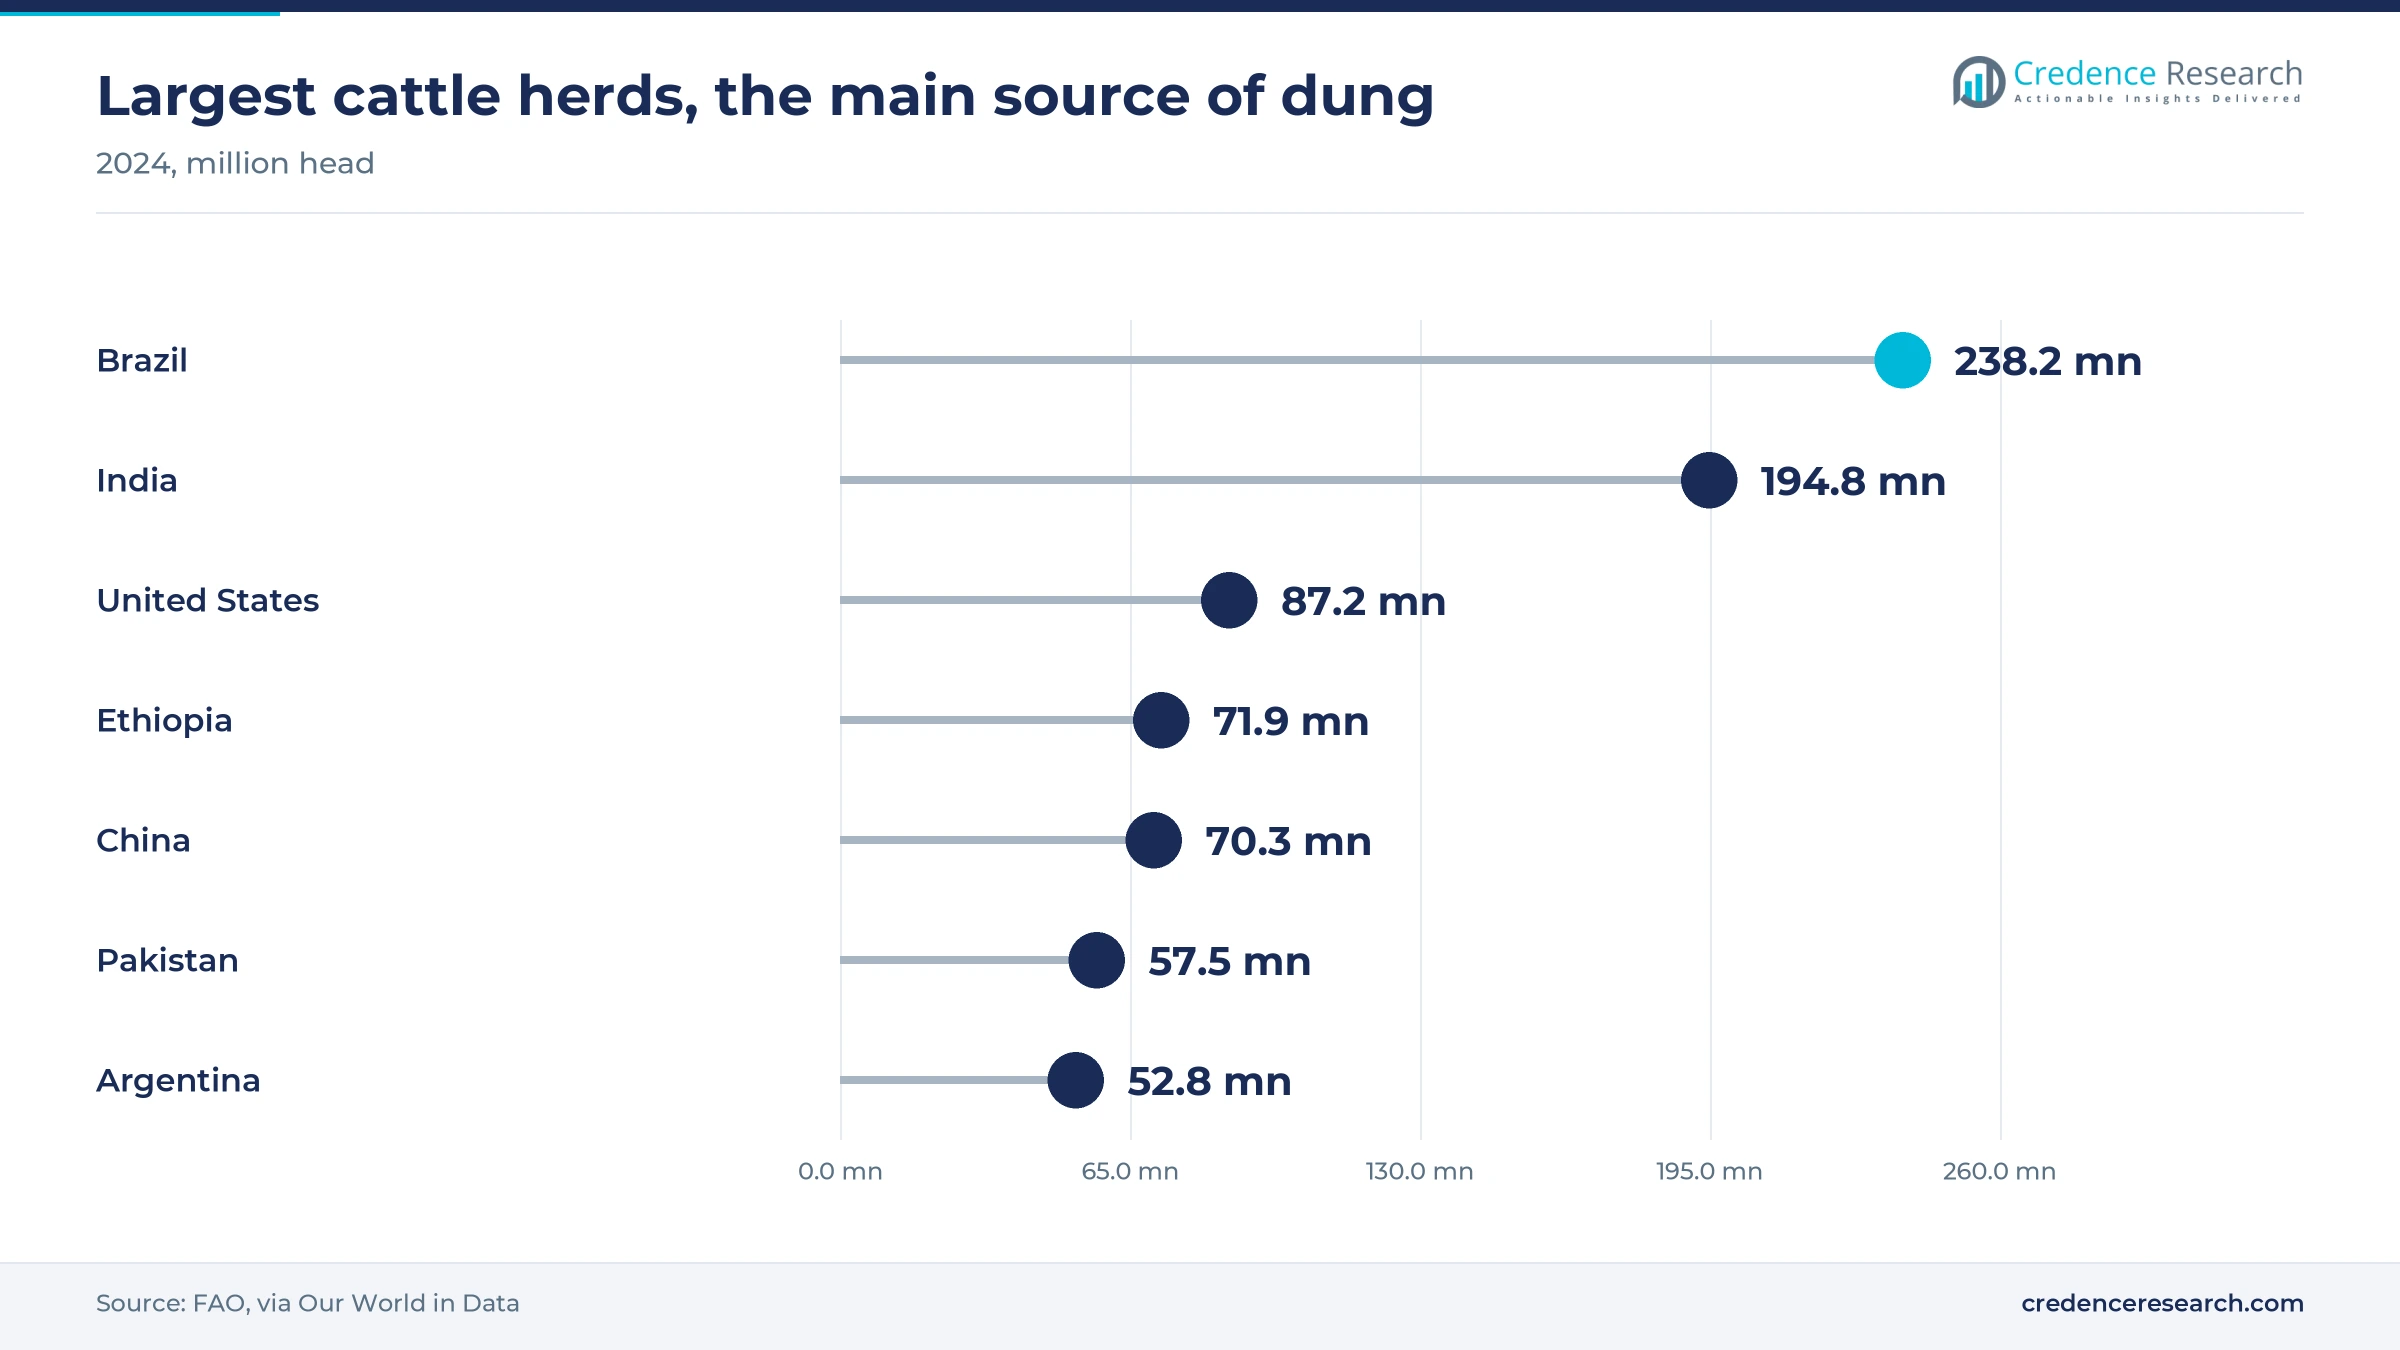
Asia Pacific held 42.7% of 2025 value and grows at 7.38% a year, the fastest regional rate. India counted 192.49 million cattle and 109.85 million buffalo in its 20th livestock census, released Oct. 16, 2019, the largest single dung supply. More than 1,100 GOBARdhan plants were working by early 2026, with Uttar Pradesh leading compressed biogas and Chhattisgarh leading community plants. Credence Research estimates India at about USD 320 million in 2025, roughly 60% of regional value. FAO data put India's herd at about 195 million cattle in 2024, out of 1.579 billion worldwide, while Pakistan adds 57.5 million.
North America pays for dairy manure as energy feedstock
North America held 31.1% of 2025 value and grows at 6.18% a year, because dairy manure earns energy and carbon payments. The U.S. had 87.2 million cattle in 2024 according to FAO data, and dairy farms host most of the country's manure digesters. California alone has funded 142 dairy digester projects under its research and development program, according to the state agriculture department. Buyers mainly purchase manure through long-term digester hosting agreements with farms.
Europe uses manure in a large biomethane fleet
Europe held 17.7% of 2025 value and grows at 6.28% a year, supported by a mature biogas industry. Denmark, Germany, France and Italy run many farm digesters that blend cattle manure with crop residues. The region had 1,620 biomethane plants at the end of 2024, according to the European Biogas Association, which shows how much farm feedstock the fleet must secure each year. Sales of composted manure to organic farms add further value.
Latin America has large herds but little paid trade
Latin America held 4.8% of 2025 value and grows at 6.98% a year, from a low base. Brazil had 238.2 million cattle in 2024 and Argentina 52.8 million, according to FAO data, yet most dung stays on pasture where it is not collected. Paid demand comes from feedlots, dairy digesters and compost sold to coffee, fruit and vegetable growers. Wider use of confined dairy systems in southern Brazil can raise the volume collected, since housed herds make manure easier to gather and sell.
Middle East and Africa import dung for date palms
Middle East and Africa held 3.7% of 2025 value and grows at 7.18% a year. Gulf states have few cattle and buy dried dung to build sandy soils, as shown by Kuwait's 192-ton Indian order in June 2022. Africa has large herds, with Ethiopia counting 71.9 million cattle in 2024 according to FAO data, and household biodigesters there can turn that dung into cooking gas. Better drying and certification will decide how much of this demand is met through imports.
Dairy biogas plants and fertilizer support in 2024-2026
| Development | Status and market relevance |
|---|---|
| In July 2024, Maruti Suzuki and Banas Dairy agreed to invest over Rs 250 crore in four dung-fed biogas plants in Banaskantha, Gujarat. | Agreement signed; plants commissioning from late 2025 |
| In May 2024, Sistema.bio announced plans to install 25,000 biodigesters in Telangana and Andhra Pradesh over two years. | Rollout under way with subsidy and carbon finance |
| In December 2025, Suzuki opened its Agthala biogas plant in Gujarat, which takes up to 100 tons of dung a day. | Operating; produces compressed biogas and organic fertilizer |
| In January 2026, Suzuki opened a second Banaskantha biogas plant at Bhukhala with Banas Dairy. | Operating; buys dung from dairy farmers |
| In March 2026, India reported fermented organic manure sales of over 2 million metric tons under its market development assistance program. | Ongoing support at Rs 1,500 per metric ton |
Digestion, fermentation and drying add value to dung
- Anaerobic digestion breaks dung down without oxygen to make biogas, which can be cleaned into compressed biogas for vehicles and gas grids.
- Fermented organic manure is the stabilized slurry left after digestion, sold in solid and liquid forms that India now supports with market assistance.
- Drying and pelletizing cut water content and weight, which lets dung be stored, bagged and shipped to distant farms and export buyers.
- Natural paint formulation uses dung as a base for distemper and emulsion that meet Indian standards, which creates a higher-value outlet.
Need a Custom Version of This Report?
Tailor the scope, geography, or segments to your exact requirements.
- Custom geography or segment scope
- Direct access to our analyst team
Dairies, energy firms and rural processors compete
The cow dung market is fragmented, because most dung is traded locally between herders, gaushalas, village collectors and farms. The most organized buyers are dairy cooperatives and energy companies that run digesters and sign long-term supply deals. In India, Banas Dairy, the National Dairy Development Board and Suzuki work together on compressed biogas plants that buy dung from member farmers. Sistema.bio competes in small farm biodigesters by pairing low-cost units with finance. In the United States, Vanguard Renewables hosts digesters on dairy farms and sells renewable gas to corporate buyers. In Europe, Nature Energy, owned by Shell, runs manure-based biomethane plants. Product makers such as the Khadi and Village Industries Commission and gaushalas such as Sripinjrapole compete on branded paint, cakes and export-grade dried dung.
Companies profiled and their roles in this market
| Company | Type | Role in the market |
|---|---|---|
| National Dairy Development Board | Public dairy body | Promotes dung-based biogas and manure plants with cooperatives |
| Banas Dairy | Dairy cooperative | Buys dung from member farmers for biogas plants in Gujarat |
| Suzuki Motor Corporation | Energy project developer | Builds compressed biogas plants fed with dung in Banaskantha |
| Sistema.bio | Biodigester maker | Sells prefabricated digesters to smallholder dairy farms |
| Vanguard Renewables | Renewable gas developer | Runs manure digesters on U.S. dairy farms |
| Nature Energy | Biomethane producer | Operates manure-based biomethane plants in Denmark |
| Khadi and Village Industries Commission | Public enterprise | Makes and licenses dung-based natural paint |
| Sripinjrapole Gaushala | Gaushala and exporter | Packed dried dung for export to Kuwait |
Feedstock contracts will decide who captures value
Credence Research's view is that the market is moving from informal local trade to contracted feedstock supply. Dairy cooperatives and energy companies will capture most new value because they control collection, digestion and the sale of gas and slurry. India's blending obligation and per-ton fertilizer support give these buyers a clear price signal through fiscal 2028-29. Smallholders gain when plants pay on time and collect dung close to the farm. Exporters can earn more by drying and certifying dung, but volumes stay small next to domestic energy demand.
How Credence Research sized the market
The report uses 2025 as the base year and forecasts values to 2035. Market values come from the Credence Research market model, which starts from cattle numbers, the share of dung sold or processed and average prices by product form. Regional and segment splits are Credence Research estimates built from these public inputs. Inputs come from public sources, including FAO cattle statistics, Indian government releases and parliamentary replies, U.S. EPA and California program data, European industry statistics and company announcements. No interviews or surveys were used for this edition of the report.
Biogas and organic manure set the pace to 2035
The market is expected to grow from USD 1.33 billion in 2026 to USD 2.40 billion by 2035. Biogas and renewable energy will be the fastest application as India's blending share rises and more dairy plants start buying dung. Processed organic fertilizers will keep the largest product share because every digester produces slurry that needs a market. North America and Europe will pay the most per ton through methane and biomethane programs. Asia Pacific will add the most volume, led by India's cooperative plants and village biogas units.
Frequently Asked Questions
How big is the cow dung market?
Which region leads the cow dung market?
How much cow dung does the world produce?
What cow dung products are sold in India?
Does India export cow dung?
How can farmers sell cow dung to the government?
How big is the cow dung market in India?
Which cow dung segment grows fastest?
Table of Content
Chapter 1 Market Segmentation
- 1.1 Segmentation Framework
- 1.1.1 Product and Service Classification
- 1.1.2 Application and End-Use Classification
- 1.1.3 Technology and Solution Classification
- 1.1.4 Customer and Distribution Channel Classification
- 1.1.5 Geographic Segmentation
- 1.1.6 Market Segment Definitions and Boundaries
- 1.2 By Product Form
- 1.2.1 Processed Organic Fertilizers
- 1.2.2 Fresh Cow Dung
- 1.2.3 Dried Cow Dung Cakes
- 1.2.4 Cow Dung Powder
- 1.2.5 Cow Dung Pellets
- 1.3 By Application
- 1.3.1 Organic Fertilizer
- 1.3.2 Biogas and Renewable Energy
- 1.3.3 Fuel
- 1.3.4 Construction Material Binder
- 1.3.5 Others
- 1.4 By End User
- 1.4.1 Smallholder Farmers
- 1.4.2 Commercial Farmers
- 1.4.3 Biogas Plants and Energy Producers
- 1.4.4 Organic Farming Enterprises
- 1.4.5 Others
Chapter 2 Introduction
- 2.1 Report Objectives and Scope
- 2.2 Product Definition and Industry Terminology
- 2.3 Market Inclusions and Exclusions
- 2.4 Research Process
- 2.4.1 Primary Research and Expert Interviews
- 2.4.2 Secondary Research and Source Review
- 2.4.3 Top-Down and Bottom-Up Estimation
- 2.4.4 Data Triangulation and Verification
- 2.5 Market Size Measurement Basis
- 2.5.1 2025: USD 1.24 billion → 2035: USD 2.40 billion
- 2.6 Historical and Forecast Reference Periods
- 2.6.1 Historical Period: 2018-2025
- 2.6.2 Base Year: 2025
- 2.6.3 Forecast Period: 2025-2035
- 2.7 Research Assumptions and Limitations
Chapter 3 Executive Summary
- 3.1 Market Snapshot and Key Findings
- 3.2 Base-Year Market Size, 2025
- 3.3 Forecast Market Size, 2035
- 3.4 Revenue and Volume Growth Outlook
- 3.5 Key Demand and Supply Indicators
- 3.6 Leading Market Segments
- 3.7 Fastest-Growing Market Opportunities
- 3.8 Regional Performance Highlights
- 3.9 Technology and Industry Transformation
- 3.10 Competitive Landscape Summary
- 3.11 Analyst View and Strategic Implications
Chapter 4 Global Cow Dung Market Trends and Developments
- 4.1 Historical Industry Development, 2018-2025
- 4.2 Recent Market Trends and Developments
- 4.3 Demand and Customer Behavior Trends
- 4.4 Technology and Product Innovation
- 4.5 Artificial Intelligence, Automation and Digitalization
- 4.6 Local Manufacturing and Supply Chain Realignment
- 4.7 Industry Partnerships, Mergers and Acquisitions
- 4.8 Sustainability and Circular Economy Developments
- 4.9 Government and Private Sector Investment Trends
- 4.10 Emerging Business Models and Commercialization
- 4.11 Industry Developments and Announcements
Chapter 5 Global Cow Dung Market Production, Supply and Demand Analysis
- 5.1 Demand Trend and Consumption Analysis, 2018-2025
- 5.2 Demand Forecast, 2025-2035
- 5.3 Production and Output Trend, 2018-2025
- 5.4 Production and Output Forecast, 2025-2035
- 5.5 Installed Capacity and Capacity Utilization
- 5.6 Company-Wise Production Plants and Statistics
- 5.6.1 Installed Production Capacity
- 5.6.2 Actual Production
- 5.6.3 Planned Capacity and Expansion Targets
- 5.7 Supply Chain Structure and Procurement Trends
- 5.8 Supply-Demand Gap and Bottlenecks
- 5.9 Import Dependence and Sourcing Structure
- 5.10 Contract Manufacturing and Outsourcing
- 5.11 Regional Supply and Demand Concentration
Chapter 6 Global Cow Dung Market Pricing Analysis
- 6.1 Pricing Structure and Measurement
- 6.2 Historical Pricing Trends, 2018-2025
- 6.3 Pricing Outlook, 2025-2035
- 6.4 Average Selling Price and Unit Economics
- 6.5 Pricing by Product and Market Segment
- 6.6 Geographic Pricing Differences
- 6.7 Key Input, Energy, Labor and Logistics Costs
- 6.8 Contract Pricing and Purchasing Models
- 6.9 Pricing Sensitivity and Competitive Positioning
- 6.10 Price, Margin and Profitability Implications
Chapter 7 Global Cow Dung Market Dynamics
- 7.1 Market Growth Drivers
- 7.1.1 Demand-Side Drivers
- 7.1.2 Technology and Innovation Drivers
- 7.1.3 Infrastructure and Investment Drivers
- 7.1.4 Regulatory and Policy Drivers
- 7.2 Market Restraints
- 7.2.1 Cost and Affordability Constraints
- 7.2.2 Technology and Adoption Barriers
- 7.2.3 Supply Chain and Operational Constraints
- 7.3 Market Challenges
- 7.3.1 Competitive Pressure and Margin Erosion
- 7.3.2 Skills, Infrastructure and Implementation Gaps
- 7.4 Emerging Market Opportunities
- 7.5 Market Dynamics Impact and Time-Horizon Assessment
Chapter 8 Global Cow Dung Value Chain Analysis
- 8.1 Industry Value Chain Overview
- 8.2 Upstream Suppliers and Critical Inputs
- 8.3 Technology and Component Providers
- 8.4 Manufacturing or Service Delivery
- 8.5 Distribution, Channel Partners and Integrators
- 8.6 Downstream Applications and End Users
- 8.7 Value Addition and Profit Pools
- 8.8 Vertical Integration and Outsourcing
- 8.9 Supplier Concentration and Risk
- 8.10 Supply Chain Localization and Resilience
Chapter 9 Global Cow Dung Market Regulations and Policies
- 9.1 Relevant Laws, Standards and Compliance Frameworks
- 9.2 Product, Service, Safety and Quality Requirements
- 9.3 Government Policies, Incentives and Subsidies
- 9.4 Imports, Exports and Trade Barriers
- 9.5 Public Procurement and Local Content Requirements
- 9.6 Environmental and Sustainability Compliance
- 9.7 Upcoming Policy Changes and Market Implications
Chapter 10 Global Cow Dung Market Hotspots and Opportunities
- 10.1 Market Opportunity Mapping and Growth Hotspots
- 10.2 High-Growth Applications and Customer Groups
- 10.3 Underserved Markets and White-Space Opportunities
- 10.4 Emerging Technology and Product Opportunities
- 10.5 New Capacity and Investment Hotspots
- 10.6 Market Entry and Expansion Opportunities
- 10.7 Distribution and Partnership Opportunities
- 10.8 Near-Term and Long-Term Commercial Potential
- 10.9 Opportunity Attractiveness and Execution Risks
Chapter 11 Global Cow Dung Market Outlook, 2025-2035
- 11.1 Market Size and Analysis
- 11.1.1 Revenue (Market Measurement: 2025: USD 1.24 billion → 2035: USD 2.40 billion)
- 11.1.2 Market Volume and Quantity Sold
- 11.1.3 Historical Market Size, 2018-2025
- 11.1.4 Base-Year Market Size, 2025
- 11.2 Market Forecast, 2025-2035
- 11.2.1 Revenue Forecast to 2035
- 11.2.2 Volume Forecast to 2035
- 11.2.3 CAGR and Year-on-Year Growth
- 11.2.4 Incremental Revenue Opportunity
- 11.3 Forecast Assumptions and Scenario Analysis
- 11.3.1 Base-Case Forecast
- 11.3.2 Optimistic and Conservative Scenarios
- 11.3.3 Technology, Pricing and Policy Sensitivities
- 11.4 Market Attractiveness and Growth Outlook
Chapter 12 Global Cow Dung Market Segmentation and Outlook
- 12.1 Segmentation Summary and Market Shares, 2025
- 12.2 Largest and Fastest-Growing Segments
- 12.3 By Product Form - Market Size and Forecast, 2025-2035
- 12.3.1 Segment Definition and Scope
- 12.3.2 Historical Market Size, 2018-2025
- 12.3.3 Revenue Forecast, 2025-2035
- 12.3.4 Volume Forecast, 2025-2035
- 12.3.5 Base-Year Market Share, 2025
- 12.3.6 Segment CAGR and Growth Drivers
- 12.3.7 Subsegment Market Size and Forecast
- 12.3.7.1 Processed Organic Fertilizers
- 12.3.7.2 Fresh Cow Dung
- 12.3.7.3 Dried Cow Dung Cakes
- 12.3.7.4 Cow Dung Powder
- 12.3.7.5 Cow Dung Pellets
- 12.3.8 Subsegment Pricing and Adoption Trends
- 12.3.9 Leading Suppliers and Competition
- 12.3.10 Regional Demand and Opportunities
- 12.4 By Application - Market Size and Forecast, 2025-2035
- 12.4.1 Segment Definition and Scope
- 12.4.2 Historical Market Size, 2018-2025
- 12.4.3 Revenue Forecast, 2025-2035
- 12.4.4 Volume Forecast, 2025-2035
- 12.4.5 Base-Year Market Share, 2025
- 12.4.6 Segment CAGR and Growth Drivers
- 12.4.7 Subsegment Market Size and Forecast
- 12.4.7.1 Organic Fertilizer
- 12.4.7.2 Biogas and Renewable Energy
- 12.4.7.3 Fuel
- 12.4.7.4 Construction Material Binder
- 12.4.7.5 Others
- 12.4.8 Subsegment Pricing and Adoption Trends
- 12.4.9 Leading Suppliers and Competition
- 12.4.10 Regional Demand and Opportunities
- 12.5 By End User - Market Size and Forecast, 2025-2035
- 12.5.1 Segment Definition and Scope
- 12.5.2 Historical Market Size, 2018-2025
- 12.5.3 Revenue Forecast, 2025-2035
- 12.5.4 Volume Forecast, 2025-2035
- 12.5.5 Base-Year Market Share, 2025
- 12.5.6 Segment CAGR and Growth Drivers
- 12.5.7 Subsegment Market Size and Forecast
- 12.5.7.1 Smallholder Farmers
- 12.5.7.2 Commercial Farmers
- 12.5.7.3 Biogas Plants and Energy Producers
- 12.5.7.4 Organic Farming Enterprises
- 12.5.7.5 Others
- 12.5.8 Subsegment Pricing and Adoption Trends
- 12.5.9 Leading Suppliers and Competition
- 12.5.10 Regional Demand and Opportunities
- 12.6 Segment Growth Comparison
- 12.7 Segment Attractiveness and Priority Matrix
Chapter 13 Global Cow Dung End-Use and Application Market Outlook
- 13.1 End-Use Industry and Customer Demand Structure
- 13.2 Leading Applications and Customer Groups
- 13.3 End-Use Market Size, Share and Forecast
- 13.4 Major End-Use Industry Deep Dives
- 13.4.1 Customer Requirements and Use Cases
- 13.4.2 Demand and Replacement Cycles
- 13.4.3 Technical and Regulatory Considerations
- 13.4.4 Purchasing and Procurement Models
- 13.4.5 Leading Vendors and Distribution Channels
- 13.4.6 Forecast and Commercial Opportunities
- 13.5 Emerging Applications and Cross-Segment Demand
- 13.6 End-Use Industry Investment Priorities
Chapter 14 Global Cow Dung Geographic Market Outlook, 2025-2035
- 14.1 Regional Market Size and Share, 2025
- 14.2 Regional Market Forecast, 2025-2035
- 14.3 Regional Pricing, Production and Demand Differences
- 14.4 North America
- 14.4.1 United States
- 14.4.2 Canada
- 14.4.3 Mexico
- 14.5 Europe
- 14.5.1 Germany
- 14.5.2 France
- 14.5.3 Italy
- 14.5.4 United Kingdom
- 14.5.5 Spain
- 14.5.6 Poland
- 14.5.7 Russia
- 14.5.8 Netherlands
- 14.5.9 Belgium
- 14.5.10 Sweden
- 14.5.11 Denmark
- 14.5.12 Norway
- 14.5.13 Rest of Europe
- 14.6 Asia Pacific
- 14.6.1 China
- 14.6.2 India
- 14.6.3 Japan
- 14.6.4 South Korea
- 14.6.5 Thailand
- 14.6.6 Indonesia
- 14.6.7 Vietnam
- 14.6.8 Malaysia
- 14.6.9 Australia
- 14.6.10 Rest of Asia Pacific
- 14.7 Latin America
- 14.7.1 Brazil
- 14.7.2 Argentina
- 14.7.3 Colombia
- 14.7.4 Chile
- 14.7.5 Rest of Latin America
- 14.8 Middle East
- 14.8.1 Saudi Arabia
- 14.8.2 United Arab Emirates
- 14.8.3 Turkey
- 14.8.4 Israel
- 14.8.5 Iran
- 14.8.6 Rest of the Middle East
- 14.9 Africa
- 14.9.1 South Africa
- 14.9.2 Egypt
- 14.9.3 Nigeria
- 14.9.4 Morocco
- 14.9.5 Rest of Africa
- 14.10 Regional Investment, Policy and Supply Chain Differences
- 14.11 Regional Competitive Landscape
- 14.12 Geographic Growth Hotspots
Chapter 15 Global Cow Dung Technology, Innovation and Sustainability Outlook
- 15.1 Technology Landscape and Maturity
- 15.2 Product, Process and Service Innovation
- 15.3 AI, Automation and Digital Tools in the Industry
- 15.4 Technology Adoption and Performance Benchmarking
- 15.5 Innovation Pipeline and R&D Investment
- 15.6 Patent and Intellectual Property Trends
- 15.7 Energy Efficiency and Resource Management
- 15.8 Sustainability, Recycling and Circularity
- 15.9 Technology Roadmap, 2025-2035
- 15.10 Risks of Obsolescence and Technology Substitution
Chapter 16 Global Cow Dung Market Key Strategic Imperatives
- 16.1 Growth and Market Entry Priorities
- 16.2 High-Return Products and Segments
- 16.3 Pricing, Profitability and Cost Optimization
- 16.4 Technology Investment and Product Differentiation
- 16.5 Supply Chain Localization and Resilience
- 16.6 Distribution and Customer Acquisition
- 16.7 Partnership, Acquisition and Capacity Strategy
- 16.8 Regional Expansion Priorities
- 16.9 Short-, Medium- and Long-Term Actions
Chapter 17 Competition Outlook
- 17.1 Industry Competition Characteristics
- 17.2 Market Structure and Concentration
- 17.3 Market Share and Competitive Positioning, 2025
- 17.4 Company-Wise Revenue and Product Benchmarking
- 17.5 Production and Service Capacity Benchmarking
- 17.6 Technology, Pricing and Differentiation
- 17.7 Regional Footprint and Distribution Strength
- 17.8 Mergers, Acquisitions and Strategic Alliances
- 17.9 New Entrants and Competitive Threats
- 17.10 Porter's Five Forces and Industry Attractiveness
- 17.11 Competitive Outlook, 2025-2035
Chapter 18 Company Profiles
- 18.1 Company Coverage and Selection Criteria
- 18.2 National Dairy Development Board
- 18.2.1 Business Description
- 18.2.2 Company Ownership and Geographic Presence
- 18.2.3 Product and Service Portfolio
- 18.2.4 Manufacturing and Operating Footprint
- 18.2.5 Production Capacity and Expansion Plans
- 18.2.6 Financial Performance and Investment
- 18.2.7 Market Share and Competitive Position
- 18.2.8 Technology and Innovation Capabilities
- 18.2.9 Strategic Alliances or Partnerships
- 18.2.10 Recent Developments
- 18.2.11 Growth Strategy and Outlook
- 18.3 Banas Dairy
- 18.4 Suzuki Motor Corporation
- 18.5 Sistema.bio
- 18.6 Vanguard Renewables
- 18.7 Nature Energy
- 18.8 Khadi and Village Industries Commission
- 18.9 Sripinjrapole Gaushala
- 18.10 Other Relevant Market Participants
Note: Every listed company is profiled on the structure shown under the first company. The company list is preliminary and may change based on research findings, market developments, data availability and client requirements.
Chapter 19 Disclaimer
- 19.1 Research and Forecast Disclaimer
- 19.2 Data Source and Estimation Limitations
Note: The depth of individual sections depends on data availability for this market. Volume, capacity, trade and other unit-based metrics are included where applicable.

