
Market Overview
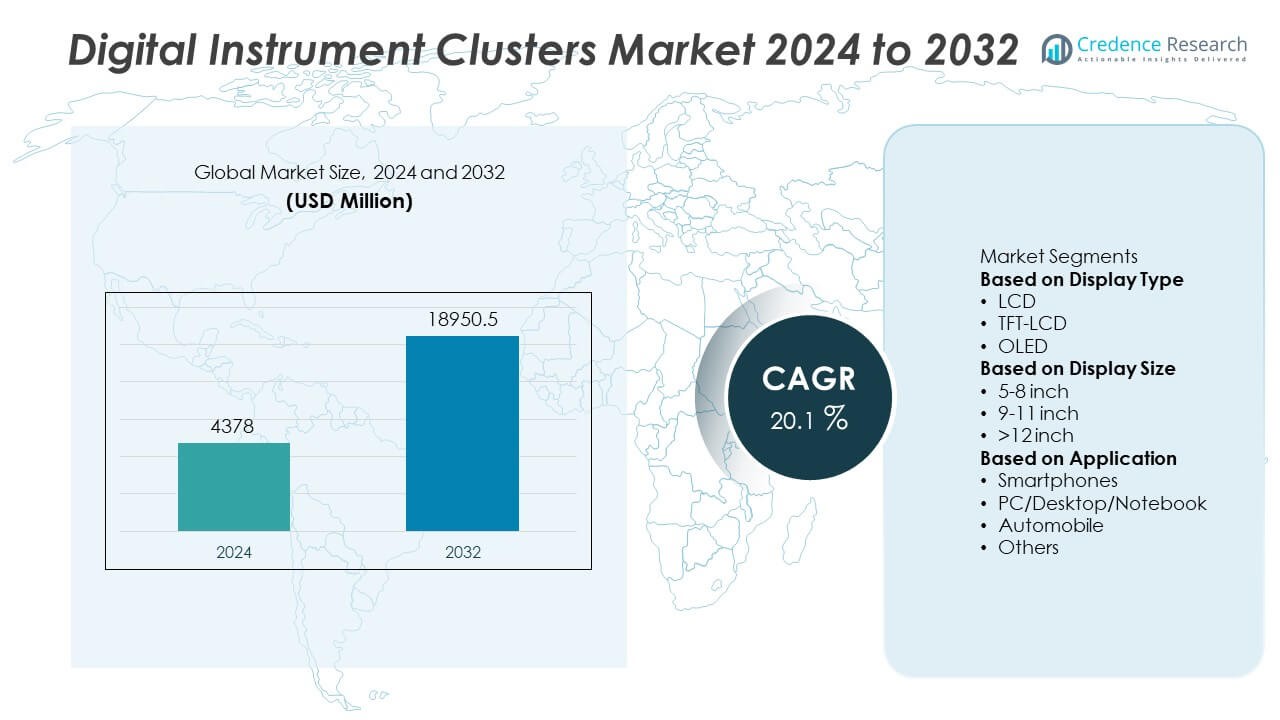
The Digital Instrument Clusters Market was valued at USD 4,378 million in 2024 and is projected to reach USD 18,950.5 million by 2032, growing at a CAGR of 20.1% during the forecast period.
| REPORT ATTRIBUTE | DETAILS |
|---|---|
| Historical Period | 2020-2023 |
| Base Year | 2024 |
| Forecast Period | 2025-2032 |
| Digital Instrument Clusters Market Size 2024 | USD 4,378 Million |
| Digital Instrument Clusters Market, CAGR | 20.1% |
| Digital Instrument Clusters Market Size 2032 | USD 18,950.5 Million |
Digital Instrument Clusters Market grows with rising adoption of connected vehicles, ADAS features, and electric mobility. Automakers integrate high-resolution digital clusters to display navigation, safety alerts, and vehicle diagnostics in real time. It improves driver awareness and enhances user experience with customizable layouts.
Digital Instrument Clusters Market shows strong growth across North America, Europe, Asia-Pacific, Latin America, and Middle East & Africa, with Europe leading adoption due to advanced automotive manufacturing and early integration of digital cockpit technologies. North America benefits from high demand for connected vehicles and premium SUVs, while Asia-Pacific experiences rapid expansion driven by electric vehicle production, rising incomes, and consumer demand for tech-rich interiors. Latin America and Middle East & Africa present growing opportunities supported by urbanization, luxury car demand, and government investment in mobility infrastructure. Key players such as Continental, Bosch, Denso, and Hyundai Mobis focus on developing high-resolution TFT and OLED clusters, investing in AR-enabled dashboards, and expanding software capabilities. These companies collaborate with automakers to deliver customizable, scalable solutions that meet safety standards, improve driver engagement, and support integration with ADAS and infotainment systems, strengthening their position in this rapidly evolving market.
Market Insights
- Digital Instrument Clusters Market was valued at USD 4,378 million in 2024 and is projected to reach USD 18,950.5 million by 2032, growing at a CAGR of 20.1%.
- Rising demand for connected vehicles, ADAS features, and tech-driven interiors fuels market growth.
- Trends show increasing adoption of AR-enabled clusters, larger display sizes, and 3D visualization for better driver engagement.
- Key players such as Continental, Bosch, Denso, Hyundai Mobis, and Samsung Electronics focus on developing high-resolution OLED and TFT displays, expanding software capabilities, and partnering with automakers.
- High development costs, cybersecurity risks, and complex integration with vehicle electronics create major challenges for manufacturers and suppliers.
- Europe leads with strong innovation and EV adoption, while Asia-Pacific shows the fastest growth supported by rising production, government incentives, and expanding middle-class demand.
- Opportunities emerge from electric and autonomous vehicle production, connected ecosystems, and scalable cluster solutions for mid-range and mass-market vehicles worldwide.
Market Drivers
Growing Adoption of Advanced Driver Assistance Systems (ADAS)
Digital Instrument Clusters Market grows with increasing integration of ADAS and connected vehicle technologies. Modern vehicles require high-resolution, fully digital displays to present real-time data such as lane-keeping alerts, adaptive cruise control status, and collision warnings. Automakers use these clusters to enhance driver awareness and road safety. It supports seamless communication between driver and vehicle systems, improving decision-making during complex driving scenarios. Consumers prefer digital displays for their clarity and ability to customize information layouts. This demand pushes manufacturers to develop flexible, software-driven cluster solutions that support future upgrades and over-the-air updates.
- For instance, Visteon’s Premium Series clusters offer a display resolution of 2880×1080 pixels on a 12.3-inch screen with quad-core processor running at 1.1 GHz, enabling simultaneous rendering of ADAS warnings and navigation maps.
Rising Consumer Demand for Premium Vehicle Interiors
Digital Instrument Clusters Market benefits from growing interest in modern, tech-driven vehicle interiors. Drivers expect sleek dashboards with high-definition displays that mirror smartphone-like experiences. Automakers focus on using digital clusters to differentiate premium models and attract buyers seeking advanced features. It allows integration of infotainment, navigation, and performance data into a single display unit. Enhanced aesthetics and intuitive user interfaces help improve customer satisfaction. This trend drives adoption not only in luxury vehicles but also in mid-range and mass-market segments.
- For instance, Visteon’s Entry Series provides a 7-inch to 10.25-inch display with maximum resolution of 1280×768 pixels, aimed at affordability while offering features like brightness up to 1000 cd/m² for clear visibility in different lighting.
Shift Toward Electric and Hybrid Vehicles
Digital Instrument Clusters Market expands with rising production of electric and hybrid vehicles. EVs and hybrids rely on digital clusters to display battery status, range estimation, and energy consumption data. It provides critical information that helps drivers optimize performance and charging schedules. Automakers design customized layouts for EV clusters to highlight sustainability-focused metrics. Growing government incentives for EV adoption further fuel demand for such advanced display solutions. This segment offers manufacturers opportunities to innovate with energy-efficient and lightweight display technologies.
Technological Advancements in Display and Connectivity
Digital Instrument Clusters Market experiences strong growth from advancements in display resolution, graphics processing, and connectivity. TFT, OLED, and QLED panels enable sharper visuals and reduced power consumption. It supports seamless integration with smartphones, voice assistants, and cloud-based applications. Manufacturers invest in AR-enabled clusters that overlay navigation and safety information on the windshield. Growing use of 3D visualization improves user experience and vehicle personalization. Continuous R&D ensures faster processing speeds, better reliability, and reduced latency. These innovations keep digital clusters at the center of automotive cockpit evolution.
Market Trends
Integration of Augmented Reality and 3D Graphics
Digital Instrument Clusters Market is seeing rapid adoption of augmented reality (AR) and 3D visualization. Automakers use AR-enabled clusters to project navigation arrows, hazard alerts, and traffic data directly into the driver’s line of sight. It improves driver focus and reduces distraction by minimizing reliance on separate displays. 3D graphics enhance depth perception and make information easier to interpret quickly. Premium carmakers lead this trend, but mid-segment vehicles are starting to include similar features. These advancements improve the overall driving experience and strengthen brand differentiation.
- For instance, Geely’s Boyue L (2025 facelift) includes a 25.6-inch AR-HUD plus a separate 10.25-inch digital instrument cluster display.
Expansion into Mid-Range and Mass-Market Vehicles
Digital Instrument Clusters Market expands beyond luxury segments as costs decline and production scales up. Automakers now offer fully digital clusters in compact cars and entry-level SUVs. It increases market penetration and widens customer access to advanced cockpit technology. Drivers expect customizable displays with smartphone integration even in budget models. Manufacturers respond by developing cost-effective, modular cluster platforms suitable for multiple vehicle types. This democratization of technology supports long-term market growth and consumer adoption.
- For instance, the pre-2025 Geely Boyue L featured a 10.25-inch digital instrument cluster and a 13.2-inch central infotainment display. This system was powered by a Qualcomm Snapdragon 8155 processor, enabling smooth rendering of 3D graphics and real-time data.
Focus on Personalization and Connectivity
Digital Instrument Clusters Market benefits from rising demand for personalization and connected features. Drivers want dashboards that display relevant information based on driving style and preferences. It enables customizable themes, layouts, and widgets, allowing users to tailor their experience. Connectivity with smartphones and IoT ecosystems lets drivers receive updates, alerts, and media controls in real time. Automakers integrate cloud-based services to offer predictive maintenance and over-the-air software upgrades. These capabilities create a more interactive and intelligent cockpit environment.
Advances in Display Technology and Energy Efficiency
Digital Instrument Clusters Market grows with continuous improvement in display panels, processors, and software optimization. Manufacturers adopt TFT, AMOLED, and microLED displays for high resolution and low latency. It reduces power consumption while providing vivid color reproduction and improved durability. Thinner and lighter panels support weight reduction efforts for fuel efficiency. Automotive suppliers focus on enhancing brightness and anti-glare properties for better visibility in all conditions. Such innovations make clusters more reliable, cost-efficient, and suitable for future mobility platforms.
Market Challenges Analysis
High Development Costs and Complex Integration
Digital Instrument Clusters Market faces challenges due to high development costs and complex integration with vehicle electronics. Advanced clusters require powerful processors, high-resolution displays, and sophisticated software platforms, raising production expenses. It creates pressure on automakers to balance cost efficiency and premium user experience. Integration with multiple vehicle systems such as ADAS, infotainment, and telematics demands robust testing and validation. Any failure can impact safety, leading to recalls and warranty costs. Tier-1 suppliers invest heavily in R&D to deliver scalable and cost-effective solutions, but achieving affordability for mass-market vehicles remains difficult.
Cybersecurity Risks and Reliability Concerns
Digital Instrument Clusters Market is impacted by rising cybersecurity risks and system reliability issues. Clusters connected to cloud services and vehicle networks face threats of hacking and data breaches. It forces manufacturers to invest in secure software architectures and encryption protocols. Hardware and software failures can lead to display blackouts or incorrect data, creating safety hazards. Meeting strict automotive functional safety standards such as ISO 26262 increases development time. Suppliers must ensure robust performance under extreme temperatures, vibration, and electromagnetic interference. These challenges make reliability and security critical factors for market success.
Market Opportunities
Rising Adoption of Electric and Autonomous Vehicles
Digital Instrument Clusters Market holds significant opportunities with the global shift toward electric and autonomous mobility. EVs depend on digital clusters to display battery health, charging status, and energy consumption data in real time. It allows automakers to design advanced visual interfaces that educate drivers about energy efficiency and range management. Autonomous vehicles will need intelligent dashboards to provide status updates and reassure passengers about system performance. Automakers can offer premium personalization features and subscription-based services through these digital interfaces. Growing investment in EV infrastructure worldwide further boosts demand for advanced display solutions.
Expansion in Emerging Markets and Connected Ecosystems
Digital Instrument Clusters Market gains growth potential from rising vehicle production in Asia-Pacific, Latin America, and Middle East regions. Consumers in these markets increasingly expect modern, tech-rich interiors even in affordable cars. It creates opportunities for suppliers to develop scalable, low-cost digital cluster platforms. Growing penetration of connected cars and IoT-enabled services enhances value by offering navigation, telematics, and infotainment in one interface. Automakers can leverage data analytics to improve user experience and provide predictive maintenance alerts. These opportunities enable manufacturers to expand their global footprint and capture untapped demand.
Market Segmentation Analysis:
By Display Type
Digital Instrument Clusters Market is segmented by display type into LCD, TFT-LCD, and OLED. TFT-LCD dominates due to its balance of cost-effectiveness, durability, and ability to deliver high-resolution graphics. Automakers adopt OLED displays in premium models for their superior contrast, flexibility, and thinner design. It allows curved and customizable dashboards that enhance vehicle aesthetics. LCD displays maintain presence in entry-level vehicles because of their affordability. The transition toward fully digital clusters is accelerating, with hybrid analog-digital solutions slowly phasing out. This shift supports the industry’s move toward connected and intelligent cockpit systems.
- For instance, Visteon unveiled a curved large-format OLED display exceeding 27 inches in screen size, integrated into next-generation luxury electric vehicles to enable customizable dashboards and seamless infotainment-ADAS overlays.
By Display Size
Digital Instrument Clusters Market by display size is divided into less than 5 inches, 5–8 inches, and above 8 inches. Displays above 8 inches lead demand, driven by growing preference for wide, panoramic clusters in premium cars and SUVs. It enables seamless integration of navigation, infotainment, and ADAS alerts in a single screen. The 5–8-inch segment sees steady adoption in mid-range vehicles as manufacturers balance cost and functionality. Smaller clusters under 5 inches remain relevant in compact and entry-level models where minimal display space is required. Automakers continue to expand screen size offerings to create immersive driver experiences. The trend favors larger and high-resolution displays across multiple vehicle categories.
- For instance, an earlier version of BMW's Live Cockpit Professional with iDrive 7.0 delivered a fully digital 12.3-inch instrument cluster and was accompanied in models like the pre-facelift G20 3 Series and G15 8 Series by a 10.25-inch center console display. In newer BMWs running iDrive 8 or later, the displays are larger and integrated into a single curved screen, which typically consists of a 12.3-inch instrument display and a 14.9-inch control display.
By Application
Digital Instrument Clusters Market by application includes passenger cars, commercial vehicles, and two-wheelers. Passenger cars dominate due to strong demand for comfort, connectivity, and advanced cockpit features. It drives adoption in SUVs, sedans, and electric cars globally. Commercial vehicles are integrating digital clusters to improve driver information access and enhance fleet monitoring. Two-wheeler adoption is rising in premium motorcycles and electric scooters, offering real-time navigation and performance data. This broadening application base strengthens revenue opportunities for display and software suppliers. Growing use across vehicle segments supports long-term market expansion and technology evolution.
Segments:
Based on Display Type
- LCD
- TFT-LCD
- OLED
Based on Display Size
- 5-8 inch
- 9-11 inch
- >12 inch
Based on Application
- Smartphones
- PC/Desktop/Notebook
- Automobile
- Others
Based on the Geography:
- North America
- U.S.
- Canada
- Mexico
- Europe
- UK
- France
- Germany
- Italy
- Spain
- Russia
- Belgium
- Netherlands
- Austria
- Sweden
- Poland
- Denmark
- Switzerland
- Rest of Europe
- Asia Pacific
- China
- Japan
- South Korea
- India
- Australia
- Thailand
- Indonesia
- Vietnam
- Malaysia
- Philippines
- Taiwan
- Rest of Asia Pacific
- Latin America
- Brazil
- Argentina
- Peru
- Chile
- Colombia
- Rest of Latin America
- Middle East
- UAE
- KSA
- Israel
- Turkey
- Iran
- Rest of Middle East
- Africa
- Egypt
- Nigeria
- Algeria
- Morocco
- Rest of Africa
Regional Analysis
North America
North America holds 27% market share in the Digital Instrument Clusters Market, driven by strong adoption of connected vehicles and ADAS technologies. The U.S. leads production with high penetration of premium cars and SUVs equipped with digital cockpit solutions. It benefits from advanced automotive electronics infrastructure and early adoption of electric vehicles. Automakers invest in integrating large, high-resolution digital clusters to improve user experience and meet consumer demand for customization. Growth in over-the-air updates and subscription-based infotainment services further accelerates market adoption. Canada and Mexico contribute through manufacturing facilities and increasing vehicle production, supporting steady regional growth.
Europe
Europe accounts for 33% market share, making it the largest region in the Digital Instrument Clusters Market. German, French, and U.K. automakers drive innovation in digital cockpit design and use OLED and TFT displays in luxury and mid-range vehicles. It benefits from strong focus on driver safety, sustainability, and compliance with strict automotive standards. Electric vehicle sales continue to rise, creating demand for advanced digital dashboards to display energy consumption and range data. European consumers favor highly personalized driving experiences, encouraging automakers to offer customizable cluster themes and layouts. Partnerships with technology providers strengthen development of AR-enabled clusters across major brands.
Asia-Pacific
Asia-Pacific captures 29% market share and is the fastest-growing region in the Digital Instrument Clusters Market. China leads production, supported by large-scale automotive manufacturing and rapid adoption of electric vehicles. It benefits from government incentives promoting EV production and connected car technologies. Japan and South Korea contribute through innovation in display panels, semiconductors, and software solutions for intelligent cockpits. Rising middle-class incomes and urbanization drive demand for feature-rich vehicles across India and Southeast Asia. Expanding e-mobility ecosystems and smart city initiatives boost integration of digital clusters in multiple vehicle categories. This region is expected to remain the primary growth engine over the forecast period.
Latin America
Latin America holds 6% market share, supported by growing demand for tech-enabled passenger cars and SUVs. Brazil and Mexico drive regional sales with rising consumer interest in connected vehicle features. It faces cost constraints, but automakers introduce mid-range models with hybrid digital clusters to attract buyers. Economic recovery and expanding financing options increase new vehicle purchases. Local assembly plants adopt digital cockpit solutions, creating opportunities for Tier-1 suppliers. Increasing penetration of electric and hybrid vehicles supports future growth potential.
Middle East & Africa
Middle East & Africa represents 5% market share, driven by luxury vehicle demand and growing urban mobility projects. GCC countries such as UAE and Saudi Arabia lead adoption of premium cars with fully digital dashboards. It benefits from rising investments in smart infrastructure and electric mobility. Automakers focus on offering digital cluster options even in imported mid-segment vehicles to meet evolving consumer expectations. South Africa shows steady demand supported by growing SUV sales and local assembly operations. The region presents long-term opportunities as governments promote connected and sustainable transportation.
Key Player Analysis
- Veoneer
- Yanfeng Automotive Electronics
- Pioneer
- Bosch
- Clarion
- Hyundai Mobis
- Continental
- Samsung Electronics
- Valeo
- Denso
Competitive Analysis
Competitive landscape of the Digital Instrument Clusters Market is shaped by leading players such as Continental, Bosch, Denso, Valeo, Hyundai Mobis, Yanfeng Automotive Electronics, Samsung Electronics, Pioneer, Clarion, and Veoneer. These companies focus on developing advanced TFT, OLED, and microLED cluster solutions with superior resolution, low latency, and energy efficiency to meet growing demand for connected and intelligent cockpits. They invest heavily in R&D to integrate AR capabilities, 3D graphics, and over-the-air software updates, enabling enhanced driver engagement and real-time data visualization. Partnerships with global automakers strengthen supply chain presence and ensure seamless integration with ADAS, infotainment, and telematics systems. Tier-1 suppliers expand production capacity and develop modular, scalable platforms that suit both premium and mass-market vehicle segments. Efforts to improve cybersecurity, functional safety, and compliance with ISO 26262 standards remain critical for maintaining trust and reliability. These strategies allow players to remain competitive in a rapidly evolving market.
Recent Developments
- In August 2025, Denso, Beginning a demonstration project named Solwer with Dream Incubator. It aims to build an integrated digital platform managing big data from India’s automotive aftermarket + supply chain.
- In August 2025, Denso, At ITS World Congress, Denso will showcase its MobiQ™ brand solutions including on-board and roadside V2X units, and keyless access HMI technologies.
- In 2025, At Bosch Tech Day in May 2025, the company emphasized AI-based solutions for assisted and automated driving. Likely such solutions feed into future digital cluster features, though no explicit cluster product was announced in that event
- In 2024, Yanfeng unveiled its EVI (Electric Vehicle Interior) concept at CES 2024. The concept eliminates the traditional instrument panel; replaces it with a Smart Cabin Seat module that integrates displays, HMI, safety systems, steer-by-wire input, and climate control.
Report Coverage
The research report offers an in-depth analysis based on Display Type, Display Size, Application and Geography. It details leading market players, providing an overview of their business, product offerings, investments, revenue streams, and key applications. Additionally, the report includes insights into the competitive environment, SWOT analysis, current market trends, as well as the primary drivers and constraints. Furthermore, it discusses various factors that have driven market expansion in recent years. The report also explores market dynamics, regulatory scenarios, and technological advancements that are shaping the industry. It assesses the impact of external factors and global economic changes on market growth. Lastly, it provides strategic recommendations for new entrants and established companies to navigate the complexities of the market.
Future Outlook
- Demand for advanced digital clusters will rise with growing connected and autonomous vehicles.
- AR-enabled and 3D visualization features will become standard in premium and mid-range models.
- Larger, high-resolution OLED and microLED displays will dominate future vehicle interiors.
- Software-driven clusters will enable frequent over-the-air updates and new feature activation.
- Personalization options will expand, allowing drivers to customize layouts and themes.
- Electric and hybrid vehicles will boost demand for energy consumption and range-focused displays.
- Cybersecurity solutions will become a priority to protect connected vehicle data.
- Emerging markets will adopt digital clusters rapidly with increasing vehicle production and income levels.
- Collaborations between automakers and tech companies will speed up product innovation.
- Cost optimization and modular platforms will make digital clusters more accessible to mass-market vehicles.

Request a Free Sample
Fill in your details and we'll send you a free sample report.
- Sample data tables & charts
- Research methodology
Market Dynamics
Growing Adoption of Advanced Driver Assistance Systems (ADAS)
The integration of ADAS features in modern vehicles requires high-resolution digital clusters to display real-time safety alerts, navigation, and vehicle diagnostics, enhancing driver awareness and road safety. Automakers are increasingly adopting digital clusters to support seamless communication between drivers and vehicle systems.
Rising Consumer Demand for Premium Vehicle Interiors
Consumers are seeking tech-driven, customizable, and visually appealing interiors, prompting automakers to integrate digital instrument clusters that offer smartphone-like experiences, advanced infotainment, and intuitive user interfaces, even in mid-range and mass-market vehicles.
Shift Toward Electric and Hybrid Vehicles
The surge in electric and hybrid vehicle production drives demand for digital clusters that can display critical information such as battery status, range estimation, and energy consumption, supporting the unique needs of EV drivers and aligning with government incentives for sustainable mobility.
Technological Advancements in Display and Connectivity
Innovations in TFT, OLED, and microLED panels, along with improved graphics processing and connectivity, enable sharper visuals, lower power consumption, and seamless integration with smartphones and cloud-based services, making digital clusters central to the evolution of the automotive cockpit.
Expansion into Mid-Range and Mass-Market Vehicles
As production scales and costs decline, digital instrument clusters are increasingly being adopted in compact and entry-level vehicles, broadening market penetration and making advanced cockpit technology accessible to a wider customer base.
Need a Custom Version of This Report?
Tailor the scope, geography, or segments to your exact requirements.
- Custom geography or segment scope
- Direct access to our analyst team
Frequently Asked Questions
What is the current market size for Digital Instrument Clusters, and what is its projected size in 2032?
At what Compound Annual Growth Rate is the Digital Instrument Clusters market projected to grow between 2025 and 2032?
Which Digital Instrument Clusters market segment held the largest share in 2024?
What are the primary factors fueling the growth of the Digital Instrument Clusters market?
Who are the leading companies in the Digital Instrument Clusters market?
Which region commanded the largest share of the Digital Instrument Clusters market in 2024?
Table of Content
Chapter 1 Market Segmentation
- 1.1 Segmentation Framework
- 1.1.1 Product and Service Classification
- 1.1.2 Application and End-Use Classification
- 1.1.3 Technology and Solution Classification
- 1.1.4 Customer and Distribution Channel Classification
- 1.1.5 Geographic Segmentation
- 1.1.6 Market Segment Definitions and Boundaries
- 1.2 By Application
- 1.2.1 Passenger Cars
- 1.2.2 Commercial Vehicles
- 1.2.3 Two-Wheelers
- 1.3 By Display Size
- 1.3.1 5-8 inch
- 1.3.2 9-11 inch
- 1.3.3 >12 inch
- 1.4 By Display Type
- 1.4.1 LCD
- 1.4.2 TFT-LCD
- 1.4.3 OLED
Chapter 2 Introduction
- 2.1 Report Objectives and Scope
- 2.2 Product Definition and Industry Terminology
- 2.3 Market Inclusions and Exclusions
- 2.4 Research Process
- 2.4.1 Primary Research and Expert Interviews
- 2.4.2 Secondary Research and Source Review
- 2.4.3 Top-Down and Bottom-Up Estimation
- 2.4.4 Data Triangulation and Verification
- 2.5 Market Size Measurement Basis
- 2.5.1 2024: USD 4,378 million → 2032: USD 18,950.5 million
- 2.6 Historical and Forecast Reference Periods
- 2.6.1 Base Year: 2024
- 2.6.2 Forecast Period: 2024-2032
- 2.7 Research Assumptions and Limitations
Chapter 3 Executive Summary
- 3.1 Market Snapshot and Key Findings
- 3.2 Base-Year Market Size, 2024
- 3.3 Forecast Market Size, 2032
- 3.4 Revenue and Volume Growth Outlook
- 3.5 Key Demand and Supply Indicators
- 3.6 Leading Market Segments
- 3.7 Fastest-Growing Market Opportunities
- 3.8 Regional Performance Highlights
- 3.9 Technology and Industry Transformation
- 3.10 Competitive Landscape Summary
- 3.11 Analyst View and Strategic Implications
Chapter 4 Global Digital Instrument Clusters Market Trends and Developments
- 4.1 Historical Industry Development
- 4.2 Recent Market Trends and Developments
- 4.3 Demand and Customer Behavior Trends
- 4.4 Technology and Product Innovation
- 4.5 Artificial Intelligence, Automation and Digitalization
- 4.6 Local Manufacturing and Supply Chain Realignment
- 4.7 Industry Partnerships, Mergers and Acquisitions
- 4.8 Sustainability and Circular Economy Developments
- 4.9 Government and Private Sector Investment Trends
- 4.10 Emerging Business Models and Commercialization
- 4.11 Industry Developments and Announcements
Chapter 5 Global Digital Instrument Clusters Market Production, Supply and Demand Analysis
- 5.1 Demand Trend and Consumption Analysis
- 5.2 Demand Forecast, 2024-2032
- 5.3 Production and Output Trend
- 5.4 Production and Output Forecast, 2024-2032
- 5.5 Installed Capacity and Capacity Utilization
- 5.6 Company-Wise Production Plants and Statistics
- 5.6.1 Installed Production Capacity
- 5.6.2 Actual Production
- 5.6.3 Planned Capacity and Expansion Targets
- 5.7 Supply Chain Structure and Procurement Trends
- 5.8 Supply-Demand Gap and Bottlenecks
- 5.9 Import Dependence and Sourcing Structure
- 5.10 Contract Manufacturing and Outsourcing
- 5.11 Regional Supply and Demand Concentration
Chapter 6 Global Digital Instrument Clusters Market Pricing Analysis
- 6.1 Pricing Structure and Measurement
- 6.2 Historical Pricing Trends
- 6.3 Pricing Outlook, 2024-2032
- 6.4 Average Selling Price and Unit Economics
- 6.5 Pricing by Product and Market Segment
- 6.6 Geographic Pricing Differences
- 6.7 Key Input, Energy, Labor and Logistics Costs
- 6.8 Contract Pricing and Purchasing Models
- 6.9 Pricing Sensitivity and Competitive Positioning
- 6.10 Price, Margin and Profitability Implications
Chapter 7 Global Digital Instrument Clusters Market Dynamics
- 7.1 Market Growth Drivers
- 7.1.1 Demand-Side Drivers
- 7.1.2 Technology and Innovation Drivers
- 7.1.3 Infrastructure and Investment Drivers
- 7.1.4 Regulatory and Policy Drivers
- 7.2 Market Restraints
- 7.2.1 Cost and Affordability Constraints
- 7.2.2 Technology and Adoption Barriers
- 7.2.3 Supply Chain and Operational Constraints
- 7.3 Market Challenges
- 7.3.1 Competitive Pressure and Margin Erosion
- 7.3.2 Skills, Infrastructure and Implementation Gaps
- 7.4 Emerging Market Opportunities
- 7.5 Market Dynamics Impact and Time-Horizon Assessment
Chapter 8 Global Digital Instrument Clusters Value Chain Analysis
- 8.1 Industry Value Chain Overview
- 8.2 Upstream Suppliers and Critical Inputs
- 8.3 Technology and Component Providers
- 8.4 Manufacturing or Service Delivery
- 8.5 Distribution, Channel Partners and Integrators
- 8.6 Downstream Applications and End Users
- 8.7 Value Addition and Profit Pools
- 8.8 Vertical Integration and Outsourcing
- 8.9 Supplier Concentration and Risk
- 8.10 Supply Chain Localization and Resilience
Chapter 9 Global Digital Instrument Clusters Market Regulations and Policies
- 9.1 Relevant Laws, Standards and Compliance Frameworks
- 9.2 Product, Service, Safety and Quality Requirements
- 9.3 Government Policies, Incentives and Subsidies
- 9.4 Imports, Exports and Trade Barriers
- 9.5 Public Procurement and Local Content Requirements
- 9.6 Environmental and Sustainability Compliance
- 9.7 Upcoming Policy Changes and Market Implications
Chapter 10 Global Digital Instrument Clusters Market Hotspots and Opportunities
- 10.1 Market Opportunity Mapping and Growth Hotspots
- 10.2 High-Growth Applications and Customer Groups
- 10.3 Underserved Markets and White-Space Opportunities
- 10.4 Emerging Technology and Product Opportunities
- 10.5 New Capacity and Investment Hotspots
- 10.6 Market Entry and Expansion Opportunities
- 10.7 Distribution and Partnership Opportunities
- 10.8 Near-Term and Long-Term Commercial Potential
- 10.9 Opportunity Attractiveness and Execution Risks
Chapter 11 Global Digital Instrument Clusters Market Outlook, 2024-2032
- 11.1 Market Size and Analysis
- 11.1.1 Revenue (Market Measurement: 2024: USD 4,378 million → 2032: USD 18,950.5 million)
- 11.1.2 Market Volume and Quantity Sold
- 11.1.3 Historical Market Size
- 11.1.4 Base-Year Market Size, 2024
- 11.2 Market Forecast, 2024-2032
- 11.2.1 Revenue Forecast to 2032
- 11.2.2 Volume Forecast to 2032
- 11.2.3 CAGR and Year-on-Year Growth
- 11.2.4 Incremental Revenue Opportunity
- 11.3 Forecast Assumptions and Scenario Analysis
- 11.3.1 Base-Case Forecast
- 11.3.2 Optimistic and Conservative Scenarios
- 11.3.3 Technology, Pricing and Policy Sensitivities
- 11.4 Market Attractiveness and Growth Outlook
Chapter 12 Global Digital Instrument Clusters Market Segmentation and Outlook
- 12.1 Segmentation Summary and Market Shares, 2024
- 12.2 Largest and Fastest-Growing Segments
- 12.3 By Application - Market Size and Forecast, 2024-2032
- 12.3.1 Segment Definition and Scope
- 12.3.2 Historical Market Size
- 12.3.3 Revenue Forecast, 2024-2032
- 12.3.4 Volume Forecast, 2024-2032
- 12.3.5 Base-Year Market Share, 2024
- 12.3.6 Segment CAGR and Growth Drivers
- 12.3.7 Subsegment Market Size and Forecast
- 12.3.7.1 Passenger Cars
- 12.3.7.2 Commercial Vehicles
- 12.3.7.3 Two-Wheelers
- 12.3.8 Subsegment Pricing and Adoption Trends
- 12.3.9 Leading Suppliers and Competition
- 12.3.10 Regional Demand and Opportunities
- 12.4 By Display Size - Market Size and Forecast, 2024-2032
- 12.4.1 Segment Definition and Scope
- 12.4.2 Historical Market Size
- 12.4.3 Revenue Forecast, 2024-2032
- 12.4.4 Volume Forecast, 2024-2032
- 12.4.5 Base-Year Market Share, 2024
- 12.4.6 Segment CAGR and Growth Drivers
- 12.4.7 Subsegment Market Size and Forecast
- 12.4.7.1 5-8 inch
- 12.4.7.2 9-11 inch
- 12.4.7.3 >12 inch
- 12.4.8 Subsegment Pricing and Adoption Trends
- 12.4.9 Leading Suppliers and Competition
- 12.4.10 Regional Demand and Opportunities
- 12.5 By Display Type - Market Size and Forecast, 2024-2032
- 12.5.1 Segment Definition and Scope
- 12.5.2 Historical Market Size
- 12.5.3 Revenue Forecast, 2024-2032
- 12.5.4 Volume Forecast, 2024-2032
- 12.5.5 Base-Year Market Share, 2024
- 12.5.6 Segment CAGR and Growth Drivers
- 12.5.7 Subsegment Market Size and Forecast
- 12.5.7.1 LCD
- 12.5.7.2 TFT-LCD
- 12.5.7.3 OLED
- 12.5.8 Subsegment Pricing and Adoption Trends
- 12.5.9 Leading Suppliers and Competition
- 12.5.10 Regional Demand and Opportunities
- 12.6 Segment Growth Comparison
- 12.7 Segment Attractiveness and Priority Matrix
Chapter 13 Global Digital Instrument Clusters End-Use and Application Market Outlook
- 13.1 End-Use Industry and Customer Demand Structure
- 13.2 Leading Applications and Customer Groups
- 13.3 End-Use Market Size, Share and Forecast
- 13.4 Major End-Use Industry Deep Dives
- 13.4.1 Customer Requirements and Use Cases
- 13.4.2 Demand and Replacement Cycles
- 13.4.3 Technical and Regulatory Considerations
- 13.4.4 Purchasing and Procurement Models
- 13.4.5 Leading Vendors and Distribution Channels
- 13.4.6 Forecast and Commercial Opportunities
- 13.5 Emerging Applications and Cross-Segment Demand
- 13.6 End-Use Industry Investment Priorities
Chapter 14 Global Digital Instrument Clusters Geographic Market Outlook, 2024-2032
- 14.1 Regional Market Size and Share, 2024
- 14.2 Regional Market Forecast, 2024-2032
- 14.3 Regional Pricing, Production and Demand Differences
- 14.4 North America
- 14.4.1 United States
- 14.4.2 Canada
- 14.4.3 Mexico
- 14.5 Europe
- 14.5.1 Germany
- 14.5.2 France
- 14.5.3 Italy
- 14.5.4 United Kingdom
- 14.5.5 Spain
- 14.5.6 Poland
- 14.5.7 Russia
- 14.5.8 Netherlands
- 14.5.9 Belgium
- 14.5.10 Sweden
- 14.5.11 Denmark
- 14.5.12 Norway
- 14.5.13 Rest of Europe
- 14.6 Asia Pacific
- 14.6.1 China
- 14.6.2 India
- 14.6.3 Japan
- 14.6.4 South Korea
- 14.6.5 Thailand
- 14.6.6 Indonesia
- 14.6.7 Vietnam
- 14.6.8 Malaysia
- 14.6.9 Australia
- 14.6.10 Rest of Asia Pacific
- 14.7 Latin America
- 14.7.1 Brazil
- 14.7.2 Argentina
- 14.7.3 Colombia
- 14.7.4 Chile
- 14.7.5 Rest of Latin America
- 14.8 Middle East
- 14.8.1 Saudi Arabia
- 14.8.2 United Arab Emirates
- 14.8.3 Turkey
- 14.8.4 Israel
- 14.8.5 Iran
- 14.8.6 Rest of the Middle East
- 14.9 Africa
- 14.9.1 South Africa
- 14.9.2 Egypt
- 14.9.3 Nigeria
- 14.9.4 Morocco
- 14.9.5 Rest of Africa
- 14.10 Regional Investment, Policy and Supply Chain Differences
- 14.11 Regional Competitive Landscape
- 14.12 Geographic Growth Hotspots
Chapter 15 Global Digital Instrument Clusters Technology, Innovation and Sustainability Outlook
- 15.1 Technology Landscape and Maturity
- 15.2 Product, Process and Service Innovation
- 15.3 AI, Automation and Digital Tools in the Industry
- 15.4 Technology Adoption and Performance Benchmarking
- 15.5 Innovation Pipeline and R&D Investment
- 15.6 Patent and Intellectual Property Trends
- 15.7 Energy Efficiency and Resource Management
- 15.8 Sustainability, Recycling and Circularity
- 15.9 Technology Roadmap, 2024-2032
- 15.10 Risks of Obsolescence and Technology Substitution
Chapter 16 Global Digital Instrument Clusters Market Key Strategic Imperatives
- 16.1 Growth and Market Entry Priorities
- 16.2 High-Return Products and Segments
- 16.3 Pricing, Profitability and Cost Optimization
- 16.4 Technology Investment and Product Differentiation
- 16.5 Supply Chain Localization and Resilience
- 16.6 Distribution and Customer Acquisition
- 16.7 Partnership, Acquisition and Capacity Strategy
- 16.8 Regional Expansion Priorities
- 16.9 Short-, Medium- and Long-Term Actions
Chapter 17 Competition Outlook
- 17.1 Industry Competition Characteristics
- 17.2 Market Structure and Concentration
- 17.3 Market Share and Competitive Positioning, 2024
- 17.4 Company-Wise Revenue and Product Benchmarking
- 17.5 Production and Service Capacity Benchmarking
- 17.6 Technology, Pricing and Differentiation
- 17.7 Regional Footprint and Distribution Strength
- 17.8 Mergers, Acquisitions and Strategic Alliances
- 17.9 New Entrants and Competitive Threats
- 17.10 Porter's Five Forces and Industry Attractiveness
- 17.11 Competitive Outlook, 2024-2032
Chapter 18 Company Profiles
- 18.1 Company Coverage and Selection Criteria
- 18.2 Continental
- 18.2.1 Business Description
- 18.2.2 Company Ownership and Geographic Presence
- 18.2.3 Product and Service Portfolio
- 18.2.4 Manufacturing and Operating Footprint
- 18.2.5 Production Capacity and Expansion Plans
- 18.2.6 Financial Performance and Investment
- 18.2.7 Market Share and Competitive Position
- 18.2.8 Technology and Innovation Capabilities
- 18.2.9 Strategic Alliances or Partnerships
- 18.2.10 Recent Developments
- 18.2.11 Growth Strategy and Outlook
- 18.3 Bosch
- 18.4 Denso
- 18.5 Hyundai Mobis
- 18.6 Samsung Electronics
- 18.7 Valeo
- 18.8 Yanfeng Automotive Electronics
- 18.9 Pioneer
- 18.10 Clarion
- 18.11 Veoneer
- 18.12 Other Relevant Market Participants
Note: Every listed company is profiled on the structure shown under the first company. The company list is preliminary and may change based on research findings, market developments, data availability and client requirements.
Chapter 19 Disclaimer
- 19.1 Research and Forecast Disclaimer
- 19.2 Data Source and Estimation Limitations
Note: The depth of individual sections depends on data availability for this market. Volume, capacity, trade and other unit-based metrics are included where applicable.

