Market Overview:
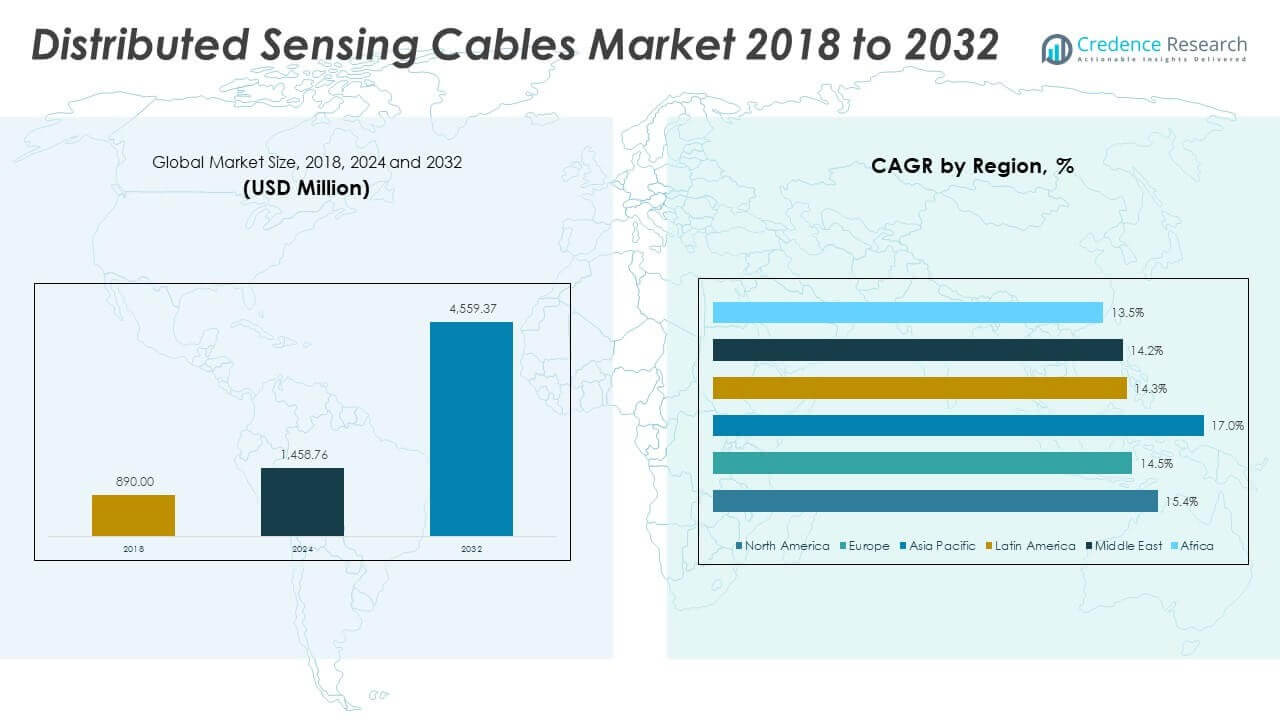
The Distributed Sensing Cables Market size was valued at USD 890.00 million in 2018 to USD 1,458.76 million in 2024 and is anticipated to reach USD 4,559.37 million by 2032, at a CAGR of 15.38% during the forecast period.
| REPORT ATTRIBUTE |
DETAILS |
| Historical Period |
2020-2023 |
| Base Year |
2024 |
| Forecast Period |
2025-2032 |
| Distributed Sensing Cables Market Size 2024 |
USD 1,458.76 Million |
| Distributed Sensing Cables Market, CAGR |
15.38% |
| Distributed Sensing Cables Market Size 2032 |
USD 4,559.37 Million |
The market growth is driven by rising demand for advanced monitoring solutions across industries such as oil and gas, power, and infrastructure. Distributed sensing cables enhance real-time data collection for temperature, strain, and acoustic signals, enabling predictive maintenance and improved safety. Increasing focus on operational efficiency, stricter regulatory standards, and higher investments in smart infrastructure projects further support adoption. Expanding use in perimeter security, pipeline monitoring, and structural health monitoring also drives market momentum.
Geographically, North America and Europe hold strong positions due to established oil and gas networks, advanced infrastructure, and higher adoption of safety regulations. Asia-Pacific is emerging as the fastest-growing region, fueled by rapid industrialization, urbanization, and government-backed smart infrastructure projects in China and India. The Middle East also shows growing demand, particularly in pipeline monitoring, while Latin America is gradually adopting distributed sensing technology in energy and mining operations.
Market Insights:
- The Distributed Sensing Cables Market was valued at USD 890.00 million in 2018, reached USD 1,458.76 million in 2024, and is projected to reach USD 4,559.37 million by 2032, at a CAGR of 15.38%.
- North America held 39.87% share in 2024, followed by Europe with 23.47% and Asia Pacific with 22.38%, driven by advanced infrastructure, strict regulations, and large-scale industrial investments.
- Asia Pacific is the fastest-growing region with a 17.0% CAGR and 22.38% share in 2024, supported by rapid urbanization, smart city projects, and strong renewable energy adoption.
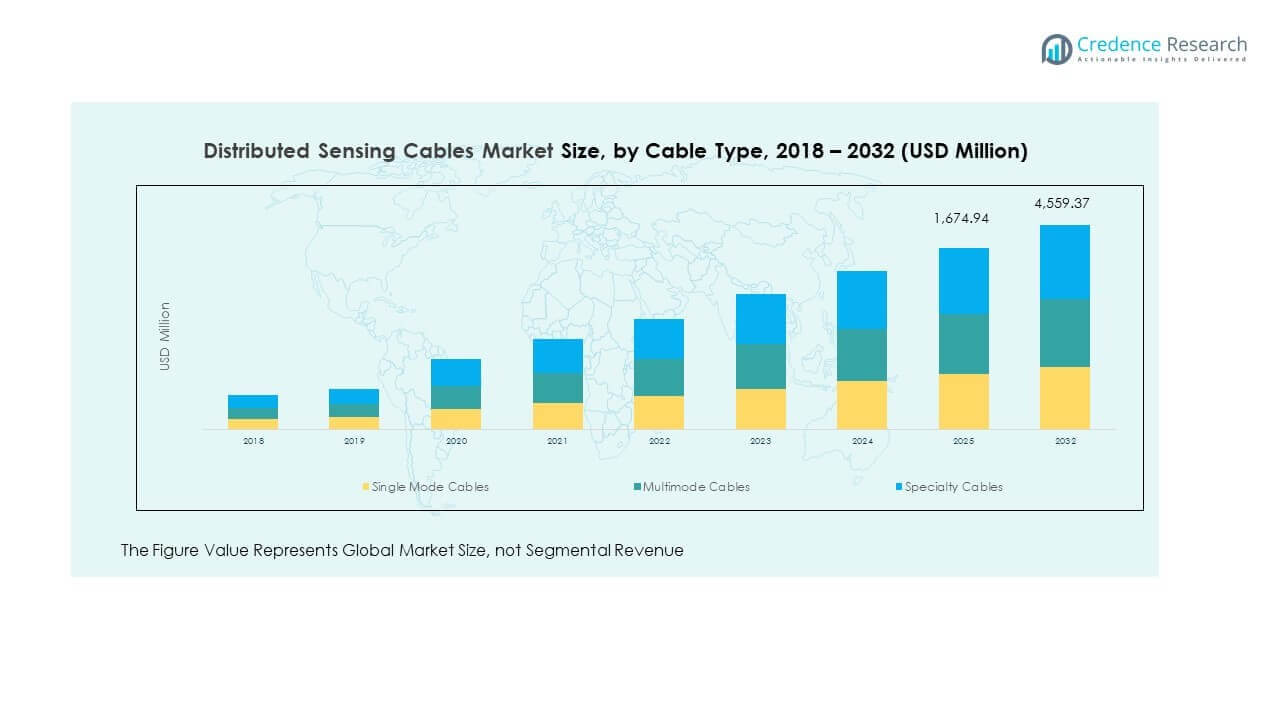
- From the cable type analysis, single mode cables contributed 46% of the total market in 2024, reflecting their dominance in long-distance and high-accuracy applications.
- Multimode cables held 37% share in 2024, while specialty cables represented 17%, addressing niche requirements in defense, aerospace, and extreme industrial environments.
Access crucial information at unmatched prices!
Request your sample report today & start making informed decisions powered by Credence Research Inc.!
Download Sample
Market Drivers:
Rising Importance of Real-Time Monitoring Across Critical Sectors
The Distributed Sensing Cables Market is experiencing strong growth due to rising demand for real-time monitoring in oil and gas, power, and infrastructure sectors. It provides critical insights into temperature, strain, and acoustic parameters, allowing operators to identify risks early and ensure asset reliability. Governments enforce stricter regulations on pipeline safety, pushing companies to adopt advanced sensing solutions. Operators in energy and utilities integrate these cables into predictive maintenance systems to reduce downtime and operational hazards. Growing awareness of safety standards and the need to avoid accidents further strengthen the demand. Infrastructure modernization projects across developed economies create consistent adoption opportunities.
- For example, a 2025 study published in PMC confirmed that Distributed Acoustic Sensing (DAS) detected simulated gas pipeline leaks in real time using a 21-meter steel pipeline testbed. The system successfully identified leak sizes as small as ¼ inch under varying flow conditions, demonstrating its reliability for non-intrusive leak detection.
Expanding Integration in Smart Infrastructure and Urban Development
The shift toward smart infrastructure drives adoption of distributed sensing technologies at large scale. The Distributed Sensing Cables Market benefits from increasing government-backed initiatives in urban planning, metro rail systems, and highway monitoring. It enables continuous condition monitoring of bridges, tunnels, and other assets, ensuring structural safety. Cities with dense populations require reliable networks that improve efficiency and resilience, making sensing solutions critical. Smart grid expansion projects also accelerate uptake by supporting high-voltage power line monitoring. Growing construction of underground facilities and smart transportation corridors create consistent application opportunities. Energy efficiency targets in urban projects align with sensing-based monitoring systems.
Rising Oil and Gas Exploration and Pipeline Network Expansion
The energy sector represents a vital driver for distributed sensing adoption. The Distributed Sensing Cables Market is gaining traction with increased investments in oil exploration and pipeline expansions. It allows operators to continuously monitor long pipelines for leaks, intrusions, or failures. Companies reduce operational risks and maintenance costs by deploying such systems. Rising global energy consumption places pressure on pipeline operators to ensure safe and efficient supply. Emerging economies expand their oil and gas infrastructure, further fueling adoption. The cables enhance visibility in remote or hazardous environments where manual inspection is costly or unsafe. Their capacity to integrate with automated systems strengthens their value proposition.
Strong Push for Industrial Safety and Operational Efficiency
Growing emphasis on safety standards across multiple industries positions distributed sensing as a vital technology. The Distributed Sensing Cables Market benefits from operators prioritizing workplace safety and productivity in energy, transportation, and manufacturing. It ensures early fault detection and reduces downtime across critical systems. Many industries invest in advanced sensing to avoid financial losses from operational failures. Governments worldwide impose stricter regulations on industrial safety, further driving deployment. The technology’s ability to provide continuous coverage over large distances strengthens adoption. Large-scale projects in mining, power distribution, and offshore facilities integrate these cables for better resilience. Their role in reducing human intervention and improving cost efficiency also accelerates uptake across global industries.
- For example, AP Sensing’s distributed acoustic sensing (DAS) and distributed temperature sensing (DTS) systems are deployed for real-time monitoring of critical power infrastructure. Their solutions cover sensing ranges beyond 100 kilometers, enabling continuous remote detection of events to enhance safety, reduce manual intervention, and improve operational reliability.
Market Trends:
Increasing Role of Artificial Intelligence in Distributed Sensing Solutions
A key trend shaping the Distributed Sensing Cables Market is the integration of artificial intelligence for advanced data interpretation. It enables operators to analyze massive datasets collected from distributed cables with greater speed and accuracy. AI enhances fault detection, predictive maintenance, and response planning across industries. Smart algorithms reduce false alarms and improve system reliability for large-scale infrastructure. In energy networks, AI improves risk prediction in pipelines and transmission lines. It also facilitates better decision-making in construction and urban monitoring projects. Machine learning tools expand use cases by adapting to diverse operating conditions. The fusion of AI with sensing technology ensures long-term efficiency and market expansion.
- For example, the U.S. Department of Energy’s National Energy Technology Laboratory (NETL) is collaborating with the University of Pittsburgh and Hope Gas to advance AI-driven distributed fiber-optic sensor (DFOS) systems for detecting and quantifying hydrogen emissions in pipeline infrastructure.
Growing Application in Renewable Energy and Sustainable Infrastructure
Renewable energy projects are increasingly incorporating distributed sensing technology. The Distributed Sensing Cables Market is witnessing rising adoption in wind farms, solar projects, and hydroelectric plants. It ensures efficient monitoring of assets that must withstand harsh conditions. Wind turbine foundations and underwater power cables rely on sensing systems for early issue detection. Solar farms deploy cables to optimize panel alignment and ensure long-term performance. Governments worldwide encourage sustainable energy development, reinforcing adoption in this sector. Long-distance grid connections for renewable energy also require robust sensing solutions. Sustainability initiatives globally make distributed sensing an essential part of future energy networks.
- For example, a California Energy Commission–funded project in 2025 integrated distributed fiber-optic sensing for real-time monitoring of floating offshore wind systems. This initiative focused on tracking wind tower integrity, monitoring gearbox strain with high resolution, and detecting marine mammal activity using distributed acoustic sensing.
Expansion of Defense and Security Applications for Border and Perimeter Monitoring
Defense and homeland security agencies increasingly use distributed sensing systems for surveillance. The Distributed Sensing Cables Market benefits from adoption in border protection, military bases, and critical infrastructure. It provides accurate detection of intrusions over vast perimeters. Governments invest heavily in security modernization programs, creating new opportunities. Advanced sensing technology ensures 24/7 monitoring, even in remote or high-risk locations. Integration with smart command centers strengthens its operational relevance. Growing security threats worldwide push agencies to adopt solutions that combine resilience with accuracy. Sensing cables continue to emerge as a crucial layer of national defense systems.
Advancements in Fiber Optic Technology and Sensor Design Innovation
Continuous innovation in fiber optic cables strengthens distributed sensing applications. The Distributed Sensing Cables Market benefits from cables with higher sensitivity, longer ranges, and better durability. These advancements allow reliable monitoring across extreme environments such as offshore rigs or high-voltage corridors. Manufacturers invest in R&D to design cables capable of detecting multiple parameters simultaneously. Innovations in compact sensor modules make deployment more cost-effective. The rise of hybrid cables that integrate data and power transmission further increases adoption. Long-life cables reduce replacement cycles and strengthen return on investment. These advancements ensure broader industry penetration and greater market competitiveness.
Market Challenges Analysis:
High Deployment Costs and Integration Complexity Limiting Adoption
The Distributed Sensing Cables Market faces barriers due to high initial deployment costs. It requires significant investment in fiber optic systems, advanced monitoring equipment, and software platforms. Small and medium enterprises find adoption challenging due to limited budgets. Integration into existing infrastructure often demands specialized expertise, raising project complexity. Companies in developing regions face additional barriers due to limited technical knowledge. Long installation timelines and maintenance requirements also hinder rapid adoption. Limited awareness among end-users about operational benefits creates slower uptake. These factors collectively pose obstacles to widespread deployment across industries.
Regulatory Uncertainty and Limited Standardization Affecting Growth
Another critical challenge is the absence of uniform standards and regulatory clarity. The Distributed Sensing Cables Market operates in sectors governed by strict safety rules, yet guidelines vary by region. Lack of harmonized frameworks complicates deployment across global industries. Some countries have inconsistent certification processes, slowing adoption. The absence of standard testing protocols reduces customer confidence. Operators often hesitate to invest without clear regulatory support. Emerging economies face further delays due to evolving policies. This regulatory fragmentation limits growth potential and creates uncertainty in international markets.
Market Opportunities:
Rising Demand in Smart Cities and Infrastructure Modernization
Smart city initiatives create strong opportunities for distributed sensing adoption. The Distributed Sensing Cables Market benefits from increasing investments in intelligent transportation, metro systems, and underground utilities. It ensures constant monitoring of assets that support urban resilience. Governments emphasize sustainability and safety in urban design, making sensing solutions highly relevant. Large-scale infrastructure modernization in both developed and emerging regions ensures continuous demand. Urban growth requires advanced monitoring systems to maintain efficiency. The rising integration of sensing cables into smart grids further drives growth potential.
Expanding Scope in Renewable Energy and Environmental Monitoring
The shift toward clean energy opens fresh opportunities for sensing solutions. The Distributed Sensing Cables Market is expected to gain from adoption in offshore wind farms, hydropower facilities, and solar projects. It ensures reliable monitoring of renewable assets exposed to challenging conditions. Growing environmental monitoring needs in forest conservation, water management, and seismic analysis enhance usage. Rising investments in eco-friendly technologies align with distributed sensing applications. Governments and private players fund advanced monitoring to meet sustainability goals. Expanding green energy projects and environmental initiatives strengthen the long-term opportunities for the market.
Market Segmentation Analysis:
The Distributed Sensing Cables Market is segmented
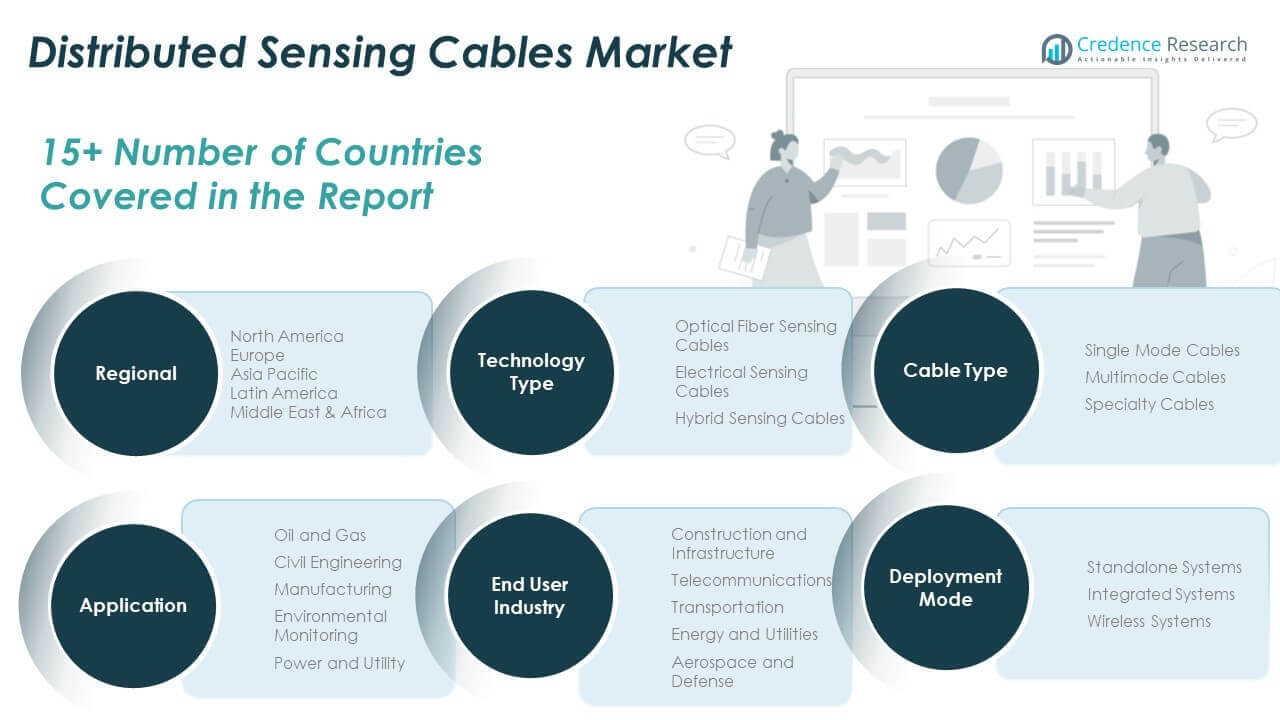
By technology type, into optical fiber sensing cables, electrical sensing cables, and hybrid sensing cables. Optical fiber sensing cables dominate due to their precision, reliability, and suitability for long-distance monitoring. Electrical sensing cables hold relevance in specific industrial applications where cost efficiency matters. Hybrid sensing cables are gaining traction, offering flexibility by combining electrical and optical benefits to serve complex monitoring requirements. Each technology type addresses different operational needs, shaping adoption across industries.
- For example, Sinclair Digital’s AGILE-CORE™ StrandWise™ hybrid cables combine copper conductors and fiber strands in a single solution, providing high-speed data and power delivery for smart building and industrial automation infrastructure. This hybrid cabling is valuable for network and automation needs where both electrical and optical technologies are required.
By cable type, the market includes single mode, multimode, and specialty cables. Single mode cables lead in usage for long-range applications requiring high accuracy. Multimode cables serve short-distance, cost-sensitive projects where efficiency is prioritized. Specialty cables are emerging as a niche category, tailored for extreme conditions in defense and energy operations. This diversity supports broad application coverage.
By end-user industry, adoption spans construction and infrastructure, telecommunications, transportation, energy and utilities, and aerospace and defense. Energy and utilities lead the demand due to continuous monitoring needs in power distribution and pipelines. Construction and infrastructure also represent a fast-expanding segment driven by smart city projects. Telecommunications and aerospace rely on sensing for network and system safety.
- For example, NEC’s Fiber Optic Smart Sensing Solutions utilize distributed sensing deployed over standard telecom networks, enabling real-time cable health and environmental monitoring for telecom operators.
By application, the market is further segmented by application into oil and gas, civil engineering, manufacturing, environmental monitoring, and power and utility. Oil and gas remain the strongest application area, while environmental monitoring is expanding with sustainability initiatives.
By deployment mode, standalone, integrated, and wireless systems provide operators with scalable, flexible solutions across diverse projects.
Segmentation:
By Technology Type
- Optical Fiber Sensing Cables
- Electrical Sensing Cables
- Hybrid Sensing Cables
By Cable Type
- Single Mode Cables
- Multimode Cables
- Specialty Cables
By End-User Industry
- Construction and Infrastructure
- Telecommunications
- Transportation
- Energy and Utilities
- Aerospace and Defense
By Application
- Oil and Gas
- Civil Engineering
- Manufacturing
- Environmental Monitoring
- Power and Utility
By Deployment Mode
- Standalone Systems
- Integrated Systems
- Wireless Systems
By Region
- North America
- Europe
- UK
- France
- Germany
- Italy
- Spain
- Russia
- Belgium
- Netherlands
- Austria
- Sweden
- Poland
- Denmark
- Switzerland
- Rest of Europe
- Asia Pacific
- China
- Japan
- South Korea
- India
- Australia
- Thailand
- Indonesia
- Vietnam
- Malaysia
- Philippines
- Taiwan
- Rest of Asia Pacific
- Latin America
- Brazil
- Argentina
- Peru
- Chile
- Colombia
- Rest of Latin America
- Middle East
- UAE
- KSA
- Israel
- Turkey
- Iran
- Rest of Middle East
- Africa
- Egypt
- Nigeria
- Algeria
- Morocco
- Rest of Africa
Regional Analysis:
North America
The North America Distributed Sensing Cables Market size was valued at USD 358.85 million in 2018 to USD 581.74 million in 2024 and is anticipated to reach USD 1,816.01 million by 2032, at a CAGR of 15.4% during the forecast period. North America holds a market share of 39.87% in 2024, making it the leading region. The Distributed Sensing Cables Market in this region benefits from strong oil and gas pipeline networks and advanced infrastructure projects. It is driven by strict regulatory standards for safety and environmental monitoring. Energy utilities integrate distributed sensing to ensure system reliability and reduce risks in high-voltage networks. The U.S. remains the largest contributor, supported by continuous investment in smart grid modernization. Canada and Mexico also adopt sensing solutions in energy and transportation projects. High awareness and technological readiness sustain strong adoption rates across industries.
Europe
The Europe Distributed Sensing Cables Market size was valued at USD 218.05 million in 2018 to USD 342.48 million in 2024 and is anticipated to reach USD 1,006.49 million by 2032, at a CAGR of 14.5% during the forecast period. Europe accounts for 23.47% of the global market share in 2024. The Distributed Sensing Cables Market here is driven by regulatory emphasis on industrial safety and sustainable infrastructure. Strong demand comes from energy utilities modernizing their grids and oil networks. It is also fueled by growing smart city projects across Germany, France, and the UK. Advanced construction practices in transportation corridors and civil infrastructure strengthen regional adoption. Aerospace and defense sectors contribute further, focusing on perimeter monitoring and high-reliability systems. Investments in renewable energy integration increase demand for advanced sensing technology.
Asia Pacific
The Asia Pacific Distributed Sensing Cables Market size was valued at USD 189.57 million in 2018 to USD 326.54 million in 2024 and is anticipated to reach USD 1,141.21 million by 2032, at a CAGR of 17.0% during the forecast period. Asia Pacific represents 22.38% of the global market share in 2024. The Distributed Sensing Cables Market in this region is expanding rapidly with large-scale infrastructure and energy projects. China leads adoption with extensive urbanization and investments in power distribution. India follows with strong demand in oil and gas exploration and construction activities. Japan and South Korea leverage distributed sensing in advanced transportation systems and defense. Growing renewable energy capacity across the region further stimulates demand. It is also driven by industrialization in Southeast Asia, creating new opportunities. Strong government support for safety and digitalization enhances growth prospects.
Latin America
The Latin America Distributed Sensing Cables Market size was valued at USD 55.18 million in 2018 to USD 89.55 million in 2024 and is anticipated to reach USD 259.29 million by 2032, at a CAGR of 14.3% during the forecast period. Latin America accounts for 6.14% of the global market share in 2024. The Distributed Sensing Cables Market is influenced by growing investments in oil and gas exploration across Brazil and Argentina. It supports critical monitoring of long pipeline networks in the energy sector. Construction and civil engineering projects across urban hubs contribute to rising adoption. Telecommunication upgrades in regional economies add to demand for sensing solutions. Mining operations also integrate distributed sensing to improve safety and efficiency. The market faces challenges in limited awareness and cost barriers, but momentum continues with new industrial initiatives. It holds potential for long-term expansion in energy and infrastructure.
Middle East
The Middle East Distributed Sensing Cables Market size was valued at USD 40.05 million in 2018 to USD 62.13 million in 2024 and is anticipated to reach USD 178.30 million by 2032, at a CAGR of 14.2% during the forecast period. Middle East holds 4.26% of the global market share in 2024. The Distributed Sensing Cables Market is supported by extensive oil and gas pipeline networks in GCC countries. It plays a vital role in leak detection, intrusion prevention, and environmental safety. Governments prioritize adoption to ensure energy supply stability. Israel and Turkey also show adoption in defense and smart infrastructure projects. Investments in mega infrastructure developments create consistent opportunities. The region benefits from high reliance on energy exports, reinforcing sensing requirements. It is expected to maintain steady growth as technology adoption spreads across industrial applications.
Africa
The Africa Distributed Sensing Cables Market size was valued at USD 28.30 million in 2018 to USD 56.31 million in 2024 and is anticipated to reach USD 158.07 million by 2032, at a CAGR of 13.5% during the forecast period. Africa accounts for 2.88% of the global market share in 2024. The Distributed Sensing Cables Market in Africa is at an early stage but expanding steadily. South Africa drives adoption with demand from energy and mining sectors. Egypt also invests in infrastructure modernization and oil monitoring systems. Broader regional growth comes from telecommunications expansion and urban development initiatives. Limited awareness and cost constraints remain challenges for faster penetration. It is positioned to benefit from foreign investments in oil, gas, and infrastructure. Gradual improvements in industrial safety standards are expected to encourage further deployment.
Shape Your Report to Specific Countries or Regions & Enjoy 30% Off!
Key Player Analysis:
- Prysmian Group
- Nexans
- Coing
- NKT
- Leoni
- HELUKABEL
- Lyudinovokabel
- Lapp Group
- Tongguang Electronic
- Yokogawa Electric
- Hansen
- Anixter
Competitive Analysis:
The Distributed Sensing Cables Market features strong competition with established global players and emerging regional firms. Leading companies such as Prysmian Group, Nexans, NKT, and Leoni dominate with extensive portfolios in optical fiber and specialty cables. It is characterized by continuous innovation, with firms investing in advanced hybrid solutions and durable designs for extreme conditions. Strategic moves including mergers, acquisitions, and regional expansions strengthen competitive positioning. Companies target high-growth sectors like oil and gas, renewable energy, and infrastructure to capture market share. R&D investment remains a priority, enabling improved accuracy, efficiency, and long-distance monitoring capabilities. Regional firms compete by offering cost-effective solutions tailored to local industries, creating diversity in product offerings. Strong emphasis on partnerships with utilities, defense, and telecommunications operators supports long-term contracts and market stability.
Recent Developments:
- In July 2025, Leoni announced the successful sale of its Automotive Cable Solutions division to Time Interconnect Group of Hong Kong. This transaction ensures continued focus on innovative, high-quality sensor and distributed sensing cable production under the new brand Leoni Cable Solutions, with the company stressing its ongoing commitment to technological progress and financial stability.
- In March 2025, NKT launched an integrated cable monitoring platform tailored for real-time health and threat monitoring of both onshore and offshore power cables, which marks a significant development in distributed sensing solutions for the energy sector.
Report Coverage:
The research report offers an in-depth analysis based on Technology Type, Cable Type, End-User Industry, Application and Deployment Mode. It details leading market players, providing an overview of their business, product offerings, investments, revenue streams, and key applications. Additionally, the report includes insights into the competitive environment, SWOT analysis, current market trends, as well as the primary drivers and constraints. Furthermore, it discusses various factors that have driven market expansion in recent years. The report also explores market dynamics, regulatory scenarios, and technological advancements that are shaping the industry. It assesses the impact of external factors and global economic changes on market growth. Lastly, it provides strategic recommendations for new entrants and established companies to navigate the complexities of the market.
Future Outlook:
- The Distributed Sensing Cables Market will expand significantly with strong adoption across energy, utilities, and infrastructure projects.
- Rising demand for predictive maintenance solutions will boost long-term growth in industrial applications.
- Oil and gas exploration will remain a key driver, supported by global investments in pipeline networks.
- Smart city initiatives and infrastructure modernization will create sustained demand for sensing solutions.
- Advancements in fiber optic technology will enhance accuracy, range, and cost efficiency of distributed sensing.
- Renewable energy projects, particularly wind and solar, will increase adoption of distributed sensing cables.
- Defense and security applications will broaden as governments prioritize border and perimeter monitoring.
- Emerging markets in Asia Pacific and Latin America will accelerate growth through rapid industrialization.
- High R&D investment by leading players will drive innovation in hybrid and specialty cable solutions.
- Regulatory focus on safety and environmental compliance will strengthen market opportunities worldwide.


