Market Overview
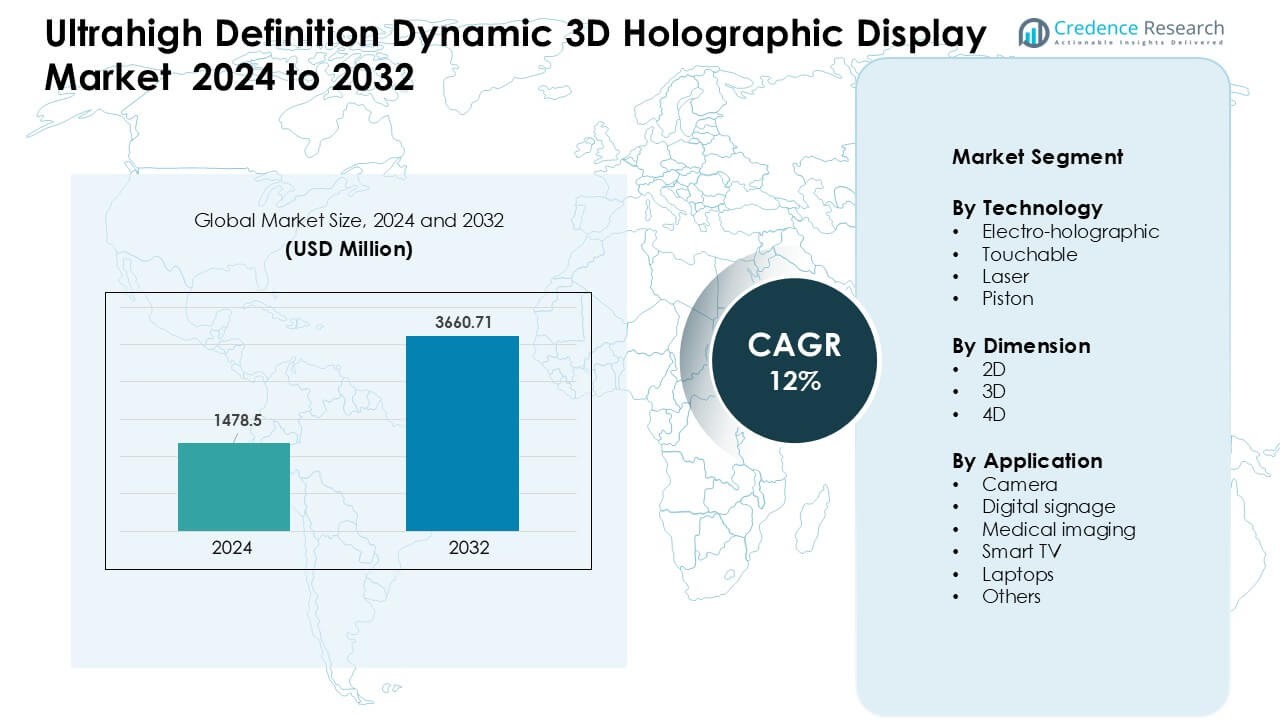
Ultrahigh Definition Dynamic 3D Holographic Display Market was valued at USD 1478.5 million in 2024 and is anticipated to reach USD 3660.71 million by 2032, growing at a CAGR of 12 % during the forecast period.
| REPORT ATTRIBUTE |
DETAILS |
| Historical Period |
2020-2023 |
| Base Year |
2024 |
| Forecast Period |
2025-2032 |
| Ultrahigh Definition Dynamic 3D Holographic Display Market Size 2024 |
USD 1478.5 Million |
| Ultrahigh Definition Dynamic 3D Holographic Display Market, CAGR |
12 % |
| Ultrahigh Definition Dynamic 3D Holographic Display Market Size 2032 |
USD 3660.71 Million |
The Ultrahigh Definition Dynamic 3D Holographic Display Market is shaped by prominent players such as MDH Hologram, Light Field Lab, Inc., Musion IP Limited, Looking Glass, HYPERVSN, Nanjing DSeeLab Digital Technology Co.,Ltd., Realfiction, Leia Display System, EON Reality, and HoloTech Switzerland AG. These companies drive advancements in high-resolution projection, light-field imaging, and interactive holography used in retail, medical visualization, engineering, and entertainment. North America leads the global market with a 38% share, supported by strong technology investment, rapid enterprise adoption, and continuous R&D activity across major commercial and healthcare sectors.
Access crucial information at unmatched prices!
Request your sample report today & start making informed decisions powered by Credence Research Inc.!
Download Sample
Market Insights
- The Ultrahigh Definition Dynamic 3D Holographic Display Market was valued at USD 1478.5 million in 2024 and is projected to reach USD 3660.71 million by 2032, growing at a CAGR of 12%.
- Strong market growth comes from rising demand for immersive visualization in retail, medical imaging, and enterprise training, supported by rapid improvements in laser projection and light-field technology.
- Key trends include adoption of AI-driven rendering, touch-free interaction, and rising use of holographic modules in smart TVs, laptops, and digital signage, along with expanding deployment in entertainment venues.
- The competitive landscape includes major players such as MDH Hologram, Light Field Lab, HYPERVSN, Looking Glass, Musion IP Limited, Realfiction, and others, focusing on higher resolution, improved brightness, and scalable commercial systems.
- North America leads the market with a 38% share, followed by Asia-Pacific at 29% and Europe at 27%, while 3D holographic technology dominates the segment mix due to strong adoption across media, healthcare, and engineering applications.
 Market Segmentation Analysis:
By Technology
Electro-holographic systems held the dominant share in 2024 due to strong use in large-format displays and high-contrast visualization. These systems support precise light control, which improves clarity for retail, medical, and engineering uses. Rising demand for immersive product showcases and expanding R&D in diffraction-based modulators strengthened adoption. Laser holography grew fast as brands used brighter projections for events and advertising. Touchable and piston technologies advanced in niche spaces where interactive surfaces and mechanical depth cues added value for training and design workflows.
- For instance, industry data indicates that the 3D dimension segment captured the maximum share of the holographic‑display market in recent years.
By Dimension
3D displays led the market in 2024 with wide use across entertainment, retail, and medical visualization. The format delivered strong depth perception without wearables, which increased placement in signage, product demos, and surgical simulation. Demand rose as firms used realistic models for education and industrial design. 4D solutions gained traction through motion-based depth and sensory cues, while 2D formats supported entry-level users that needed simple holographic effects for branding and compact displays.
- For instance, laser‑based displays saw increasing use in bright projections for events and advertising, while touchable/piston‑based interactive hologram solutions attracted interest for design workflows and training environments.
By Application
Digital signage held the largest share in 2024 as brands used holographic displays to draw higher foot traffic and enhance product engagement. Retailers, airports, and event organizers adopted the technology for high-impact visuals and dynamic content rotation. Medical imaging expanded as hospitals tested holographic models for surgical planning and anatomy instruction. Smart TVs and laptops saw early adoption in premium segments, while cameras and other uses benefited from rising interest in mixed-reality capture and compact holographic projection.
Key Growth Drivers
Rising Demand for Immersive Visualization
Growing interest in immersive experiences drives strong adoption of ultrahigh-definition dynamic 3D holographic displays. Brands use holograms to attract customers, improve product demos, and boost engagement across retail, automotive showrooms, and entertainment venues. Many medical and engineering teams also prefer holographic visualization because it offers high clarity for training, imaging, and complex design work. Cloud processing and high-speed connectivity support real-time rendering, which improves accuracy and smoothness in live applications. As industries shift to digital interaction, holographic content helps companies create stronger user experiences and cut reliance on physical prototypes. This broad utility positions immersive visualization as a core driver for market expansion.
- For instance, stereoscopic display segment holds the largest share of the overall 3D display market.
Advancements in Holographic Projection Technologies
Rapid progress in laser-based projection, piston-driven light modulation, and electro-holographic systems raises display resolution and stability. These advances deliver sharper images, deeper depth perception, and stronger brightness control, which increase usability in bright environments. Many developers now integrate AI-driven rendering to enhance motion tracking and facial recognition, improving interaction quality. Semiconductor upgrades also reduce power use and heat output, supporting longer device life in commercial settings. New optics materials help achieve slimmer designs, enabling easier placement in retail, transport hubs, and exhibitions. Continuous improvements across hardware and software strengthen performance, making modern holographic systems more reliable and cost-effective for real deployment.
- For instance, recent research on dynamic holographic displays based on metasurfaces (an advanced optics approach) shows strong development potential indicating that such systems could support optical encryption, high-fidelity dynamic display and high‑efficiency modulation for commercial use.
Growing Enterprise and Medical Adoption
Enterprises adopt holographic displays to improve collaboration, design evaluation, and training. Manufacturing firms use 3D holograms for digital twins, allowing quick assessments without physical machinery. Hospitals and imaging centers rely on holographic visualization to support advanced diagnostics, surgical planning, and patient communication. These displays help clinicians observe anatomical structures in high detail without using headsets or VR gear. Corporate sectors, including real estate, education, and advertising, also apply holographic tools to reduce demonstration costs and raise audience engagement. As organizations digitize workflows, holographic systems support real-time communication, high-detail modeling, and remote teamwork, creating steady demand across professional environments.
Key Trends & Opportunities
Integration of AI, Sensors, and Touch-Free Interaction
AI improves holographic rendering, gesture tracking, and object recognition, enabling smoother interaction. Touch-free interfaces grow popular in healthcare, airports, and retail, where hygiene and speed matter. Depth sensors, LiDAR, and machine-vision modules help create responsive holograms that adjust to user movement in real time. These advances support new opportunities in customer analytics, guided shopping, and hands-free training. Developers aim to merge holograms with IoT platforms, which may allow holographic dashboards for machine status, smart city monitoring, and remote industrial control. This deep fusion of AI and sensing technology reshapes how businesses deliver interactive content.
- For instance, a study demonstrated a tabletop holographic display controlled via hand gestures using a depth sensor (Azure Kinect) plus deep‑learning the system recognized rotations, zooms, and translation gestures in real‑time, with an average hologram update latency of 27.6 ms per frame.
Expansion Across Entertainment, Retail, and Smart Devices
Entertainment companies test holographic concerts, themed experiences, and venue-based visual effects. Retailers deploy holographic product displays to increase footfall and support virtual try-ons. Smart TV and laptop brands experiment with embedded holographic modules to create glasses-free multidimensional viewing. Camera manufacturers explore holographic overlays for advanced depth capture. This broad adoption opens space for new services such as hologram-based advertising, event projection, and home entertainment. As 5G networks expand, cloud-based holographic streaming becomes more feasible, creating long-term opportunities for high-resolution hologram delivery.
- For instance, recent research in dynamic metasurface holography shows that metasurfaces can be used to build next‑generation holographic displays capable of dynamic wavefront control a potential foundational technology for compact, consumer-grade holographic TVs or smart displays.
Key Challenges
High Hardware and Production Costs
Producing ultrahigh-definition holographic systems requires precision optics, high-performance lasers, and complex light-modulation components. These parts raise the cost of manufacturing and limit access for smaller businesses. Integration with cooling systems, advanced processors, and AI modules increases the final price. Many end users delay adoption due to high upfront investment, long testing cycles, and the cost of content creation. While prices may fall with scale, current cost barriers limit deployment in cost-sensitive sectors. Vendors must focus on modular designs and shared content platforms to broaden adoption.
Technical Limitations and Content Availability
Holographic displays require optimized content that is often expensive and slow to produce. Many industries lack teams skilled in holographic design, which slows project timelines. Brightness limitations in outdoor environments and viewing-angle constraints also affect visual quality. Real-time rendering demands strong processing power, which limits use on smaller devices. Compatibility issues between software engines and projection hardware create further delays. Without standardization, developers struggle to scale content across platforms. These technical hurdles restrain adoption, especially in fast-moving commercial and entertainment settings.
Regional Analysis
North America
North America held the leading share of about 38% in the Ultrahigh Definition Dynamic 3D Holographic Display Market in 2024. Strong demand came from retail, medical imaging, and entertainment companies that deploy holographic tools for immersive engagement. Tech giants invest in advanced projection systems, AI-driven rendering, and glasses-free visualization, which strengthens adoption across commercial spaces. High spending on digital transformation and strong R&D ecosystems help accelerate product upgrades. Defense and automotive sectors also use holograms for simulation and design evaluation. These factors support steady regional dominance and ongoing investment in next-generation holographic platforms.
Europe
Europe captured nearly 27% of the 2024 market, supported by strong adoption across automotive design, industrial training, and healthcare visualization. Germany, the U.K., and France invest heavily in R&D for precision optics, laser projection, and digital manufacturing, which boosts regional demand. Retailers and museums use holographic displays to enhance visitor interaction, while aerospace companies employ advanced holography for simulation. Strict quality standards encourage the use of high-resolution systems that improve safety and user experience. Expanding smart-factory programs and rising interest in immersive customer engagement help maintain Europe’s steady market presence.
Asia-Pacific
Asia-Pacific accounted for about 29% of the market in 2024 and recorded the fastest growth. China, Japan, and South Korea lead technology development in micro-LED, semiconductor processing, and laser modules, which strengthens supply capacity. Retail chains and entertainment venues across major cities use holographic installations to attract young audiences and support digital advertising. Expanding 5G coverage allows smoother real-time rendering for mobile and commercial deployments. Strong electronics manufacturing ecosystems reduce component costs, helping local companies scale production. The region’s rapid digitalization and continuous investment in next-generation displays position Asia-Pacific as the strongest long-term growth hub.
Latin America
Latin America held roughly 4% of the 2024 market, driven by growing interest in digital signage, event projection, and retail promotion. Brazil and Mexico adopt holographic displays for marketing campaigns, product visualization, and entertainment shows as consumer engagement becomes a priority. Universities and medical centers test holographic imaging for training and research, although adoption remains limited by high device costs. Local malls and exhibition venues use hologram-based installations to draw visitors. As regional digital infrastructure improves and more companies adopt immersive tools, the market is expected to grow steadily from a small base.
Middle East & Africa
The Middle East & Africa region captured close to 2% of the market in 2024, supported by rising deployment of holographic displays in luxury retail, tourism attractions, and large public events. The UAE and Saudi Arabia lead adoption due to smart-city programs and strong investment in digital experience platforms. High visitor traffic in malls and airports encourages use of holograms for navigation and advertising. Healthcare centers are testing holographic imaging for training. Despite promising opportunities, expansion remains slow due to high capital costs and limited content development capabilities, but investment momentum continues to rise.
Market Segmentations:
By Technology
- Electro-holographic
- Touchable
- Laser
- Piston
By Dimension
By Application
- Camera
- Digital signage
- Medical imaging
- Smart TV
- Laptops
- Others
By Geography
- North America
- Europe
- Germany
- France
- U.K.
- Italy
- Spain
- Rest of Europe
- Asia Pacific
- China
- Japan
- India
- South Korea
- South-east Asia
- Rest of Asia Pacific
- Latin America
- Brazil
- Argentina
- Rest of Latin America
- Middle East & Africa
- GCC Countries
- South Africa
- Rest of the Middle East and Africa
Competitive Landscape
The Ultrahigh Definition Dynamic 3D Holographic Display Market features active competition among key innovators such as MDH Hologram, Light Field Lab, Inc., Musion IP Limited, Looking Glass, HYPERVSN, Nanjing DSeeLab Digital Technology Co.,Ltd., Realfiction, Leia Display System, EON Reality, and HoloTech Switzerland AG. These companies advance the market through high-resolution projection engines, AI-assisted rendering, and improved light-field optics that support deeper immersion. Many firms invest in glasses-free holographic systems designed for retail activation, medical imaging, engineering visualization, and live events. Strategic partnerships with electronics manufacturers and enterprise users help expand product reach across North America, Europe, and Asia-Pacific. Several players also focus on reducing component costs and improving brightness performance to increase adoption in commercial settings. As use cases grow across education, automotive design, and digital signage, competition strengthens around image clarity, scalability, and interactive features that set each platform apart.
Key Player Analysis
- MDH Hologram
- Light Field Lab, Inc.
- Musion IP Limited
- Looking Glass
- HYPERVSN
- Nanjing DSeeLab Digital Technology Co.,Ltd.
- Realfiction
- Leia Display System
- EON Reality
- HoloTech Switzerland AG
Recent Developments
- In April 2025, Looking Glass (Looking Glass Factory) Unveiled the Looking Glass 27” Light Field display (new 27″ product with high resolution and extended virtual depth) and published a string of spring product/software updates aimed at making multi-user, glasses-free 3D more accessible for creators and businesses.
- In 2024, MDH Hologram MDH Hologram refreshed its online presence / press pages and markets new event-grade holographic projection services; their site highlights new demo material and promotional updates (site press page / home).
Shape Your Report to Specific Countries or Regions & Enjoy 30% Off!
Report Coverage
The research report offers an in-depth analysis based on Technology, Dimension, Application and Geography. It details leading market players, providing an overview of their business, product offerings, investments, revenue streams, and key applications. Additionally, the report includes insights into the competitive environment, SWOT analysis, current market trends, as well as the primary drivers and constraints. Furthermore, it discusses various factors that have driven market expansion in recent years. The report also explores market dynamics, regulatory scenarios, and technological advancements that are shaping the industry. It assesses the impact of external factors and global economic changes on market growth. Lastly, it provides strategic recommendations for new entrants and established companies to navigate the complexities of the market.
Future Outlook
- Demand will rise as more industries adopt immersive and glasses-free visualization.
- Enterprise training and simulation will use holography to improve design and workflow accuracy.
- Medical imaging will expand due to clearer 3D anatomy views and enhanced surgical planning.
- Retail and advertising will grow as brands use holograms for higher customer engagement.
- Hardware costs will decline as component production scales and new materials emerge.
- AI-driven rendering will improve motion tracking, realism, and interaction quality.
- Cloud and 5G integration will support real-time hologram streaming across devices.
- Smart consumer electronics will gradually adopt embedded holographic display modules.
- Event and entertainment venues will increase holographic shows and live visual effects.
- Regional growth will strengthen in Asia-Pacific as manufacturing and adoption accelerate.


