
Market Overview:
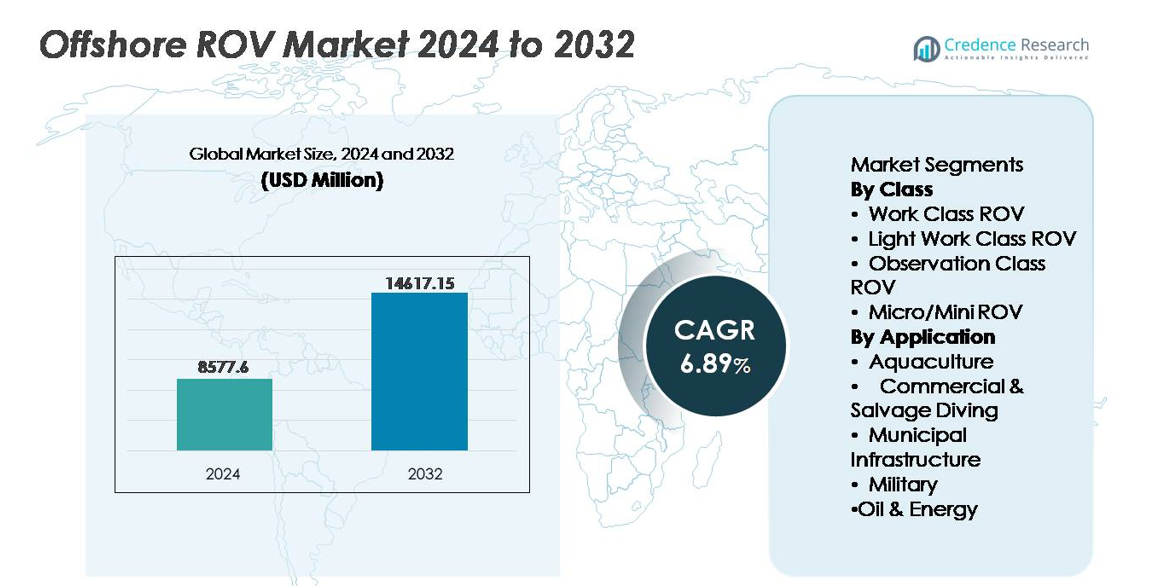
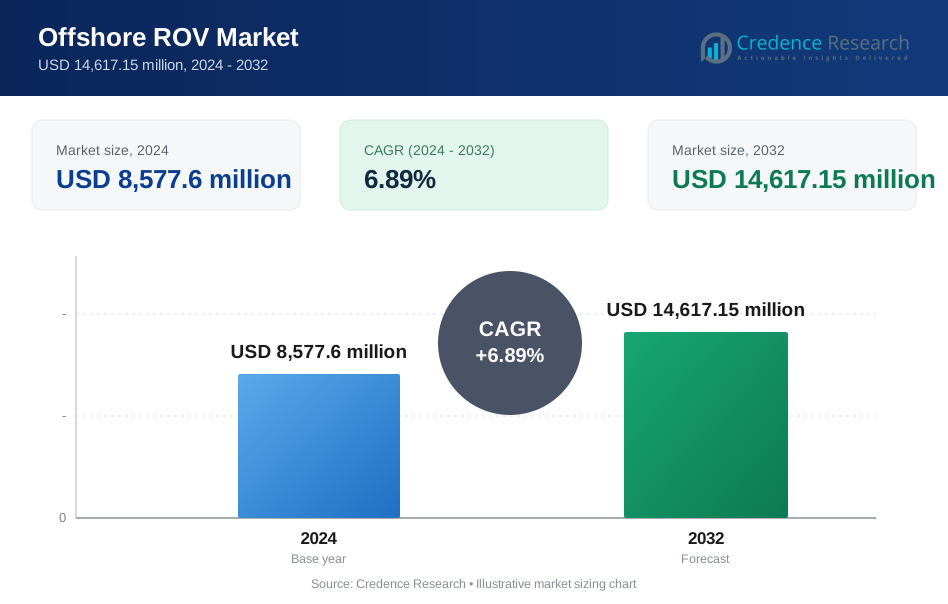
The global offshore ROV market was valued at USD 8,577.6 million in 2024 and is forecast to reach USD 14,617.15 million by 2032, expanding at a CAGR of 6.89% during the projection period.
| REPORT ATTRIBUTE | DETAILS |
|---|---|
| Historical Period | 2020-2023 |
| Base Year | 2024 |
| Forecast Period | 2025-2032 |
| Offshore ROV Market Size 2024 | USD 8,577.6 million |
| Offshore ROV Market, CAGR | 6.89% |
| Offshore ROV Market Size 2032 | USD 14,617.15 million |
The offshore ROV market features a competitive field led by major players such as Oceaneering, TechnipFMC, Subsea 7, DOF Subsea, Forum Energy Technologies, Saab Seaeye, VideoRay, Deep Trekker, Total Marine Technology, and SEAMOR, each contributing distinct technological expertise in work-class and inspection-class ROV solutions. Companies are expanding capabilities in remote piloting, autonomous navigation, and subsea data acquisition to meet growing demand across oil and energy, defense, offshore wind, and aquaculture sectors. North America leads the global market with approximately 35% share, supported by extensive deepwater operations and rapid adoption of remote offshore intervention technologies, followed by Europe and Asia Pacific as emerging growth hotspots.
Market Insights:
- The global offshore ROV market was valued at USD 8,577.6 million in 2024 and is projected to reach USD 14,617.15 million by 2032, exhibiting a CAGR of 6.89% during the forecast period.
- Market growth is driven by expanding deepwater exploration, rising demand for asset integrity management, and increasing deployment of ROVs in offshore wind farms for subsea surveying, cable monitoring, and structural inspection.
- Key trends include rapid adoption of AI-powered autonomous navigation, ROV-as-a-service models, and lightweight compact platforms used for aquaculture and commercial inspection tasks.
- The competitive landscape reflects technological differentiation, with leading companies advancing sensor integration, remote piloting centers, and modular tooling platforms to enhance multipurpose subsea operations.
- North America holds around 35% market share, Europe 30%, and Asia Pacific 25%, while Work Class ROVs dominate the class segment due to deepwater capabilities, and the Oil & Energy segment accounts for the largest application share globally.
Market Segmentation Analysis:
By Class
Work Class ROVs hold the dominant share in the class segment owing to their capability to execute heavy-duty subsea functions such as drilling support, construction assistance, well intervention, and pipeline installation in deep and ultra-deepwater environments. Their high payload capacity, advanced sensor integration, and suitability for long-duration missions enable operators to reduce risks associated with diver-based operations. Meanwhile, Light Work Class, Observation Class, and Micro/Mini ROVs are gaining demand for cost-effective, shallow-to-midwater applications including environmental assessments, underwater surveys, aquaculture monitoring, and hull inspections. Improvements in maneuverability, compact tooling, autonomous navigation, and battery efficiency continue to expand the operational scope of these smaller ROV categories.
- For instance, Oceaneering’s Millennium® Plus Work Class ROV delivers 220 horsepower and operates at depths up to 4,000 meters, enabling torque-intensive intervention and high-load subsea tooling.
By Application
Oil & Energy stands as the dominant segment, driven by ongoing offshore exploration, subsea infrastructure development, and the rising need for inspection, repair, and maintenance across aging assets and emerging offshore wind facilities. ROVs are essential for supporting subsea tiebacks, structural integrity evaluation, and cable route surveys while enabling safe operations in extreme underwater conditions. In contrast, Aquaculture, Commercial & Salvage Diving, Municipal Infrastructure, and Military applications are accelerating due to growing demand for remote inspection, environmental compliance, underwater rescue, and security surveillance. ROV deployments in these sectors reduce human risk, lower operational cost, and enhance real-time decision-making in challenging marine environments.
- For instance, TechnipFMC’s Schilling HD Work Class ROV provides 150horsepower and operates at depths of up to 3,000 meters (with a 4,000m option), enabling complex intervention and heavy-duty tooling for subsea production systems.
Key Growth Drivers:
Rising Deepwater and Ultra-Deepwater Exploration
Rapid expansion of deepwater and ultra-deepwater exploration remains one of the most influential growth drivers for the offshore ROV market. With accessible onshore reserves declining, energy companies are investing aggressively in reservoirs located beyond 1,500 meters, where diver-based operations become infeasible. ROVs enable extended-duration missions, precision inspection, asset installation, and subsea intervention under extreme pressures. Their ability to operate continuously, integrate advanced sensor packages, and interface with remote-control systems reduces downtime and enhances operational predictability. Additionally, offshore field expansions in Africa, the U.S. Gulf of Mexico, Brazil, and the Mediterranean create recurring demand for ROV services in drilling support, well completions, and pipeline networks. These investments not only increase equipment deployment but also stimulate associated service contracts, maintenance operations, and data acquisition activities. As global operators adopt new deepwater plays and pursue enhanced hydrocarbon recovery, ROVs will remain central to offshore production strategies.
- For instance, Subsea 7 deploys its heavy-duty Work Class ROVs capable of operating at depths reaching 4,000 meters during pipelay support and well-intervention campaigns, ensuring continuous operations in challenging field conditions.
Expansion of Offshore Wind and Renewable Marine Infrastructure
The accelerating shift toward offshore renewables, particularly floating and fixed-bottom wind farms, is generating new offshore ROV requirements for turbine foundation surveying, seabed mapping, cable route planning, and post-installation integrity monitoring. The construction and operation of offshore renewable assets involve extensive underwater power cable networks and subsea anchoring systems, creating long-term inspection and maintenance obligations. ROVs provide high-resolution imaging and fault detection while reducing reliance on surface vessels and diving teams. As countries commit to large-scale carbon reduction goals and invest in marine energy infrastructure, service providers are adding specialized renewable-focused ROV capabilities tailored to shallow and mid-depth turbine environments. Cable burial monitoring, scour erosion verification, and structural fatigue assessments are emerging mission profiles. The synergy between marine digitalization and renewable asset growth further strengthens the outlook. With the expanding pipeline of offshore wind and tidal energy installations, ROV demand is expected to scale alongside infrastructure lifecycles.
- For instance, Saab Seaeye’s Cougar XT Compact ROV is engineered specifically for offshore wind inspections and delivers a 500-voltpower system with up to 170 kgf (kilogram-force) of forward thrust, enabling stable operation in high-current environments around turbine foundations.
Increasing Need for Asset Integrity, Life Extension, and Decommissioning
A growing proportion of offshore oil and gas fields are reaching maturity, making inspection, repair, and integrity monitoring essential. ROVs support corrosion detection, cathodic protection assessments, structural fatigue evaluations, and seal/valve function checks in subsea infrastructure. As decommissioning responsibilities grow and regulations tighten, operators require precise cutting, removal, and environmental clearance technologies, favoring advanced ROV intervention systems. Life-extension programs extend production horizons for aging fields but demand more frequent and detailed subsea diagnostics. ROV-enabled nondestructive testing, digital twin integration, and AI-based anomaly tracking improve operational planning and reduce unplanned downtime. The high cost and hazards associated with manual inspection strengthen the business case for automated underwater platforms. Furthermore, global regulatory frameworks governing offshore abandonment drive continuous use of ROVs from the planning stage to final seabed clearance, positioning ROV-based asset integrity as a long-term market catalyst.
Key Trends & Opportunities:
Automation, Autonomy, and AI-Enabled Underwater Intelligence
The integration of autonomous navigation, machine learning, and AI-based image interpretation is emerging as a transformative trend in the offshore ROV market. Operators increasingly deploy systems capable of self-piloting, real-time seabed mapping, obstacle avoidance, and predictive maintenance analytics. These advancements reduce human error, lower operational cost, and allow missions in low-visibility or hazardous areas. AI enhances video and sonar analysis to detect micro-cracks, metal fatigue, or anomalies without manual review, improving decision speed and inspection accuracy. Autonomous ROVs (A-ROVs) create new opportunities in continuous environmental monitoring, pipeline surveillance, and offshore renewables. As digital twin integration becomes standard, ROVs will serve as data-gathering nodes in connected marine operations. With remote command centers replacing vessel-based control rooms, autonomy represents the next stage of operational modernization, enabling longer-duration missions without large crews or offshore mobilization.
- For instance, Saab Seaeye’s Sabertooth hybrid AUV/ROV can operate untethered for approximately 3 to 10 hours (depending on hull size and speed)and cover 20 to 80 kilometers per mission cycle.
Emergence of ROV-as-a-Service and Rental-Based Operating Models
The transition toward service-driven and rental-based deployment models provides significant market opportunity. As ROV complexity and capital cost increase, many operators prefer outsourcing rather than building in-house capabilities. ROV-as-a-Service enables energy companies, port authorities, aquaculture operators, and research agencies to access advanced underwater capabilities without asset ownership. Service providers offer mission planning, piloting, maintenance, and data interpretation, reducing customer burden. This model supports short-duration projects such as inspection, salvage, and environmental assessment, where purchasing equipment lacks financial justification. The rise of flexible, modular systems and containerized deployment broadens customer accessibility. Small and mid-size enterprises-particularly in developing offshore markets-view ROV outsourcing as a cost-aligned strategy. This service-driven model is expected to gain traction as digital diagnostics and remote supervision decrease onboard staffing needs.
- For instance, DOF Subsea’s remote operations initiative demonstrated the ability to pilot Work Class ROV missions from shore, reducing offshore personnel by up to 60 and enabling continuous 24/7 control during its first fully remote offshore campaign completed in December 2023.
Key Challenges:
High Operational Cost and Skilled Workforce Requirements
Despite technological progress, high capital expenditure, vessel mobilization fees, and specialized manpower requirements continue to challenge ROV expansion. Pilots, technicians, and mission planners require extensive training due to the complexity of subsea navigation and intervention tasks. Operational risks-such as tether entanglement, strong currents, and low-visibility environments-increase mission difficulty and insurance liability. Small operators, particularly in emerging markets, struggle with high acquisition and maintenance expenses. While autonomy promises cost reduction over time, initial deployment of AI-capable ROVs remains resource intensive. Balancing performance improvements with affordability will determine the scalability of advanced offshore ROV solutions.
Regulatory Compliance, Safety Standards, and Environmental Restrictions
Stringent offshore safety regulations and environmental protection standards impose operational constraints on ROV deployment. Decommissioning, seabed disturbance, cable laying, and salvage operations require compliance with national and international oversight frameworks. Coastal nations enforce distinct policies surrounding marine ecosystems and subsea infrastructure liability, increasing project complexity. Environmental impact assessments, waste management obligations, and habitat disruption restrictions extend planning timelines. Additionally, military-security protocols restrict data access and mission transparency in sensitive waters. Harmonizing global regulations remains challenging as offshore wind, deepwater exploration, and aquaculture continue expanding. Navigating divergent compliance landscapes and certification obligations remains a formidable operational hurdle for ROV solution providers.
Regional Analysis:
North America
North America holds the largest market share of approximately 35%, driven by extensive offshore exploration programs, mature subsea infrastructure, and continued investment in deepwater reserves in the U.S. Gulf of Mexico. The region benefits from high adoption of Work Class ROVs for drilling support, well intervention, and asset integrity management. Established offshore service providers, defense expenditure on maritime surveillance, and growth in offshore wind installations strengthen demand. Advancements in autonomous navigation and remotely operated inspection platforms further support modernization initiatives across oil, renewable, and military marine segments.
Europe
Europe accounts for nearly 30% of the market share, supported by decommissioning activities in the North Sea, expanding offshore wind farms across the U.K., Germany, and Denmark, and environmental monitoring mandates. The region leads adoption of low-carbon subsea infrastructure inspection solutions and continues to invest in ROV-assisted cable laying, turbine foundation maintenance, and underwater robotics innovation. Strong government policies promoting renewable energy transition and strict safety standards drive continuous usage of inspection, repair, and maintenance technologies. ROV service contracts are increasing as operators shift toward automation-driven offshore asset management.
Asia Pacific
Asia Pacific represents around 25% of the offshore ROV market, backed by offshore field developments in China, India, Malaysia, and Australia. Rising energy demand, national offshore exploration programs, and expanding shipbuilding and port infrastructure support ROV deployment across construction, inspection, and environmental survey missions. Emerging aquaculture hubs in China and Southeast Asia create new opportunities for lightweight and observation-class systems. Technological localization, joint ventures, and cost-competitive manufacturing are improving market accessibility, positioning the region as a high-growth destination for both commercial and defense-driven underwater operations.
Middle East & Africa
The Middle East & Africa region holds an estimated 7% market share, primarily led by offshore oilfield development in Saudi Arabia, the UAE, and deepwater gas assets in East Africa. ROVs play a pivotal role in subsea installation, well integrity evaluation, and maintenance of long-distance pipeline networks in harsh offshore environments. National oil companies are increasingly adopting remote operations to reduce downtime and manage aging subsea assets. While renewable marine infrastructure remains nascent, rising interest in offshore hydrogen and carbon capture projects presents future opportunities for ROV service expansion.
Latin America
Latin America accounts for approximately 3% of the market, supported by deepwater oil reserves in Brazil and emerging exploration programs in Guyana and Suriname. The region relies heavily on Work Class ROVs for complex well intervention and subsea production support. Although political instability and regulatory challenges slow modernization, foreign investment and offshore licensing rounds stimulate gradual growth. Service-based deployment models are gaining preference due to cost sensitivity among operators. Increasing offshore field extensions and early-stage renewable projects are expected to contribute incremental demand for ROV inspection and asset integrity operations.
Market Segmentations:
By Class
- Work Class ROV
- Light Work Class ROV
- Observation Class ROV
- Micro/Mini ROV
By Application
- Aquaculture
- Commercial & Salvage Diving
- Municipal Infrastructure
- Military
- Oil & Energy
By Geography
- North America
- U.S.
- Canada
- Mexico
- Europe
- Germany
- France
- U.K.
- Italy
- Spain
- Rest of Europe
- Asia Pacific
- China
- Japan
- India
- South Korea
- South-east Asia
- Rest of Asia Pacific
- Latin America
- Brazil
- Argentina
- Rest of Latin America
- Middle East & Africa
- GCC Countries
- South Africa
- Rest of the Middle East and Africa
Competitive Landscape:
The competitive landscape of the offshore ROV market is characterized by a mix of global technology providers, specialized subsea service companies, and emerging players offering cost-efficient inspection and intervention capabilities. Established companies dominate through integrated service portfolios, proprietary ROV platforms, and strategic partnerships with offshore energy operators and defense agencies. Competitive differentiation is increasingly driven by automation, AI-enabled navigation, real-time data analytics, and modular tooling systems that support mission-specific customization. Service-centered models such as ROV leasing, remote piloting centers, and subscription-based data delivery continue gaining traction as operators seek to reduce capital expenditure and vessel mobilization costs. Meanwhile, new entrants concentrate on lightweight and observation-class ROVs targeting aquaculture, marine research, and municipal infrastructure applications. Industry consolidation, acquisition of niche engineering firms, and collaboration with offshore wind developers are reshaping market dynamics as stakeholders aim to expand geographical presence and accelerate technology adoption across energy and non-energy marine sectors.
Key Player Analysis:
- SEAMOR
- Subsea 7
- VideoRay
- DOF Subsea
- Total Marine Technology
- Oceaneering
- Deep Trekker
- Forum Energy Technologies
- TechnipFMC
- Saab Seaeye
Recent Developments:
- In July 2025, SEAMOR Marine began a collaborative project with AquaEye to integrate AquaEye’s sonar plus AI-based detection system with SEAMOR’s ROV platforms -aimed at improving deep-water search-and-rescue and subsea survey performance.
- In May 2024, VideoRay secured a US Navy contract worth USD 92.6 million for its Mission Specialist series ROVs, marking strong defense-sector demand for its underwater platforms.
- In November 2023, SEAMOR announced a partnership with VideoRay LLC to supply advanced auxiliary cameras with built-in lighting for VideoRay’s ROVs, enhancing underwater imaging quality under low-visibility conditions.
Report Coverage:
The research report offers an in-depth analysis based on Class, Application and Geography. It details leading market players, providing an overview of their business, product offerings, investments, revenue streams, and key applications. Additionally, the report includes insights into the competitive environment, SWOT analysis, current market trends, as well as the primary drivers and constraints. Furthermore, it discusses various factors that have driven market expansion in recent years. The report also explores market dynamics, regulatory scenarios, and technological advancements that are shaping the industry. It assesses the impact of external factors and global economic changes on market growth. Lastly, it provides strategic recommendations for new entrants and established companies to navigate the complexities of the market.
Future Outlook:
- Offshore ROV adoption will accelerate as deepwater and ultra-deepwater projects expand globally.
- Autonomous and AI-enhanced ROVs will reduce dependency on vessel-based pilots and onboard crews.
- Remote operations centers will enable real-time subsea intervention control from onshore facilities.
- Lightweight and inspection-class ROVs will gain wider use across aquaculture, infrastructure, and research missions.
- Renewable energy growth, particularly offshore wind, will drive demand for subsea surveying and maintenance tasks.
- Data-driven digital twins will integrate with ROVs to enhance predictive maintenance and asset integrity planning.
- Hydrogen and carbon storage projects will introduce new subsea inspection requirements.
- ROV-as-a-service models will expand as operators prioritize cost optimization.
- Safety regulations will increase reliance on unmanned underwater intervention solutions.
- Market consolidation and technology partnerships will shape competitive strategies for global expansion.
Request a Free Sample
Fill in your details and we'll send you a free sample report.
- Sample data tables & charts
- Research methodology
Need a Custom Version of This Report?
Tailor the scope, geography, or segments to your exact requirements.
- Custom geography or segment scope
- Direct access to our analyst team
Frequently Asked Questions
What is the current market size for the Offshore ROV market, and what is its projected size in 2032?
At what Compound Annual Growth Rate is the Offshore ROV market projected to grow between 2024 and 2032?
Which Offshore ROV segment held the largest share in 2024?
What are the primary factors fueling the growth of the Offshore ROV market?
Who are the leading companies in the Offshore ROV market?
Table of Content
Chapter 1. Report Introduction
- 1.1 Report Description & Purpose
- 1.1.1 Report Title & Market Definition
- 1.1.2 Unique Selling Propositions (USP) & Key Differentiators
- 1.1.3 Value Proposition for Stakeholders
- 1.2 Research Objectives
- 1.2.1 Market Sizing Objectives (Volume & Revenue)
- 1.2.2 Segmentation Objectives
- 1.2.3 Competitive Intelligence Objectives
- 1.2.4 Forecast & Scenario Objectives
- 1.3 Report Scope
- 1.3.1 Offshore ROV Scope – Types & Subtypes Covered
- 1.3.2 Geographic Scope – Regions & Countries Covered
- 1.3.3 Historical Period, Base Year & Forecast Period (2024; forecast to 2032)
- 1.3.4 Inclusions & Exclusions
- 1.4 HS Code & Classification Framework
- 1.5 Currency, Units & Pricing Basis
- 1.6 Target Stakeholders
- 1.7 Limitations & Assumptions
Chapter 2. Executive Summary
- 2.1 Global Offshore ROV Market Snapshot
- 2.1.1 Market Size – Historical (2024) & Forecast (2024-2032) (2024: USD 8,577.6 million → 2032: USD 14,617.15 million)
- 2.1.2 Volume & Revenue – Global Totals
- 2.1.3 Key Market Highlights – Top Five Facts
- 2.2 Offshore ROV Market Segmentation Snapshot
- 2.2.1 Market Split by Region – 2024 vs. 2032
- 2.3 Competitive Snapshot
- 2.3.1 Top 10 Players by Revenue Share – 2024
- 2.3.2 Top 10 Players by Volume Share – 2024
- 2.3.3 Recent Strategic Developments (18-Month Summary)
- 2.4 Key Investment Highlights & Strategic Conclusions
Chapter 3. Offshore ROV Market Dynamics & Industry Analysis
- 3.1 Market Overview & Context
- 3.1.1 Offshore ROV Market Position in the Broader Automotive Value Chain
- 3.1.2 OEM vs. Replacement Market Dynamics
- 3.1.3 Market Maturity & Development Stage by Region
- 3.2 Offshore ROV Market Drivers
- 3.3 Offshore ROV Market Restraints & Challenges
- 3.4 Offshore ROV Market Opportunities
- 3.5 Porter's Five Forces Analysis
- 3.5.1 Threat of New Entrants
- 3.5.2 Bargaining Power of Suppliers
- 3.5.3 Bargaining Power of Buyers
- 3.5.4 Threat of Substitutes
- 3.5.5 Competitive Rivalry – Intensity Assessment
- 3.6 Offshore ROV Value Chain Analysis
- 3.6.1 Upstream – Raw Material/Input Suppliers
- 3.6.1.1 Raw Material/Input 1
- 3.6.1.2 Raw Material/Input 2
- 3.6.1.3 Raw Material/Input 3
- 3.6.2 Midstream – Production/Manufacturing/Service Delivery
- 3.6.2.1 Production/Process Overview
- 3.6.2.2 Key Facility Locations & Capacity by Manufacturer
- 3.6.3 Downstream – Distribution & End Consumer
- 3.6.3.1 Primary Channel – B2B/OEM
- 3.6.3.2 Secondary Channels – Dealer, Retail, Online, Direct
- 3.6.4 Value Chain Profitability Analysis
- 3.6.1 Upstream – Raw Material/Input Suppliers
- 3.7 PESTEL Analysis
- 3.7.1 Political Factors
- 3.7.2 Economic Factors
- 3.7.3 Social Factors
- 3.7.4 Technological Factors
- 3.7.5 Environmental Factors
- 3.7.6 Legal Factors
- 3.8 Offshore ROV Supply Chain Analysis
- 3.8.1 Raw Material/Input Supply Risk Assessment
- 3.8.2 Manufacturing Concentration Risk (Geographic Exposure)
- 3.8.3 Trade Disruption Impact Analysis
- 3.9 Regulatory & Policy Landscape
Note: The regulatory and policy landscape section covers regulations based on their applicability to the market, Offshore ROV category, geography, and scope of the study. Only regulatory frameworks with a material impact on operations, compliance, trade, sustainability, or market access are analyzed in detail.
Chapter 4. Key Investment Pockets & Opportunity Analysis
- 4.1 Offshore ROV Market Attractiveness Analysis
- 4.1.1 By Region – Investment Attractiveness Matrix (Volume × CAGR)
- 4.2 Absolute Revenue Growth Opportunity
- 4.2.1 By Region – Absolute USD Growth Through 2032
- 4.3 Incremental Volume Opportunity
- 4.3.1 By Region – Incremental Volume Through 2032
- 4.3.2 Segment – Incremental Volume
- 4.4 Emerging Submarket Opportunity Deep Dive (Subject to Applicability)
- 4.5 Emerging Market Opportunity Scorecards
- 4.5.1 United States
- 4.5.2 Europe
- 4.5.3 Asia
- 4.5.4 Middle East & Africa
Note: Emerging Market Opportunity Scorecards will be included based on relevance and strategic importance. Regions listed are indicative and may vary depending on data availability and market dynamics.
Chapter 5. Offshore ROV Import-Export Analysis & Trade Flows
- 5.1 Global Trade Overview
- 5.1.1 Global Export Value by Country (2024)
- 5.1.2 Global Export Volume by Country (2024)
- 5.1.3 Global Import Value by Country (2024)
- 5.1.4 Global Import Volume by Country (2024)
- 5.1.5 Net Trade Balance by Country (2024)
- 5.2 Export Analysis – Segment
- 5.2.1 Type 1 (HS Code)
- 5.2.2 Type 2 (HS Code)
- 5.2.3 Type 3 (HS Code)
- 5.2.4 Type 4 (HS Code)
- 5.2.5 Type 5 (HS Code)
- 5.3 Import Analysis – Segment
- 5.3.1 Type 1 (HS Code)
- 5.3.2 Type 2 (HS Code)
- 5.3.3 Type 3 (HS Code)
- 5.3.4 Type 4 (HS Code)
- 5.3.5 Type 5 (HS Code)
- 5.4 Average Unit Trade Prices
- 5.4.1 Average Export Price – Segment & Country
- 5.4.2 Average Import Price – Segment & Source Country
- 5.4.3 Price Trends (2024)
- 5.5 Key Trade Route Analysis
- 5.5.1 Trade Route 1
- 5.5.2 Trade Route 2
- 5.5.3 Trade Route 3
- 5.5.4 Trade Route 4
- 5.5.5 Trade Route 5
- 5.6 Trade Policy Impact Assessment
- 5.6.1 US Anti-Dumping & Section 301 Tariffs
- 5.6.2 EU Customs Union Impact
- 5.6.3 Major Free Trade Agreements
- 5.6.4 USMCA Rules of Origin
Note: Trade policy analysis will be included only where relevant to the Offshore ROV market.
Chapter 6. Competitive Landscape & Company Benchmarking
- 6.1 Offshore ROV Market Concentration & Structure
- 6.1.1 Herfindahl-Hirschman Index (HHI) – vs. 2024
- 6.1.2 Tier 1, Tier 2 & Tier 3 Market Structure
- 6.1.3 Global, Regional & Local Player Dynamics
- 6.2 Offshore ROV Market Share Analysis – 2024
- 6.2.1 Global Revenue Share by Company
- 6.2.2 Global Volume Share by Company
- 6.2.3 Regional Revenue Share
- 6.2.4 Market Share Evolution ( vs. 2024)
- 6.2.5 OEM Segment Share by Company
- 6.2.6 Replacement Segment Share by Company
- 6.3 Production/Delivery Capacity & Facility Analysis
- 6.3.1 Global Installed Capacity
- 6.3.2 Capacity Utilization Rates
- 6.3.3 Production/Output Volume
- 6.3.4 Facility Locations & Capacity Map
- 6.3.5 Planned Capacity Additions
- 6.4 Offshore ROV Competitive Benchmarking Matrix
- 6.4.1 Revenue, Volume, CAGR & Profitability Comparison
- 6.4.2 Channel Revenue Mix
- 6.4.3 Geographic Revenue Exposure
- 6.4.4 R&D Intensity
- 6.4.5 Sustainability Maturity
- 6.5 Strategic Developments in Offshore ROV (Last 24 Months)
- 6.5.1 Mergers, Acquisitions & Divestments
- 6.5.2 New Offshore ROV Launches
- 6.5.3 Facility Expansions
- 6.5.4 Strategic Alliances, Joint Ventures & Partnerships
- 6.5.5 Distribution Expansion & Market Entry
- 6.5.6 Sustainability & ESG Initiatives
- 6.6 Competitive Strategy Mapping
- 6.6.1 Leader, Challenger, Follower & Niche Classification
- 6.6.2 Pricing Strategy Comparison
- 6.6.3 Channel Strategy Matrix
Note: Strategic developments are included based on their materiality and the availability of reliable information.
Chapter 7. Global Offshore ROV Market – By Distribution Channel
- 7.1 Segment Overview
- 7.1.1 Volume & Revenue Split by Channel (2024 & 2032)
- 7.1.2 Channel Mix Evolution (2024-2032)
Chapter 8. Regional Market Analysis – Global Overview
- 8.1 Global Regional Overview
- 8.1.1 Regional Volume Share
- 8.1.2 Regional Revenue Share
- 8.1.3 Regional Volume by Region
- 8.1.4 Regional Revenue by Region
- 8.1.5 Regional Forecast Through 2032
- 8.2 Cross-Regional Segment Analysis
- 8.2.1 By Distribution Channel
- 8.2.2 By Brand/Price Tier
Chapter 9. North America Offshore ROV Market
- 9.1 United States
- 9.2 Canada
- 9.3 Mexico
Chapter 10. Europe Offshore ROV Market
- 10.1 Germany
- 10.2 France
- 10.3 Italy
- 10.4 United Kingdom
- 10.5 Spain
- 10.6 Poland
- 10.7 Russia
- 10.8 Netherlands
- 10.9 Belgium
- 10.10 Sweden
- 10.11 Denmark
- 10.12 Norway
- 10.13 Rest of Europe
Chapter 11. Asia Pacific Offshore ROV Market
- 11.1 China
- 11.2 India
- 11.3 Japan
- 11.4 South Korea
- 11.5 Thailand
- 11.6 Indonesia
- 11.7 Vietnam
- 11.8 Malaysia
- 11.9 Australia
- 11.10 Rest of Asia Pacific
Chapter 12. Latin America Offshore ROV Market
- 12.1 Brazil
- 12.2 Argentina
- 12.3 Colombia
- 12.4 Chile
- 12.5 Rest of Latin America
Chapter 13. Middle East Offshore ROV Market
- 13.1 Saudi Arabia
- 13.2 United Arab Emirates
- 13.3 Turkey
- 13.4 Israel
- 13.5 Iran
- 13.6 Rest of the Middle East
Chapter 14. Africa Offshore ROV Market
- 14.1 South Africa
- 14.2 Egypt
- 14.3 Nigeria
- 14.4 Morocco
- 14.5 Rest of Africa
Chapter 15. Offshore ROV Company Profiles
- 15.1 [Company 01]
- 15.1.1 Company Overview
- 15.1.2 Key Management Personnel
- 15.1.3 Products & Services Portfolio
- 15.1.4 Financial Performance
- 15.1.5 Key Market Focus & Geographic Presence
- 15.1.6 Recent Developments & Strategic Initiatives
Note: The company profile list is preliminary and may change based on research findings, market developments, data availability, and client requirements.
Chapter 16. Appendices
- Appendix A – List of Abbreviations & Acronyms
- Appendix B – Industry Classification Code Reference – Full Series
- Appendix C – Production & Capacity Data Tables
- Appendix D – End-Use & Demand Base Tables
- Appendix E – Consumption & Replacement Rate Assumptions
- Appendix F – ASP Reference Tables
- Appendix G – Manufacturing & Facility Database
- Appendix H – Import-Export Data Tables
- Appendix I – Regulatory Summary Tables
- Appendix J – Primary Research Participant List (Anonymized)
- Appendix K – Primary Research Questionnaire Framework
- Appendix L – Data Sources & Bibliography
- Appendix M – Market Size Divergence & Source Comparison
Chapter 17. Research Methodology
- 17.1 Research Framework & Philosophy
- 17.2 Secondary Research – Sources, Hierarchy & Data Extraction
- 17.3 Data Modeling – Bottom-Up & Top-Down Market Sizing
- 17.4 Primary Research – Stakeholder Framework, LOI & Sample Sizes
- 17.5 Forecast Methodology – Regression, Scenario & Sensitivity Analysis
- 17.6 Quality Control – Four-Layer Validation Framework
- 17.7 Limitations & Standard Assumptions
- 17.8 Disclaimer
