
Market Overview
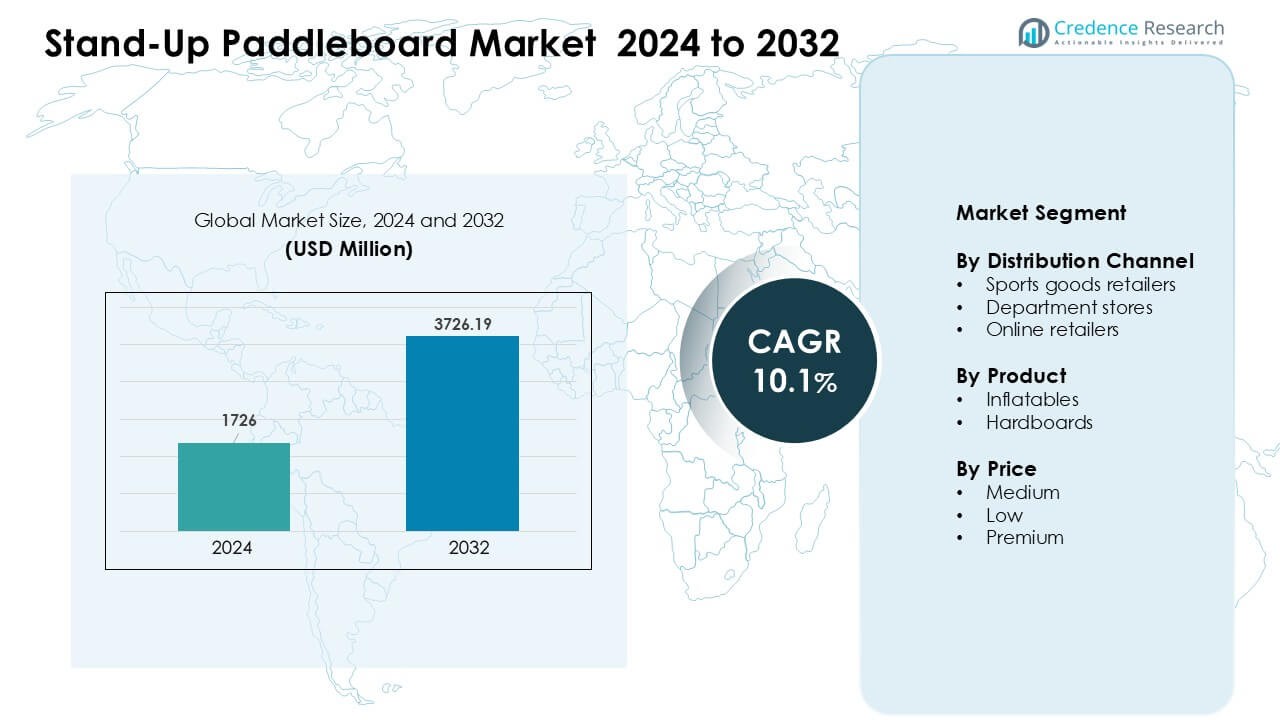
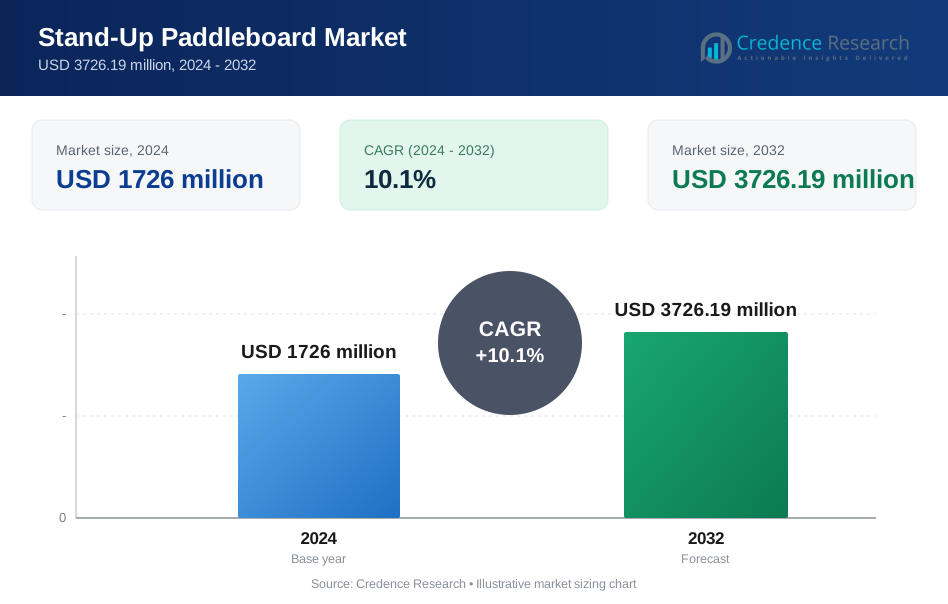
Stand-Up Paddleboard Market was valued at USD 1726 million in 2024 and is anticipated to reach USD 3726.19 million by 2032, growing at a CAGR of 10.1% during the forecast period.
| REPORT ATTRIBUTE | DETAILS |
|---|---|
| Historical Period | 2020-2023 |
| Base Year | 2024 |
| Forecast Period | 2025-2032 |
| Stand-Up Paddleboard Market Size 2024 | USD 1726 Million |
| Stand-Up Paddleboard Market, CAGR | 10.1% |
| Stand-Up Paddleboard Market Size 2032 | USD 3726.19 Million |
The stand-up paddleboard market features strong competition from leading players such as LAIRDSTANDUP, Goodhill Co. Ltd., C4 Waterman, Mistral Red Dot Division B.V., Imagine Nation Sports LLC, Naish International, Cascadia Board Co., Boardworks Surf and Sup., Hobie Cat Co., and Aqua Leisure Recreation LLC. These companies focus on durable materials, improved inflatable technology, and wider distribution to serve both recreational and performance users. North America emerged as the leading region in 2024 with about 38% share, supported by high participation in outdoor sports, strong retail networks, and growing demand from fitness and tourism-based paddleboarding activities
Market Insights
- The stand-up paddleboard market was valued at USD 1726 million in 2024 and is projected to reach USD 19 million by 2032, growing at a CAGR of 10.1%.
- Demand grew as outdoor recreation, fitness activities, and tourism expanded, supporting higher adoption of inflatable and mid-price boards.
- Key trends include rising interest in SUP fitness, wider use in tourism rentals, and strong growth of inflatable boards, which held about 58% share in 2024.
- Leading players such as LAIRDSTANDUP, Naish International, Hobie Cat Co., and C4 Waterman strengthened competition through product innovation and enhanced distribution.
- North America led the market with around 38% share in 2024, driven by strong participation in water sports, while medium-price boards dominated the price segment with about 52% share.
 Market Segmentation Analysis:
By Distribution Channel
Sports goods retailers dominated the distribution channel segment in 2024 with about 46% share. These stores gained strong traction due to wide product variety, in-store trials, and expert guidance for new buyers. Retailers also expanded premium stand-up paddleboard displays to attract adventure users and fitness enthusiasts. Department stores and online retailers grew at steady rates as rising e-commerce adoption encouraged buyers to compare models and access discounts. Online channels also gained momentum from faster delivery services and better exposure to inflatable designs.
- For instance, inflatable SUPs accounted for roughly 60% of board shipments worldwide in recent years reflecting strong online demand which suggests online channels are increasingly effective in pushing volume sales of portable boards.
By Product
Inflatables led the product segment in 2024 with nearly 58% share. Buyers preferred inflatable boards because the lightweight build, compact storage, and easy transport suited casual riders and travel users. Improved drop-stitch construction and durable PVC layers helped the category gain trust among beginners and rental operators. Hardboards maintained a steady niche among skilled paddlers who favored rigid designs for enhanced speed and wave performance. Demand for hardboards also grew in coastal training zones and surf schools that relied on stable, high-strength models.
- For instance, manufacturers report that inflatable SUP boards now make up approximately 60% of all board shipments globally, driven by improvements in drop‑stitch construction and reinforced PVC materials that offer rigidity comparable to rigid boards.
By Price
The medium-price range dominated the price segment in 2024 with around 52% share. Buyers favored this range due to a balanced mix of durability, stability, and feature value. Many mid-range models offered reinforced layers, better fins, and improved accessories, which appealed to new and intermediate paddlers. Low-price boards attracted budget users but faced concerns about shorter lifespan. Premium boards grew at a steady pace as performance athletes and frequent riders sought advanced materials such as carbon reinforcements and race-grade shapes.
Key Growth Drivers
Rising Outdoor Recreation Participation
Growing interest in outdoor recreation acts as a major driver for the stand-up paddleboard market. More people take part in water-based fitness, casual touring, and adventure sports, which lifts demand for versatile boards suited for lakes, rivers, and coastal regions. Many new users enter the category due to easy learning curves and minimal equipment needs. Fitness influencers and community clubs further promote paddleboarding as a full-body workout. Tourism operators add SUP rentals to attract young travelers, while family-oriented recreational spots expand board availability. Rising participation across age groups strengthens long-term market growth.
- For instance, inflatable SUP boards accounted for approximately 55% of all SUP product sales illustrating how accessible, easy‑to-use boards dominate demand as participation rises.
Advancements in Inflatable Board Technology
Technological progress in inflatable stand-up paddleboards drives adoption across both amateur and recreational users. Modern drop-stitch construction increases rigidity and stability, helping inflatable boards match the performance of many hardboards. Thicker PVC layers and reinforced seams improve durability, making inflatables ideal for transport, storage, and rental operations. Brands introduce lightweight pumps, adjustable paddles, and compact carrying kits to enhance convenience. These upgrades reduce traditional concerns about punctures or flexing and expand the customer base. Better performance at lower weight encourages fitness riders, beginners, and travelers to choose advanced inflatables.
- For instance, premium inflatable SUPs are designed to be inflated up to 12–15 PSI using drop‑stitch cores, providing rigidity comparable to hard boards while remaining compact when deflated a major improvement over earlier inflatable model.
Expanding E-Commerce Penetration
E-commerce growth plays a major role in expanding market reach and boosting sales of SUP boards. Online platforms allow buyers to compare designs, material quality, accessories, and price tiers with greater ease. Digital storefronts also highlight user reviews, which guide first-time buyers. Brands offer bundled kits and seasonal discounts, making online purchases more attractive. Faster delivery networks and improved logistics help ship large packages like inflatable boards efficiently. Social media campaigns further promote board features and lifestyle use cases, increasing awareness. Growing online penetration supports global access and broader consumer engagement.
Key Trends & Opportunities
Strong Shift Toward Fitness and Wellness Use
A rising trend in fitness-based paddleboarding shapes product demand and design choices. More consumers use SUP boards for yoga, cardio training, and low-impact workouts. This shift encourages brands to develop wider, more stable decks and textured surfaces that support balance and flexibility routines. Wellness resorts and community fitness programs also adopt SUP sessions as premium offerings. The trend aligns with growing interest in mindful exercise and outdoor routines. As fitness culture expands, demand for multi-purpose, stable, and comfort-focused boards increases.
- For instance, the application segment combining yoga, Pilates, and low-impact water workouts (specifically within the niche Stand-Up Paddle (SUP) Board market) is a rapidly expanding area, with a specific market analysis projecting an 11.2% annual growth rate (CAGR) for that niche application segment leading into 2030.
Growing Adoption in Tourism and Rentals
Tourism operators create attractive opportunities by integrating stand-up paddleboarding into coastal tours, lake resorts, and adventure packages. The activity draws both beginners and experienced travelers who seek accessible recreation. Rental businesses expand inflatable inventories due to easy transport and storage advantages. This sector also benefits from group bookings, event-based activities, and team-building packages. The rise of eco-tourism boosts interest in calm-water paddling, wildlife viewing, and scenic exploration. Tourism growth offers long-term volume potential for brands targeting commercial clients and leisure destinations.
Key Challenge
Limited Consumer Awareness in Emerging Regions
A key challenge for the market is the low awareness of paddleboarding in many developing regions. Limited exposure to water sports and fewer organized recreation facilities reduce adoption. High import duties and limited retail presence also restrict access to quality boards. Many buyers rely on low-quality alternatives due to price gaps, affecting user experience and retention. Without strong promotional activities or rental programs, new markets grow slowly. Brands must invest in regional education, demos, and partnerships to build familiarity and encourage first-time participation.
Seasonal Demand Fluctuations
Seasonality creates another major challenge for market stability. Paddleboarding depends heavily on warm-weather months, which causes strong sales peaks and sharp off-season drops. Retailers struggle with inventory planning, and manufacturers face inconsistent production cycles. Rental operators also experience reduced footfall during cooler periods. Regions with shorter summers face greater volatility, limiting year-round business models. Brands respond with product diversification, such as accessories and off-season training gear, but seasonality remains a core barrier to consistent growth.
Regional Analysis
North America
North America held the leading position in the stand-up paddleboard market in 2024 with around 38% share. Strong participation in outdoor sports, high spending on recreational gear, and widespread access to lakes and coastal zones supported demand across the United States and Canada. Inflatable boards gained strong momentum as travel users preferred portable designs. Retailers also expanded premium and fitness-focused models to match rising interest in SUP yoga and adventure touring. Tourism hubs, rental operators, and surf schools further strengthened regional sales, making North America the most established and mature market.
Europe
Europe accounted for about 29% share in 2024, driven by strong recreational culture and growing adoption of water sports across Germany, France, Spain, and the UK. Many buyers favored mid-range inflatable boards that suited river paddling, leisure touring, and fitness routines. Coastal tourism in the Mediterranean region boosted rental demand, while active lifestyle trends helped expand participation among younger groups. Retail chains widened product portfolios, and online platforms gained traction for comparison-based shopping. Stable infrastructure for sports clubs and training centers also supported Europe’s steady and diverse market growth.
Asia-Pacific
Asia-Pacific captured nearly 24% share in 2024 as interest in paddleboarding rose across China, Australia, Japan, and Southeast Asia. Expanding beach tourism, rising middle-class recreation spending, and greater awareness through social media fueled adoption. Inflatable boards dominated due to lower price points and easy storage in urban homes. Australia remained a strong hub for professional and fitness paddlers, while emerging markets saw rapid growth from rental and resort activities. Local brands increased competition with affordable designs, strengthening Asia-Pacific’s position as one of the fastest-growing regions.
Latin America
Latin America held close to 5% share in 2024, supported by increasing water sports engagement across Brazil, Mexico, and Chile. Coastal tourism and outdoor culture helped rentals and guided tours gain traction. Inflatables performed well due to portability and suitability for diverse water conditions. However, limited specialty retail presence and higher import duties slowed wider adoption. Growing e-commerce access and social media promotion encouraged more first-time buyers. As tourism infrastructure improves, Latin America shows potential for steady long-term expansion in the stand-up paddleboard market.
Middle East & Africa
The Middle East & Africa region accounted for about 4% share in 2024, driven by rising interest in leisure sports across the UAE, South Africa, and coastal resort areas. Warmer climates and growing tourism supported demand for recreational boards and resort-based rentals. The segment grew mainly through inflatables, as they suited travel and storage needs. Limited local production and higher product costs restricted rapid expansion. Awareness programs and water sport events helped attract younger consumers. As beach tourism and leisure investments rise, the region is expected to record gradual market growth.
Market Segmentations:
By Distribution Channel
- Sports goods retailers
- Department stores
- Online retailers
By Product
- Inflatables
- Hardboards
By Price
- Medium
- Low
- Premium
By Geography
- North America
- U.S.
- Canada
- Mexico
- Europe
- Germany
- France
- U.K.
- Italy
- Spain
- Rest of Europe
- Asia Pacific
- China
- Japan
- India
- South Korea
- South-east Asia
- Rest of Asia Pacific
- Latin America
- Brazil
- Argentina
- Rest of Latin America
- Middle East & Africa
- GCC Countries
- South Africa
- Rest of the Middle East and Africa
Competitive Landscape
The stand-up paddleboard market shows strong competition among key players such as LAIRDSTANDUP, Goodhill Co. Ltd., C4 Waterman, Mistral Red Dot Division B.V., Imagine Nation Sports LLC, Naish International, Cascadia Board Co., Boardworks Surf and Sup., Hobie Cat Co., and Aqua Leisure Recreation LLC. These companies focus on innovative materials, enhanced stability, and upgraded inflatable technologies to meet rising demand from beginners and recreational users. Premium brands target performance riders with race-oriented and surf-specific designs, while mid-range players expand value-driven board packages. Many firms strengthen online sales, partner with influencers, and support rental operators with reinforced commercial models. Competition continues to intensify as brands adopt sustainable materials, improve durability, and widen distribution across retail and e-commerce channels.
Key Player Analysis
- LAIRDSTANDUP
- Goodhill Co. Ltd.
- C4 Waterman
- Mistral Red Dot Division B.V.
- Imagine Nation Sports LLC
- Naish International
- Cascadia Board Co.
- Boardworks Surf and Sup.
- Hobie Cat Co.
- Aqua Leisure Recreation LLC
Recent Developments
- In August 2025, GearJunkie named the Boardworks SHUBU Riptide 10'6" its best budget standup paddleboard. The review highlighted strong tracking, plush full-length deck padding, and comfortable carry handles. This recognition supports Boardworks’ positioning in value-focused inflatable SUPs.
- In January 2025, A Technavio report profiled Hobie Cat Co. as a key stand-up paddleboard vendor. The analysis listed Hobie among major brands steering global SUP market growth. Hobie’s Mirage Eclipse and iEclipse pedal boards support this positioning in performance-oriented stand-up segments.
Report Coverage
The research report offers an in-depth analysis based on Distribution Channel, Product, Price and Geography. It details leading market players, providing an overview of their business, product offerings, investments, revenue streams, and key applications. Additionally, the report includes insights into the competitive environment, SWOT analysis, current market trends, as well as the primary drivers and constraints. Furthermore, it discusses various factors that have driven market expansion in recent years. The report also explores market dynamics, regulatory scenarios, and technological advancements that are shaping the industry. It assesses the impact of external factors and global economic changes on market growth. Lastly, it provides strategic recommendations for new entrants and established companies to navigate the complexities of the market.
Future Outlook
- Demand for inflatable boards will rise as portability and durability improve further.
- Fitness-based paddleboarding will grow as more users adopt SUP yoga and workouts.
- Tourism operators will expand rental fleets to meet rising leisure participation.
- Premium performance boards will gain traction among competitive and skill-focused paddlers.
- E-commerce platforms will drive higher sales through bundled kits and targeted promotions.
- Sustainable materials and eco-friendly manufacturing will become central to brand strategies.
- Smart accessories such as GPS-enabled paddles may enhance user experience.
- Emerging regions will show stronger adoption as awareness and retail presence increase.
- Partnerships with resorts, clubs, and training centers will support commercial demand.
- Product diversification across shapes, sizes, and skill levels will strengthen market reach.
Request a Free Sample
Fill in your details and we'll send you a free sample report.
- Sample data tables & charts
- Research methodology
Need a Custom Version of This Report?
Tailor the scope, geography, or segments to your exact requirements.
- Custom geography or segment scope
- Direct access to our analyst team
Frequently Asked Questions
What is the current market size for Stand-Up Paddleboard Market, and what is its projected size in 2032?
At what Compound Annual Growth Rate is Stand-Up Paddleboard Market projected to grow between 2024 and 2032?
Which Stand-Up Paddleboard Market segment held the largest share in 2024?
What are the primary factors fueling the growth of Stand-Up Paddleboard Market?
Who are the leading companies in Stand-Up Paddleboard Market?
Which region commanded the largest share of Stand-Up Paddleboard Market?
Table of Content
Chapter 1. Report Introduction
- 1.1 Report Description & Purpose
- 1.1.1 Report Title & Market Definition
- 1.1.2 Unique Selling Propositions (USP) & Key Differentiators
- 1.1.3 Value Proposition for Stakeholders
- 1.2 Research Objectives
- 1.2.1 Market Sizing Objectives (Volume & Revenue)
- 1.2.2 Segmentation Objectives
- 1.2.3 Competitive Intelligence Objectives
- 1.2.4 Forecast & Scenario Objectives
- 1.3 Report Scope
- 1.3.1 Stand-Up Paddleboard Scope – Types & Subtypes Covered
- 1.3.2 Geographic Scope – Regions & Countries Covered
- 1.3.3 Historical Period, Base Year & Forecast Period (2024; forecast to 2032)
- 1.3.4 Inclusions & Exclusions
- 1.4 HS Code & Classification Framework
- 1.5 Currency, Units & Pricing Basis
- 1.6 Target Stakeholders
- 1.7 Limitations & Assumptions
Chapter 2. Executive Summary
- 2.1 Global Stand-Up Paddleboard Market Snapshot
- 2.1.1 Market Size – Historical (2024) & Forecast (2024-2032) (2024: USD 1726 million → 2032: USD 3726.19 million)
- 2.1.2 Volume & Revenue – Global Totals
- 2.1.3 Key Market Highlights – Top Five Facts
- 2.2 Stand-Up Paddleboard Market Segmentation Snapshot
- 2.2.1 Market Split by Region – 2024 vs. 2032
- 2.3 Competitive Snapshot
- 2.3.1 Top 10 Players by Revenue Share – 2024
- 2.3.2 Top 10 Players by Volume Share – 2024
- 2.3.3 Recent Strategic Developments (18-Month Summary)
- 2.4 Key Investment Highlights & Strategic Conclusions
Chapter 3. Stand-Up Paddleboard Market Dynamics & Industry Analysis
- 3.1 Market Overview & Context
- 3.1.1 Stand-Up Paddleboard Market Position in the Broader Automotive Value Chain
- 3.1.2 OEM vs. Replacement Market Dynamics
- 3.1.3 Market Maturity & Development Stage by Region
- 3.2 Stand-Up Paddleboard Market Drivers
- 3.3 Stand-Up Paddleboard Market Restraints & Challenges
- 3.4 Stand-Up Paddleboard Market Opportunities
- 3.5 Porter's Five Forces Analysis
- 3.5.1 Threat of New Entrants
- 3.5.2 Bargaining Power of Suppliers
- 3.5.3 Bargaining Power of Buyers
- 3.5.4 Threat of Substitutes
- 3.5.5 Competitive Rivalry – Intensity Assessment
- 3.6 Stand-Up Paddleboard Value Chain Analysis
- 3.6.1 Upstream – Raw Material/Input Suppliers
- 3.6.1.1 Raw Material/Input 1
- 3.6.1.2 Raw Material/Input 2
- 3.6.1.3 Raw Material/Input 3
- 3.6.2 Midstream – Production/Manufacturing/Service Delivery
- 3.6.2.1 Production/Process Overview
- 3.6.2.2 Key Facility Locations & Capacity by Manufacturer
- 3.6.3 Downstream – Distribution & End Consumer
- 3.6.3.1 Primary Channel – B2B/OEM
- 3.6.3.2 Secondary Channels – Dealer, Retail, Online, Direct
- 3.6.4 Value Chain Profitability Analysis
- 3.6.1 Upstream – Raw Material/Input Suppliers
- 3.7 PESTEL Analysis
- 3.7.1 Political Factors
- 3.7.2 Economic Factors
- 3.7.3 Social Factors
- 3.7.4 Technological Factors
- 3.7.5 Environmental Factors
- 3.7.6 Legal Factors
- 3.8 Stand-Up Paddleboard Supply Chain Analysis
- 3.8.1 Raw Material/Input Supply Risk Assessment
- 3.8.2 Manufacturing Concentration Risk (Geographic Exposure)
- 3.8.3 Trade Disruption Impact Analysis
- 3.9 Regulatory & Policy Landscape
Note: The regulatory and policy landscape section covers regulations based on their applicability to the market, Stand-Up Paddleboard category, geography, and scope of the study. Only regulatory frameworks with a material impact on operations, compliance, trade, sustainability, or market access are analyzed in detail.
Chapter 4. Key Investment Pockets & Opportunity Analysis
- 4.1 Stand-Up Paddleboard Market Attractiveness Analysis
- 4.1.1 By Region – Investment Attractiveness Matrix (Volume × CAGR)
- 4.2 Absolute Revenue Growth Opportunity
- 4.2.1 By Region – Absolute USD Growth Through 2032
- 4.3 Incremental Volume Opportunity
- 4.3.1 By Region – Incremental Volume Through 2032
- 4.3.2 Segment – Incremental Volume
- 4.4 Emerging Submarket Opportunity Deep Dive (Subject to Applicability)
- 4.5 Emerging Market Opportunity Scorecards
- 4.5.1 United States
- 4.5.2 Europe
- 4.5.3 Asia
- 4.5.4 Middle East & Africa
Note: Emerging Market Opportunity Scorecards will be included based on relevance and strategic importance. Regions listed are indicative and may vary depending on data availability and market dynamics.
Chapter 5. Stand-Up Paddleboard Import-Export Analysis & Trade Flows
- 5.1 Global Trade Overview
- 5.1.1 Global Export Value by Country (2024)
- 5.1.2 Global Export Volume by Country (2024)
- 5.1.3 Global Import Value by Country (2024)
- 5.1.4 Global Import Volume by Country (2024)
- 5.1.5 Net Trade Balance by Country (2024)
- 5.2 Export Analysis – Segment
- 5.2.1 Type 1 (HS Code)
- 5.2.2 Type 2 (HS Code)
- 5.2.3 Type 3 (HS Code)
- 5.2.4 Type 4 (HS Code)
- 5.2.5 Type 5 (HS Code)
- 5.3 Import Analysis – Segment
- 5.3.1 Type 1 (HS Code)
- 5.3.2 Type 2 (HS Code)
- 5.3.3 Type 3 (HS Code)
- 5.3.4 Type 4 (HS Code)
- 5.3.5 Type 5 (HS Code)
- 5.4 Average Unit Trade Prices
- 5.4.1 Average Export Price – Segment & Country
- 5.4.2 Average Import Price – Segment & Source Country
- 5.4.3 Price Trends (2024)
- 5.5 Key Trade Route Analysis
- 5.5.1 Trade Route 1
- 5.5.2 Trade Route 2
- 5.5.3 Trade Route 3
- 5.5.4 Trade Route 4
- 5.5.5 Trade Route 5
- 5.6 Trade Policy Impact Assessment
- 5.6.1 US Anti-Dumping & Section 301 Tariffs
- 5.6.2 EU Customs Union Impact
- 5.6.3 Major Free Trade Agreements
- 5.6.4 USMCA Rules of Origin
Note: Trade policy analysis will be included only where relevant to the Stand-Up Paddleboard market.
Chapter 6. Competitive Landscape & Company Benchmarking
- 6.1 Stand-Up Paddleboard Market Concentration & Structure
- 6.1.1 Herfindahl-Hirschman Index (HHI) – vs. 2024
- 6.1.2 Tier 1, Tier 2 & Tier 3 Market Structure
- 6.1.3 Global, Regional & Local Player Dynamics
- 6.2 Stand-Up Paddleboard Market Share Analysis – 2024
- 6.2.1 Global Revenue Share by Company
- 6.2.2 Global Volume Share by Company
- 6.2.3 Regional Revenue Share
- 6.2.4 Market Share Evolution ( vs. 2024)
- 6.2.5 OEM Segment Share by Company
- 6.2.6 Replacement Segment Share by Company
- 6.3 Production/Delivery Capacity & Facility Analysis
- 6.3.1 Global Installed Capacity
- 6.3.2 Capacity Utilization Rates
- 6.3.3 Production/Output Volume
- 6.3.4 Facility Locations & Capacity Map
- 6.3.5 Planned Capacity Additions
- 6.4 Stand-Up Paddleboard Competitive Benchmarking Matrix
- 6.4.1 Revenue, Volume, CAGR & Profitability Comparison
- 6.4.2 Channel Revenue Mix
- 6.4.3 Geographic Revenue Exposure
- 6.4.4 R&D Intensity
- 6.4.5 Sustainability Maturity
- 6.5 Strategic Developments in Stand-Up Paddleboard (Last 24 Months)
- 6.5.1 Mergers, Acquisitions & Divestments
- 6.5.2 New Stand-Up Paddleboard Launches
- 6.5.3 Facility Expansions
- 6.5.4 Strategic Alliances, Joint Ventures & Partnerships
- 6.5.5 Distribution Expansion & Market Entry
- 6.5.6 Sustainability & ESG Initiatives
- 6.6 Competitive Strategy Mapping
- 6.6.1 Leader, Challenger, Follower & Niche Classification
- 6.6.2 Pricing Strategy Comparison
- 6.6.3 Channel Strategy Matrix
Note: Strategic developments are included based on their materiality and the availability of reliable information.
Chapter 7. Global Stand-Up Paddleboard Market – By Distribution Channel
- 7.1 Segment Overview
- 7.1.1 Volume & Revenue Split by Channel (2024 & 2032)
- 7.1.2 Channel Mix Evolution (2024-2032)
Chapter 8. Regional Market Analysis – Global Overview
- 8.1 Global Regional Overview
- 8.1.1 Regional Volume Share
- 8.1.2 Regional Revenue Share
- 8.1.3 Regional Volume by Region
- 8.1.4 Regional Revenue by Region
- 8.1.5 Regional Forecast Through 2032
- 8.2 Cross-Regional Segment Analysis
- 8.2.1 By Distribution Channel
- 8.2.2 By Brand/Price Tier
Chapter 9. North America Stand-Up Paddleboard Market
- 9.1 United States
- 9.2 Canada
- 9.3 Mexico
Chapter 10. Europe Stand-Up Paddleboard Market
- 10.1 Germany
- 10.2 France
- 10.3 Italy
- 10.4 United Kingdom
- 10.5 Spain
- 10.6 Poland
- 10.7 Russia
- 10.8 Netherlands
- 10.9 Belgium
- 10.10 Sweden
- 10.11 Denmark
- 10.12 Norway
- 10.13 Rest of Europe
Chapter 11. Asia Pacific Stand-Up Paddleboard Market
- 11.1 China
- 11.2 India
- 11.3 Japan
- 11.4 South Korea
- 11.5 Thailand
- 11.6 Indonesia
- 11.7 Vietnam
- 11.8 Malaysia
- 11.9 Australia
- 11.10 Rest of Asia Pacific
Chapter 12. Latin America Stand-Up Paddleboard Market
- 12.1 Brazil
- 12.2 Argentina
- 12.3 Colombia
- 12.4 Chile
- 12.5 Rest of Latin America
Chapter 13. Middle East Stand-Up Paddleboard Market
- 13.1 Saudi Arabia
- 13.2 United Arab Emirates
- 13.3 Turkey
- 13.4 Israel
- 13.5 Iran
- 13.6 Rest of the Middle East
Chapter 14. Africa Stand-Up Paddleboard Market
- 14.1 South Africa
- 14.2 Egypt
- 14.3 Nigeria
- 14.4 Morocco
- 14.5 Rest of Africa
Chapter 15. Stand-Up Paddleboard Company Profiles
- 15.1 [Company 01]
- 15.1.1 Company Overview
- 15.1.2 Key Management Personnel
- 15.1.3 Products & Services Portfolio
- 15.1.4 Financial Performance
- 15.1.5 Key Market Focus & Geographic Presence
- 15.1.6 Recent Developments & Strategic Initiatives
Note: The company profile list is preliminary and may change based on research findings, market developments, data availability, and client requirements.
Chapter 16. Appendices
- Appendix A – List of Abbreviations & Acronyms
- Appendix B – Industry Classification Code Reference – Full Series
- Appendix C – Production & Capacity Data Tables
- Appendix D – End-Use & Demand Base Tables
- Appendix E – Consumption & Replacement Rate Assumptions
- Appendix F – ASP Reference Tables
- Appendix G – Manufacturing & Facility Database
- Appendix H – Import-Export Data Tables
- Appendix I – Regulatory Summary Tables
- Appendix J – Primary Research Participant List (Anonymized)
- Appendix K – Primary Research Questionnaire Framework
- Appendix L – Data Sources & Bibliography
- Appendix M – Market Size Divergence & Source Comparison
Chapter 17. Research Methodology
- 17.1 Research Framework & Philosophy
- 17.2 Secondary Research – Sources, Hierarchy & Data Extraction
- 17.3 Data Modeling – Bottom-Up & Top-Down Market Sizing
- 17.4 Primary Research – Stakeholder Framework, LOI & Sample Sizes
- 17.5 Forecast Methodology – Regression, Scenario & Sensitivity Analysis
- 17.6 Quality Control – Four-Layer Validation Framework
- 17.7 Limitations & Standard Assumptions
- 17.8 Disclaimer
