
Market Overview
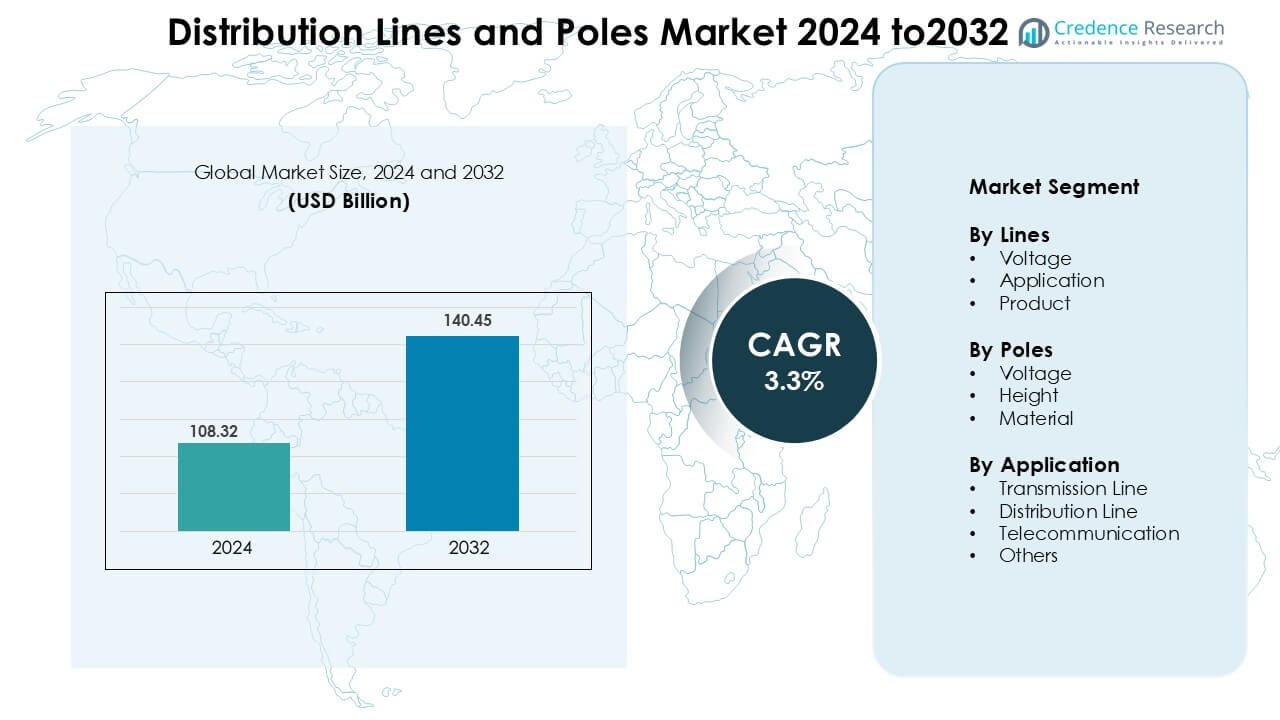
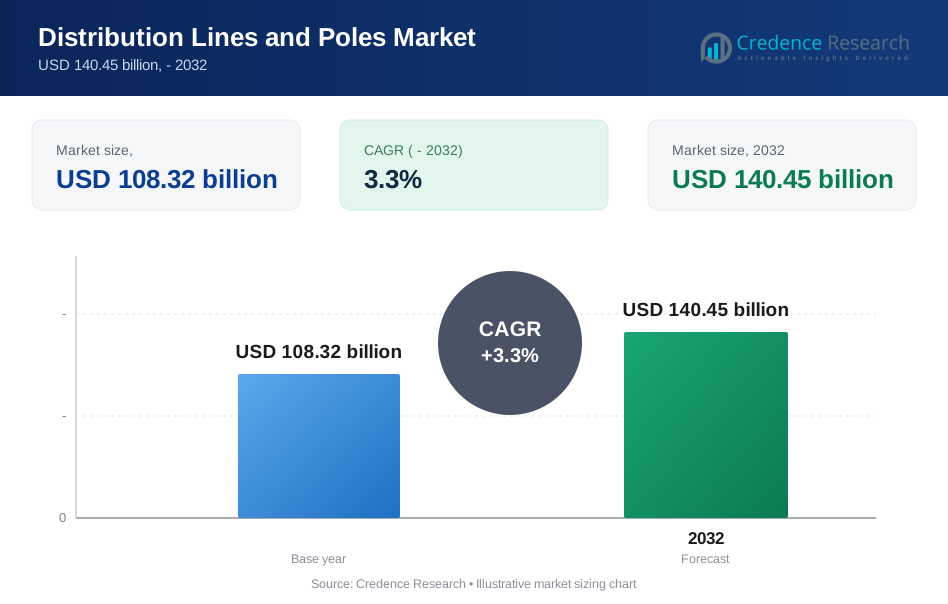
Distribution Lines and Poles Market was valued at USD 108.32 billion in 2024 and is anticipated to reach USD 140.45 billion by 2032, growing at a CAGR of 3.3 % during the forecast period.
| REPORT ATTRIBUTE | DETAILS |
|---|---|
| Historical Period | 2020-2023 |
| Base Year | 2024 |
| Forecast Period | 2025-2032 |
| Distribution Lines and Poles Market Size 2024 | USD 108.32 Billion |
| Distribution Lines and Poles Market, CAGR | 3.3 % |
| Distribution Lines and Poles Market Size 2032 | USD 140.45 Billion |
The leading companies in the Distribution Lines and Poles Market include APAR Industries, Bell Lumber & Pole Company, BridgeWell Resources, Dynamic Cables, Elsewedy Electric, General Cable, KEI Industries, Koppers Utility & Industrial Products, Kreative Concrete Industries and LAMIFIL. These firms maintain strong positions via global manufacturing, product breadth and utility sector relationships. Regionally, the market is led by the Asia‑Pacific region, which commands approximately 38–40%, of the global market share in the poles sub‑sector of this industry.
Market Insights
- The market for distribution lines and poles stood at USD 108.32 billion in 2025 and is projected to reach USD 140.45 billion by 2035, registering a CAGR of 3.3%.
- Key drivers include grid modernisation, rising electricity demand and utility investments in expanding and reinforcing the network.
- Trends reveal dominant segments such as the voltage lines sub‑category (≈ 54.7% share) and the material poles sub‑category (≈ 53.8% share).
- Competitive analysis shows a moderately concentrated market, with the top five players holding over 50% global share; companies focus on scale, innovation and regional alliances.
- Regional analysis indicates the Asia‑Pacific region leads market share (38–40%), while mature markets such as North America and Europe show slower growth due to ageing infrastructure.
Market Segmentation Analysis:
By Lines
The Voltage category, which holds about 54.7% of the total share. This strong lead reflects the growing need for stable and efficient power transmission across expanding grids. Rising energy use in cities and industries creates heavier pressure on networks, pushing utilities to invest in higher-capacity lines.Within this category, the > 33 kV high-voltage segment remains the top contributor. High-voltage lines support large renewable energy plants that feed power into national grids over long distances. Wind farms, solar parks, and hybrid clean-energy hubs depend on high-voltage lines to move electricity with minimal loss. Ageing grid assets also require replacement, which increases demand for modern high-voltage systems.
- For instance, Hitachi Energy Ltd. supplied equipment for the Changji‑Guquan ±1100 kV UHVDC Link a system capable of transmitting 12,000 MW of power over 3,000 km at ±1,100 kV.
By Poles
The Material category holds the leading share at 53.8%, reflecting strong demand for durable and reliable pole structures. Utilities and public agencies prefer materials that provide long service life with minimal maintenance. Growing pressure on grid networks increases the need for poles that can handle heavier loads and frequent voltage fluctuations. Within this category, concrete poles dominate due to their proven strength and cost advantage. Concrete designs resist moisture, corrosion, storms, and extreme temperature shifts better than many alternatives. These qualities make them suitable for both urban distribution grids and remote rural corridors. Long replacement cycles lower operational costs for utilities, which strengthens their adoption across markets.
- For instance, The StressCrete Group manufactures spun-concrete utility poles using a centrifugal casting process and highlights the durability and long service life of its poles produced since 1953.
By Application
The Distribution Line sub-segment holds the leading position due to rapid urban expansion and stronger electrification needs. Growing cities require dense and reliable distribution networks to deliver stable power to homes, offices, and public facilities. Utilities prioritise distribution line upgrades because these networks form the final link between substations and end users. Rural development programmes also boost demand, as many regions expand last-mile connectivity to support villages, farms, and small industries. Commercial buildings, industrial parks, and urban housing projects rely heavily on robust distribution lines to maintain steady power flow. This broad usage drives consistent investment from public and private utilities. Rising grid modernisation efforts add further momentum. Regulatory bodies push for improved system reliability, reduced outages, and upgraded ageing lines.
Key Growth Drivers
Modernisation of Aging Grid Infrastructure
Utilities across many regions are replacing older distribution lines and poles to meet rising reliability expectations. Ageing networks struggle with higher load demand, frequent outages, and safety compliance issues, which push operators to modernise core assets. New voltage lines, advanced conductors, and stronger pole materials help improve grid stability and reduce failure risks during peak demand. Modernisation efforts focus on improving system efficiency, supporting renewable energy integration, and strengthening last-mile delivery. Utilities upgrade poles with higher load-bearing capacity and improved weather resistance to handle storms, heatwaves, and changing climate conditions. Replacement of brittle or corroded assets is now a priority as regulators enforce stricter standards for reliability and service quality. Government funding and utility investment plans provide added momentum for grid resilience and disaster-proofing. Many national programmes allocate capital for line reinforcement, pole hardening, and smart-grid integration.
- For instance, Avangrid, Inc. reported replacing over 24,000 utility poles so far in 2025 across its subsidiaries in New York, Maine and Connecticut—serving around 3.4 million customers.
Expansion of Electricity Demand & Electrification
Growing electricity consumption across urban, industrial, and rural areas increases the need for stronger and wider distribution networks. Expanding cities add new homes, offices, hospitals, and transport hubs that depend on reliable last-mile power supply. Industrial clusters and small manufacturing zones also require continuous power, which places added pressure on existing distribution lines and poles. Rural regions continue to receive government support for electrification, creating ongoing demand for new overhead line installations. Rising demand is also shaped by emerging high-load sectors. Electric vehicle charging networks expand rapidly and require stable local grids with higher current capacity. Data centres use large amounts of power for cooling, servers, and network equipment, and these facilities need reinforced distribution infrastructure. Growth in modern manufacturing, including electronics, food processing, and chemicals, increases daily load on feeder lines and local distribution poles.
- For instance, Genus Power Infrastructures Ltd has completed electrification of more than 10,000 villages in India, deploying 11, 22 & 33 kV distribution lines and installing thousands of pole-mounted transformers.
Integration of Renewable Energy & Smart Grids
The shift towards renewable energy sources and smart grid technologies amplifies requirements for modernised distribution infrastructure. The rising penetration of solar and wind generation—often located remotely necessitates new high‑capacity lines and resilient poles. Smart grid features such as automated monitoring, sensors and adaptive load management drive demand for advanced materials and line/pole systems with enhanced capabilities.
Key Trends & Opportunities
Use of Advanced Materials and Smart Technology
A prominent trend in the distribution lines and poles market is the adoption of composite, fibre‑reinforced and treated‑wood poles to improve durability, reduce maintenance and withstand extreme weather. The integration of smart sensors, IoT connectivity and digital twins into line and pole infrastructure presents an opportunity for manufacturers and utilities to deliver value‑added services and extend life‑cycle performance.
- For instance, RS Technologies Inc. offers modular composite poles engineered for grid hardening with an 80-year service life and covered by a 41-year limited warranty.
Rural Electrification & Emerging Market Growth
Large‑scale rural electrification programmes in regions such as Asia‑Pacific and Africa offer a significant opportunity for market expansion. Utilities are building new distribution lines and installing poles to extend grid access, particularly in underserved regions. Additionally, developing economies are increasing infrastructure investment for both urban expansion and industrialisation, creating system‑build opportunities for line and pole suppliers.
- For instance, Elsewedy Electric implemented a project that generated 2,115 MW of electricity in Tanzania and served approximately 60 million citizens, highlighting its involvement in large grid‑infrastructure works.
Key Challenges
High Capital Expenditure and Long Pay‑back Periods
Overhead line and pole projects require significant upfront spending on materials, engineering, installation, and right-of-way approvals. These expenses increase further when projects involve high-voltage lines, difficult terrain, or dense urban zones with strict safety rules. Long pay-back periods make investments challenging for utilities that operate under regulated tariffs and limited revenue growth. Many mature markets already have slow demand expansion, which places tighter limits on capital budgets. Ageing assets still require upgrades, but cost pressure forces utilities to delay or phase projects over longer timelines. Regulatory scrutiny and extended approval cycles add more time before returns begin, slowing new deployments.
Raw Material Volatility and Supply Chain Risks
The distribution lines and poles sector experiences heavy exposure to fluctuating raw material costs, including steel, concrete, composites, and high-voltage conductors. Price swings impact project planning because materials account for a large share of total infrastructure spending. Global supply chain disruptions create added uncertainty, especially during periods of transport delays, fuel shortages, or geopolitical tension. Import and export restrictions affect lead times and force utilities to adjust procurement strategies. Shifting environmental and safety regulations can also tighten material availability. These combined risks create delays for developers and raise production costs for manufacturers across the market.
Regional Analysis
North America
North America holds roughly 32–34% of the Distribution Lines and Poles Market, driven by large-scale grid modernisation and extensive replacement of ageing wood-based assets. Utilities across the United States and Canada invest heavily in stronger poles, high-capacity distribution lines, and storm-resistant routing to improve service reliability. Rising power demand from EV charging, data centres, and expanding commercial complexes increases pressure on distribution corridors. Federal and state-level resilience programmes accelerate upgrades in high-risk zones exposed to storms and wildfires. These sustained infrastructure initiatives keep North America in a leading position across the global market.
Asia Pacific
Asia Pacific contributes the largest share at around 38–40%, supported by rapid urbanisation, large rural electrification programmes, and continuous power-network expansion. Countries such as China, India, Indonesia, and Vietnam add extensive distribution lines to support residential growth, industrial corridors, and new commercial developments. High electricity consumption from manufacturing clusters and dense urban populations strengthens investment in robust pole structures and high-capacity conductors. Government-funded grid expansion projects widen access in semi-urban and rural regions. The region’s strong infrastructure spending and rising electricity demand keep Asia Pacific the strongest growth engine in the global distribution lines and poles landscape.
Europe
Europe accounts for an estimated 18–20% share, supported by continuous grid reinforcement, renewable-energy integration, and replacement of older distribution lines. Many countries upgrade networks to accommodate decentralised solar and wind power, which increases the need for resilient poles and advanced line materials. Ageing assets in Western Europe create steady replacement demand, while Eastern Europe focuses on strengthening electrification and improving system reliability. Regulatory expectations for reduced outages and improved service quality push utilities to modernise local distribution routes. Investments in undergrounding projects also influence network design while keeping demand consistent for overhead infrastructure in suitable regions.
Latin America
Latin America holds roughly 6–7% of the market, supported by expanding electrification in rural areas and increasing investment in network reliability. Countries such as Brazil, Mexico, Colombia, and Peru continue to upgrade outdated distribution corridors to meet rising urban and industrial demand. Extreme weather exposure in several regions encourages the use of stronger, weather-resistant poles and conductors. Government programmes focused on grid stability and loss reduction also contribute to new installations. Although investment cycles vary by country, consistent urban expansion and infrastructure modernisation sustain the region’s position as a developing but steadily growing market.
Middle East & Africa
The Middle East & Africa region accounts for an estimated 5–6% share, driven by electrification needs, network expansion, and new infrastructure projects. Gulf countries strengthen distribution networks to support industrial growth, large-scale construction, and commercial expansion. African nations continue to expand rural electrification, which significantly increases the need for durable poles and cost-effective distribution lines. Many utilities replace ageing assets to improve reliability, reduce technical losses, and meet safety standards. Harsh climatic conditions in several markets also encourage the adoption of concrete and composite poles. Gradual investment growth keeps the region on a steady upward trajectory.
Market Segmentations:
By Lines
- Voltage
- Application
- Product
By Poles
- Voltage
- Height
- Material
By Application
- Transmission Line
- Distribution Line
- Telecommunication
- Others
By Geography
- North America
- U.S.
- Canada
- Mexico
- Europe
- Germany
- France
- U.K.
- Italy
- Spain
- Rest of Europe
- Asia Pacific
- China
- Japan
- India
- South Korea
- South-east Asia
- Rest of Asia Pacific
- Latin America
- Brazil
- Argentina
- Rest of Latin America
- Middle East & Africa
- GCC Countries
- South Africa
- Rest of the Middle East and Africa
Competitive Landscape
The competitive landscape in the Distribution Lines and Poles Market features a broad mix of multinational majors and regional players, reflecting a moderate market concentration and high entry activity. Leading firms such as APAR Industries, Elsewedy Electric, General Cable and KEI Industries secure large-scale contracts through technology portfolios, global manufacturing footprints and strong utility‑sector relationships. At the same time, smaller regional manufacturers and material‑specialty players challenge by focusing on local infrastructure programmes, agile supply chains and niche product differentiation. Competitive tactics emphasise cost‑efficiency, sustainable materials (e.g., composite or concrete poles), digital‑enabled line systems, and integrated service offerings. Given the strong drive for grid modernisation and electrification, merger & acquisition activity and strategic alliances are intensifying as companies seek scale and geographic penetration.
Key Player Analysis
- KEI Industries
- Elsewedy Electric
- General Cable
- Koppers Utility & Industrial Products
- APAR Industries
- Bell Lumber & Pole Company
- BridgeWell Resources
- Dynamic Cables
- Kreative Concrete Industries
- LAMIFIL
Recent Developments
- In November 2025, KEI Industries: Phase-1 of the Sanand, Gujarat cable plant is set to start LT/HT production. The commissioning expands supply for distribution lines across India.
- In November 2025, General Cable (Prysmian): Ribbon-cutting marked completion of a $63.8 million expansion at Du Quoin, Illinois. The project adds 100,000 sq ft and 80 jobs to scale grid and renewables cable output used in distribution networks.
Report Coverage
The research report offers an in-depth analysis based on Lines, Poles, Application and Geography. It details leading market players, providing an overview of their business, product offerings, investments, revenue streams, and key applications. Additionally, the report includes insights into the competitive environment, SWOT analysis, current market trends, as well as the primary drivers and constraints. Furthermore, it discusses various factors that have driven market expansion in recent years. The report also explores market dynamics, regulatory scenarios, and technological advancements that are shaping the industry. It assesses the impact of external factors and global economic changes on market growth. Lastly, it provides strategic recommendations for new entrants and established companies to navigate the complexities of the market.
Future Outlook
- The market will expand with elevated investment in aging grid refurbishment and expansion of distribution networks.
- Demand will grow from accelerating electrification of transport and industry requiring upgraded distribution infrastructure.
- Growth will be driven by renewable‑energy integration and smart grid deployments across both developed and developing regions.
- Emerging materials like composite and high‑strength concrete poles will gain preference, boosting product innovation.
- Grid resilience against extreme weather and climate change will prompt utilities to replace traditional lines and poles more frequently.
- Smaller utilities and emerging markets will adopt digital monitoring and automated fault‑detection systems tied to distribution infrastructure.
- Suppliers will pursue partnerships and acquisitions to access regional growth markets and provide turnkey line‑and‑pole solutions.
- Standardisation and regulatory mandates will push utilities toward eco‑friendly, sustainably sourced poles and lines.
- Supply‑chain optimisation and localised manufacturing will help counter raw‑material volatility and logistical constraints.
- Regions such as Asia‑Pacific will continue to grow fastest, while mature markets will expand via replacement cycles and smart‑grid upgrades.
Request a Free Sample
Fill in your details and we'll send you a free sample report.
- Sample data tables & charts
- Research methodology
Need a Custom Version of This Report?
Tailor the scope, geography, or segments to your exact requirements.
- Custom geography or segment scope
- Direct access to our analyst team
Frequently Asked Questions
What is the current market size for the Distribution Lines and Poles Market, and what is its projected size in 2032?
At what Compound Annual Growth Rate is the Distribution Lines and Poles Market projected to grow between 2025 and 2032?
Which Distribution Lines and Poles Market segment held the largest share in 2024?
What are the primary factors fueling the growth of the Distribution Lines and Poles Market?
Who are the leading companies in the Distribution Lines and Poles Market?
Which region commanded the largest share of the Distribution Lines and Poles Market in 2024?
Table of Content
Chapter 1. Report Introduction
- 1.1 Report Description & Purpose
- 1.1.1 Report Title & Market Definition
- 1.1.2 Unique Selling Propositions (USP) & Key Differentiators
- 1.1.3 Value Proposition for Stakeholders
- 1.2 Research Objectives
- 1.2.1 Market Sizing Objectives (Volume & Revenue)
- 1.2.2 Segmentation Objectives
- 1.2.3 Competitive Intelligence Objectives
- 1.2.4 Forecast & Scenario Objectives
- 1.3 Report Scope
- 1.3.1 Distribution Lines and Poles Scope – Types & Subtypes Covered
- 1.3.2 Geographic Scope – Regions & Countries Covered
- 1.3.3 Historical Period, Base Year & Forecast Period (the historical period; forecast to 2032)
- 1.3.4 Inclusions & Exclusions
- 1.4 HS Code & Classification Framework
- 1.5 Currency, Units & Pricing Basis
- 1.6 Target Stakeholders
- 1.7 Limitations & Assumptions
Chapter 2. Executive Summary
- 2.1 Global Distribution Lines and Poles Market Snapshot
- 2.1.1 Market Size – Historical (the historical period) & Forecast (2032) (base year: USD 108.32 billion → 2032: USD 140.45 billion)
- 2.1.2 Volume & Revenue – Global Totals
- 2.1.3 Key Market Highlights – Top Five Facts
- 2.2 Distribution Lines and Poles Market Segmentation Snapshot
- 2.2.1 Market Split by Region – vs. 2032
- 2.3 Competitive Snapshot
- 2.3.1 Top 10 Players by Revenue Share –
- 2.3.2 Top 10 Players by Volume Share –
- 2.3.3 Recent Strategic Developments (18-Month Summary)
- 2.4 Key Investment Highlights & Strategic Conclusions
Chapter 3. Distribution Lines and Poles Market Dynamics & Industry Analysis
- 3.1 Market Overview & Context
- 3.1.1 Distribution Lines and Poles Market Position in the Broader Automotive Value Chain
- 3.1.2 OEM vs. Replacement Market Dynamics
- 3.1.3 Market Maturity & Development Stage by Region
- 3.2 Distribution Lines and Poles Market Drivers
- 3.3 Distribution Lines and Poles Market Restraints & Challenges
- 3.4 Distribution Lines and Poles Market Opportunities
- 3.5 Porter's Five Forces Analysis
- 3.5.1 Threat of New Entrants
- 3.5.2 Bargaining Power of Suppliers
- 3.5.3 Bargaining Power of Buyers
- 3.5.4 Threat of Substitutes
- 3.5.5 Competitive Rivalry – Intensity Assessment
- 3.6 Distribution Lines and Poles Value Chain Analysis
- 3.6.1 Upstream – Raw Material/Input Suppliers
- 3.6.1.1 Raw Material/Input 1
- 3.6.1.2 Raw Material/Input 2
- 3.6.1.3 Raw Material/Input 3
- 3.6.2 Midstream – Production/Manufacturing/Service Delivery
- 3.6.2.1 Production/Process Overview
- 3.6.2.2 Key Facility Locations & Capacity by Manufacturer
- 3.6.3 Downstream – Distribution & End Consumer
- 3.6.3.1 Primary Channel – B2B/OEM
- 3.6.3.2 Secondary Channels – Dealer, Retail, Online, Direct
- 3.6.4 Value Chain Profitability Analysis
- 3.6.1 Upstream – Raw Material/Input Suppliers
- 3.7 PESTEL Analysis
- 3.7.1 Political Factors
- 3.7.2 Economic Factors
- 3.7.3 Social Factors
- 3.7.4 Technological Factors
- 3.7.5 Environmental Factors
- 3.7.6 Legal Factors
- 3.8 Distribution Lines and Poles Supply Chain Analysis
- 3.8.1 Raw Material/Input Supply Risk Assessment
- 3.8.2 Manufacturing Concentration Risk (Geographic Exposure)
- 3.8.3 Trade Disruption Impact Analysis
- 3.9 Regulatory & Policy Landscape
Note: The regulatory and policy landscape section covers regulations based on their applicability to the market, Distribution Lines and Poles category, geography, and scope of the study. Only regulatory frameworks with a material impact on operations, compliance, trade, sustainability, or market access are analyzed in detail.
Chapter 4. Key Investment Pockets & Opportunity Analysis
- 4.1 Distribution Lines and Poles Market Attractiveness Analysis
- 4.1.1 By Region – Investment Attractiveness Matrix (Volume × CAGR)
- 4.2 Absolute Revenue Growth Opportunity
- 4.2.1 By Region – Absolute USD Growth Through 2032
- 4.3 Incremental Volume Opportunity
- 4.3.1 By Region – Incremental Volume Through 2032
- 4.3.2 Segment – Incremental Volume
- 4.4 Emerging Submarket Opportunity Deep Dive (Subject to Applicability)
- 4.5 Emerging Market Opportunity Scorecards
- 4.5.1 United States
- 4.5.2 Europe
- 4.5.3 Asia
- 4.5.4 Middle East & Africa
Note: Emerging Market Opportunity Scorecards will be included based on relevance and strategic importance. Regions listed are indicative and may vary depending on data availability and market dynamics.
Chapter 5. Distribution Lines and Poles Import-Export Analysis & Trade Flows
- 5.1 Global Trade Overview
- 5.1.1 Global Export Value by Country (the historical period)
- 5.1.2 Global Export Volume by Country (the historical period)
- 5.1.3 Global Import Value by Country (the historical period)
- 5.1.4 Global Import Volume by Country (the historical period)
- 5.1.5 Net Trade Balance by Country (the historical period)
- 5.2 Export Analysis – Segment
- 5.2.1 Type 1 (HS Code)
- 5.2.2 Type 2 (HS Code)
- 5.2.3 Type 3 (HS Code)
- 5.2.4 Type 4 (HS Code)
- 5.2.5 Type 5 (HS Code)
- 5.3 Import Analysis – Segment
- 5.3.1 Type 1 (HS Code)
- 5.3.2 Type 2 (HS Code)
- 5.3.3 Type 3 (HS Code)
- 5.3.4 Type 4 (HS Code)
- 5.3.5 Type 5 (HS Code)
- 5.4 Average Unit Trade Prices
- 5.4.1 Average Export Price – Segment & Country
- 5.4.2 Average Import Price – Segment & Source Country
- 5.4.3 Price Trends (the historical period)
- 5.5 Key Trade Route Analysis
- 5.5.1 Trade Route 1
- 5.5.2 Trade Route 2
- 5.5.3 Trade Route 3
- 5.5.4 Trade Route 4
- 5.5.5 Trade Route 5
- 5.6 Trade Policy Impact Assessment
- 5.6.1 US Anti-Dumping & Section 301 Tariffs
- 5.6.2 EU Customs Union Impact
- 5.6.3 Major Free Trade Agreements
- 5.6.4 USMCA Rules of Origin
Note: Trade policy analysis will be included only where relevant to the Distribution Lines and Poles market.
Chapter 6. Competitive Landscape & Company Benchmarking
- 6.1 Distribution Lines and Poles Market Concentration & Structure
- 6.1.1 Herfindahl-Hirschman Index (HHI) – vs.
- 6.1.2 Tier 1, Tier 2 & Tier 3 Market Structure
- 6.1.3 Global, Regional & Local Player Dynamics
- 6.2 Distribution Lines and Poles Market Share Analysis –
- 6.2.1 Global Revenue Share by Company
- 6.2.2 Global Volume Share by Company
- 6.2.3 Regional Revenue Share
- 6.2.4 Market Share Evolution ( vs. )
- 6.2.5 OEM Segment Share by Company
- 6.2.6 Replacement Segment Share by Company
- 6.3 Production/Delivery Capacity & Facility Analysis
- 6.3.1 Global Installed Capacity
- 6.3.2 Capacity Utilization Rates
- 6.3.3 Production/Output Volume
- 6.3.4 Facility Locations & Capacity Map
- 6.3.5 Planned Capacity Additions
- 6.4 Distribution Lines and Poles Competitive Benchmarking Matrix
- 6.4.1 Revenue, Volume, CAGR & Profitability Comparison
- 6.4.2 Channel Revenue Mix
- 6.4.3 Geographic Revenue Exposure
- 6.4.4 R&D Intensity
- 6.4.5 Sustainability Maturity
- 6.5 Strategic Developments in Distribution Lines and Poles (Last 24 Months)
- 6.5.1 Mergers, Acquisitions & Divestments
- 6.5.2 New Distribution Lines and Poles Launches
- 6.5.3 Facility Expansions
- 6.5.4 Strategic Alliances, Joint Ventures & Partnerships
- 6.5.5 Distribution Expansion & Market Entry
- 6.5.6 Sustainability & ESG Initiatives
- 6.6 Competitive Strategy Mapping
- 6.6.1 Leader, Challenger, Follower & Niche Classification
- 6.6.2 Pricing Strategy Comparison
- 6.6.3 Channel Strategy Matrix
Note: Strategic developments are included based on their materiality and the availability of reliable information.
Chapter 7. Global Distribution Lines and Poles Market – By Distribution Channel
- 7.1 Segment Overview
- 7.1.1 Volume & Revenue Split by Channel ( & 2032)
- 7.1.2 Channel Mix Evolution (2032)
Chapter 8. Regional Market Analysis – Global Overview
- 8.1 Global Regional Overview
- 8.1.1 Regional Volume Share
- 8.1.2 Regional Revenue Share
- 8.1.3 Regional Volume by Region
- 8.1.4 Regional Revenue by Region
- 8.1.5 Regional Forecast Through 2032
- 8.2 Cross-Regional Segment Analysis
- 8.2.1 By Distribution Channel
- 8.2.2 By Brand/Price Tier
Chapter 9. North America Distribution Lines and Poles Market
- 9.1 United States
- 9.2 Canada
- 9.3 Mexico
Chapter 10. Europe Distribution Lines and Poles Market
- 10.1 Germany
- 10.2 France
- 10.3 Italy
- 10.4 United Kingdom
- 10.5 Spain
- 10.6 Poland
- 10.7 Russia
- 10.8 Netherlands
- 10.9 Belgium
- 10.10 Sweden
- 10.11 Denmark
- 10.12 Norway
- 10.13 Rest of Europe
Chapter 11. Asia Pacific Distribution Lines and Poles Market
- 11.1 China
- 11.2 India
- 11.3 Japan
- 11.4 South Korea
- 11.5 Thailand
- 11.6 Indonesia
- 11.7 Vietnam
- 11.8 Malaysia
- 11.9 Australia
- 11.10 Rest of Asia Pacific
Chapter 12. Latin America Distribution Lines and Poles Market
- 12.1 Brazil
- 12.2 Argentina
- 12.3 Colombia
- 12.4 Chile
- 12.5 Rest of Latin America
Chapter 13. Middle East Distribution Lines and Poles Market
- 13.1 Saudi Arabia
- 13.2 United Arab Emirates
- 13.3 Turkey
- 13.4 Israel
- 13.5 Iran
- 13.6 Rest of the Middle East
Chapter 14. Africa Distribution Lines and Poles Market
- 14.1 South Africa
- 14.2 Egypt
- 14.3 Nigeria
- 14.4 Morocco
- 14.5 Rest of Africa
Chapter 15. Distribution Lines and Poles Company Profiles
- 15.1 [Company 01]
- 15.1.1 Company Overview
- 15.1.2 Key Management Personnel
- 15.1.3 Products & Services Portfolio
- 15.1.4 Financial Performance
- 15.1.5 Key Market Focus & Geographic Presence
- 15.1.6 Recent Developments & Strategic Initiatives
Note: The company profile list is preliminary and may change based on research findings, market developments, data availability, and client requirements.
Chapter 16. Appendices
- Appendix A – List of Abbreviations & Acronyms
- Appendix B – Industry Classification Code Reference – Full Series
- Appendix C – Production & Capacity Data Tables
- Appendix D – End-Use & Demand Base Tables
- Appendix E – Consumption & Replacement Rate Assumptions
- Appendix F – ASP Reference Tables
- Appendix G – Manufacturing & Facility Database
- Appendix H – Import-Export Data Tables
- Appendix I – Regulatory Summary Tables
- Appendix J – Primary Research Participant List (Anonymized)
- Appendix K – Primary Research Questionnaire Framework
- Appendix L – Data Sources & Bibliography
- Appendix M – Market Size Divergence & Source Comparison
Chapter 17. Research Methodology
- 17.1 Research Framework & Philosophy
- 17.2 Secondary Research – Sources, Hierarchy & Data Extraction
- 17.3 Data Modeling – Bottom-Up & Top-Down Market Sizing
- 17.4 Primary Research – Stakeholder Framework, LOI & Sample Sizes
- 17.5 Forecast Methodology – Regression, Scenario & Sensitivity Analysis
- 17.6 Quality Control – Four-Layer Validation Framework
- 17.7 Limitations & Standard Assumptions
- 17.8 Disclaimer
