
Market overview
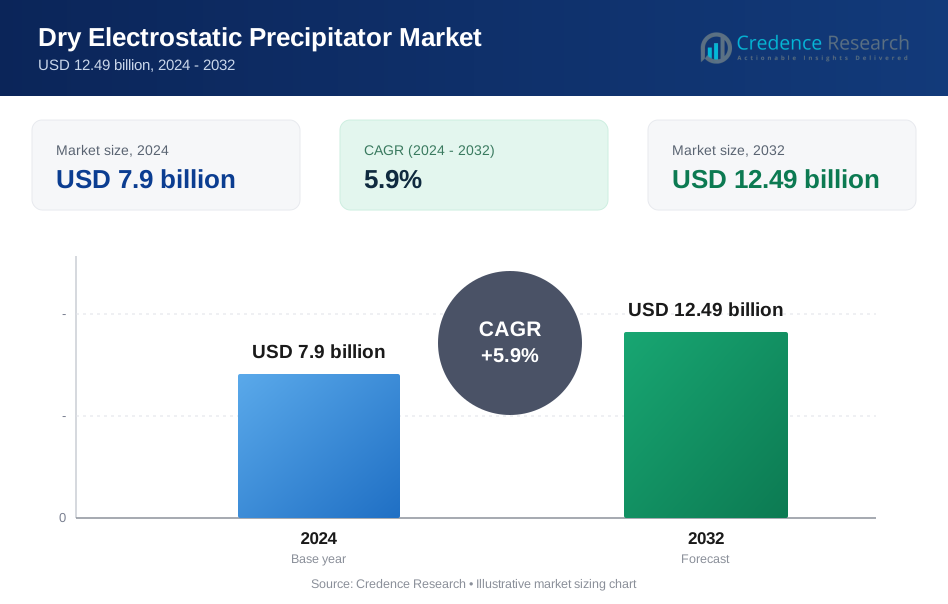
The Dry Electrostatic Precipitator market was valued at USD 7.9 billion in 2024 and is projected to reach USD 12.49 billion by 2032, growing at a CAGR of 5.9% over the forecast period.
| REPORT ATTRIBUTE | DETAILS |
|---|---|
| Historical Period | 2020-2023 |
| Base Year | 2024 |
| Forecast Period | 2025-2032 |
| Dry Electrostatic Precipitator Market Size 2024 | USD 7.9 billion |
| Dry Electrostatic Precipitator Market, CAGR | 5.9% |
| Dry Electrostatic Precipitator Market Size 2032 | USD 12.49 billion |
The leading players in the dry electrostatic precipitator market include Babcock & Wilcox Enterprises, Mitsubishi Heavy Industries and DÜRR Group, which together command 38.2% of the global market share. The Asia‑Pacific region leads adoption with over 40% of the market, driven by industrial expansion and strict emissions controls. North America and Europe follow, representing a combined share exceeding 30%, supported by retrofit projects and regulatory enforcement in power generation and heavy industries.
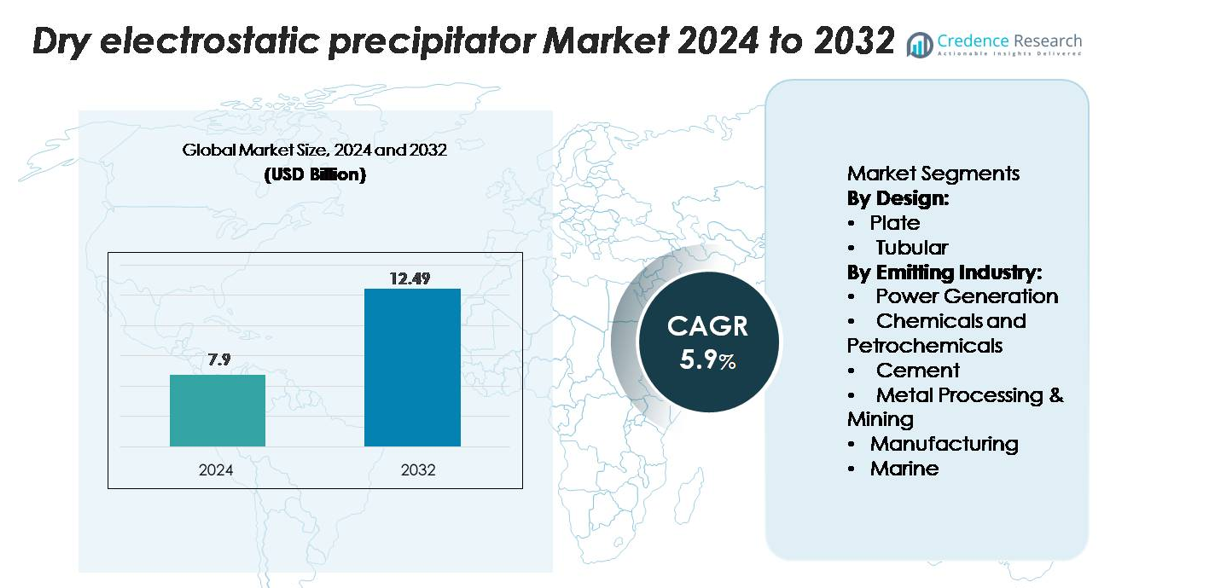
Market Insights
- The dry electrostatic precipitator market reached USD 8.4 billion in 2025 and is projected to grow at a CAGR of 6.1% to reach USD 15.2 billion by 2035.
- The plate‑design segment holds a dominant 63.2% share in 2025, driven by its superior suitability in high‑capacity plants and cost‑efficiency.
- The power generation emitting industry leads with a 34.7% share, presenting strong opportunities as renewables, retrofits and emission controls gain momentum.
- The top three players (Babcock & Wilcox Enterprises, Mitsubishi Heavy Industries, DÜRR Group) command about 38.2% of the industry, while high initial capital costs and maintenance burdens hinder broader adoption.
- The Asia‑Pacific region accounts for over 40% of global revenue in 2023, supported by rapid industrialisation and strict air‑quality norms, while North America and Europe hold a combined share of over 30%.
Market Segmentation Analysis:
By Design:
The Dry Electrostatic Precipitator market is primarily segmented into Plate and Tubular designs. Plate-type precipitators dominate the segment, holding the largest market share due to their efficient dust collection, compact design, and suitability for high-capacity industrial applications. These units are preferred in large-scale power plants and cement factories where consistent particulate removal is critical. Plate designs also offer lower maintenance requirements and enhanced longevity compared to tubular units. Innovations in high-voltage electrode configurations and corrosion-resistant plates further drive adoption, enabling industries to meet stricter emission standards while maintaining operational efficiency.
- For instance, Babcock & Wilcox provides dry electrostatic precipitators (ESPs) for coal-fired power plants that are capable of over 99.9% particulate collection efficiency across a wide range of capacities, offering reliable operation with minimal maintenance requirements.
By Emitting Industry:
The market is segmented by emitting industries, including Power Generation, Chemicals and Petrochemicals, Cement, Metal Processing & Mining, Manufacturing, and Marine. Power generation leads with the largest share, driven by stringent environmental regulations and growing electricity demand. Utilities increasingly invest in dry ESPs to control fly ash and particulate emissions, ensuring compliance with local and international emission norms. Advances in high-temperature and corrosion-resistant materials allow deployment across fossil fuel, biomass, and waste-to-energy plants. Growing industrialization in emerging economies and emphasis on sustainable operations further propel demand in the chemical, cement, and metal processing sectors.
- For instance, KC Cottrell India has executed numerous projects, including retrofitting Electrostatic Precipitator (ESP) units for large power plants, such as 500 MW units. These systems are designed to achieve high collection efficiencies, typically above 99.5%, to meet environmental compliance standards.
Key Growth Drivers
Stringent Environmental Regulations
Government regulations on particulate matter emissions in power, cement, and metal industries drive dry electrostatic precipitator adoption. Compliance with limits on fly ash, dust, and fine particulates compels industries to upgrade existing filtration systems or install high-efficiency ESPs. For instance, power plants in Europe and North America invest in dry ESPs to meet emission standards under directives such as the EU Industrial Emissions Directive and the U.S. Clean Air Act. The ability of dry ESPs to handle high-temperature and high-volume flue gases while maintaining low particulate emissions strengthens their appeal. Additionally, industries in emerging economies are increasingly adopting dry ESPs to align with environmental sustainability goals, further expanding market demand. Continuous innovation in electrode design and voltage control improves collection efficiency, reinforcing compliance and operational reliability for industrial operators.
- For instance, Babcock & Wilcox deployed a dry ESP at a 600 MW coal-fired plant in the U.S., achieving dust outlet concentrations of 18 mg/Nm³ while treating 5 million Nm³/h of flue gas with continuous operation over 3,000 hours annually.
Rising Industrialization and Infrastructure Development
Expanding industrial and infrastructure projects across Asia-Pacific, the Middle East, and Latin America support dry ESP market growth. Power generation, cement manufacturing, metal processing, and chemical plants experience rising output, increasing particulate emissions and the need for efficient filtration solutions. High-capacity dry ESPs cater to large-scale operations, providing cost-effective and reliable dust control for industrial emissions. For instance, Chinese and Indian thermal power plants deploy multi-field ESPs capable of capturing over 99% of fly ash under challenging operational conditions. Urbanization and construction growth further drive cement production, directly influencing the installation of dry ESPs. Manufacturers respond by offering scalable and modular systems suitable for diverse plant capacities, promoting widespread adoption. The combination of regulatory pressure and rapid industrial expansion ensures consistent market demand over the forecast period.
- For instance, Ducon (presumably Ducon Infratechnologies or an affiliate) did not supply the multi-field dry electrostatic precipitator (ESP) for the NTPC Talcher Thermal Power Project Stage-III. The Engineering, Procurement, and Construction (EPC) contract for this project was awarded to Bharat Heavy Electricals Limited (BHEL) in September 2022.
Technological Advancements in ESP Systems
Technological improvements enhance the efficiency, durability, and adaptability of dry ESPs, supporting market expansion. Advanced designs include high-voltage power supplies, optimized plate and tubular configurations, and corrosion-resistant electrodes for harsh flue gas conditions. For instance, Mitsubishi Hitachi Power Systems introduced ESP units with integrated digital monitoring, reducing maintenance frequency and improving collection efficiency above 99.5% in coal-fired plants. Automation, predictive maintenance, and remote monitoring enable real-time performance tracking, reducing downtime and operational costs. The integration of energy-saving features and modular designs also appeals to industries seeking lower lifecycle costs. These innovations drive adoption across traditional and emerging industrial sectors, reinforcing the market’s long-term growth trajectory.
Key Trends & Opportunities
Integration of Digital Monitoring and Predictive Maintenance
The market is witnessing a shift toward digitalized ESP systems that incorporate real-time monitoring, predictive analytics, and remote diagnostics. Modern ESP units feature SCADA interfaces, thermal sensors, and fault detection algorithms, enabling operators to track voltage, current, and particle collection efficiency. For instance, Babcock & Wilcox introduced digitally monitored dry ESPs capable of predicting component failure and scheduling maintenance proactively. This trend reduces downtime, improves operational reliability, and lowers overall maintenance costs. The integration of software-driven controls creates opportunities for service contracts, data analytics, and performance optimization across power plants, cement factories, and chemical facilities. Manufacturers focusing on smart ESP solutions gain a competitive edge, particularly in regions emphasizing operational efficiency and sustainability.
- For instance, Babcock & Wilcox offers advanced digital control systems and sensor arrays for its dry electrostatic precipitator (ESP) units, often integrated into industrial boiler projects. These systems monitor various operating parameters to enable maintenance teams to detect potential issues and schedule repairs more effectively through predictive diagnostics, improving reliability and efficiency.
Growing Adoption in Emerging Economies
Emerging markets present significant opportunities due to rapid industrialization, urbanization, and increasing environmental awareness. Countries such as India, China, and Brazil invest heavily in power generation, cement production, and metal processing, driving demand for efficient dust collection solutions. For instance, Indian thermal power plants increasingly deploy high-capacity dry ESPs to manage fly ash and meet national emission standards. Opportunities exist for manufacturers to offer cost-effective, scalable, and modular ESP systems tailored for local industrial capacities. Expanding renewable energy infrastructure and waste-to-energy plants also present new applications, allowing dry ESP suppliers to diversify offerings and strengthen market presence in high-growth regions.
- For instance, KC Cottrell is listed as a supplier of air pollution control equipment to NTPC, and ESP installations at the NTPC Dadri thermal power plant are documented to operate within Indian emission norms that prescribe particulate levels not exceeding 30 milligrams per cubic meter, as per official environmental compliance records.
Key Challenges
High Capital and Maintenance Costs
Dry ESPs require substantial upfront investment and regular maintenance, which can constrain adoption, particularly among small and medium-sized industrial operators. High-voltage power supplies, corrosion-resistant electrodes, and complex plate or tubular configurations contribute to elevated capital expenditure. Maintenance includes periodic cleaning, electrode replacement, and monitoring system calibration, increasing operational costs. For instance, metal processing and cement plants must schedule downtime for electrode inspection and ash removal, affecting production efficiency. These financial constraints may delay upgrades or installations, limiting market penetration in cost-sensitive regions. Manufacturers must balance performance, durability, and cost-effectiveness to address this challenge and encourage wider adoption.
Operational Efficiency under Variable Flue Gas Conditions
Dry ESP performance can be impacted by variations in flue gas composition, temperature, and moisture content, presenting a technical challenge. High dust load, sticky particles, or corrosive gases reduce collection efficiency and require customized designs or frequent maintenance. For example, chemical plants emitting acidic or high-temperature gases must deploy specialized corrosion-resistant electrodes, adding complexity to installation and operation. Fluctuating gas flow rates in power generation or cement processes also affect ESP efficiency, requiring real-time monitoring and adaptive voltage controls. Ensuring consistent performance under diverse industrial conditions remains a critical challenge for manufacturers and end-users, influencing operational reliability and lifecycle costs.
Regional Analysis
Asia Pacific
Asia Pacific holds roughly 47 % of the global dry ESP market, making it the largest region. This dominance stems from rapid industrialisation in countries such as China and India, high volumes of coal‑fired power generation, cement and metal‑processing activity, and increasingly strict air‑emission regulations. Plant operators in the region invest heavily in particulate‑control technologies to comply with environmental standards. The rising manufacturing output and infrastructure build‑out further drive demand for dry ESP systems capable of handling high‑dust and high‑temperature exhaust streams.
North America
North America accounts for about 18 %–20 % of the market. The region’s growth is driven by stringent regulatory frameworks (EPA standards) and retrofits of aging power and industrial plants. Utilities and industrial operators upgrade or replace legacy filtration equipment to meet emission targets and reduce particulate matter. The prevalence of mature markets means slower growth compared to Asia, but stable demand persists for upgrades, maintenance and modern dry ESP solutions designed for high efficiency and reliability.
Europe
Europe holds approximately 20 % of the market share. Strong environmental policy, active industrial sectors (cement, chemicals, metal processing) and carbon‑emission targets encourage adoption of dry ESP technology. European plants increasingly retro‑fit older equipment and install new systems to handle tighter particulate and dust‑emission limits. The emphasis on sustainability and emissions transparency drives demand for advanced dry precipitators and service contracts across the region.
Latin America
Latin America contributes around 5 % of the global dry ESP market. Growth is supported by rising power‑generation capacity, cement production, and metal‑mining activities, particularly in Brazil and Mexico. As environmental regulations tighten and awareness of air‑quality issues increases, more operators turn to dry ESP solutions. Market penetration remains moderate due to investment constraints, but opportunities exist for modular, low‑capex systems tailored to smaller industrial plants.
Middle East & Africa (MEA)
The MEA region holds roughly 5 % of global share and presents faster‑growing potential. Key drivers include expansion of power generation (including gas, oil and waste‑to‑energy plants), mining operations, and regional initiatives to curb dust‑pollution from industry. Many plants are installing dry ESP systems to meet emerging regulatory requirements and to address high‑ash or high‑temperature exhaust streams common in the region’s industrial sectors.
Market Segmentations:
By Design:
- Plate
- Tubular
By Emitting Industry:
- Power Generation
- Chemicals and Petrochemicals
- Cement
- Metal Processing & Mining
- Manufacturing
- Marine
By Geography
- North America
- U.S.
- Canada
- Mexico
- Europe
- Germany
- France
- U.K.
- Italy
- Spain
- Rest of Europe
- Asia Pacific
- China
- Japan
- India
- South Korea
- South-east Asia
- Rest of Asia Pacific
- Latin America
- Brazil
- Argentina
- Rest of Latin America
- Middle East & Africa
- GCC Countries
- South Africa
- Rest of the Middle East and Africa
Competitive Landscape
The competitive landscape of the dry electrostatic precipitator (ESP) market is notably consolidated, with the top three firms — Babcock & Wilcox Enterprises, Mitsubishi Heavy Industries, and Dürr Group — commanding approximately 38% of the global market. These leaders maintain their positions through advanced technology portfolios, global service networks, and turnkey emission‑control offerings. Many have shifted toward retrofits and upgrades of ageing installed ESP systems, securing long‑term service contracts and expanding aftermarket revenues. Meanwhile, smaller regional and specialist suppliers focus on niche geographies or industries such as marine, cement and mining, and differentiate via modular designs or cost‑effective solutions. Rapid regulatory pressures and emerging‑economy demand continue to intensify competition, with manufacturers forging alliances or acquisitions to broaden footprint and sharpen their value‑propositions.
Key Player Analysis
- DURR Group
- Siemens Energy
- ANDRITZ GROUP
- Babcock and Wilcox Enterprises
- GEA Group Aktiengesellschaft
- KC Cottrell India
- Duconenv
- Mitsubishi Heavy Industries
- PPC Industries
- Enviropol Engineers
Recent Developments
- In February 2025, DÜRR announced a collaboration with Cellforce Group GmbH and LiCAP Technologies Inc. to advance dry‑coating electrode production technology.
- In February 2025, ANDRITZ completed the acquisition of LDX Solutions (specialist in emission‑reduction technologies including WESP/ESP systems) to strengthen its environmental‑technology portfolio.
Report Coverage
The research report offers an in-depth analysis based on Design, Emitting industry and Geography. It details leading market players, providing an overview of their business, product offerings, investments, revenue streams, and key applications. Additionally, the report includes insights into the competitive environment, SWOT analysis, current market trends, as well as the primary drivers and constraints. Furthermore, it discusses various factors that have driven market expansion in recent years. The report also explores market dynamics, regulatory scenarios, and technological advancements that are shaping the industry. It assesses the impact of external factors and global economic changes on market growth. Lastly, it provides strategic recommendations for new entrants and established companies to navigate the complexities of the market.
Future Outlook
- Investments in older power plants will spur growth of dry electrostatic precipitator adoption as operators upgrade emission‑control systems.
- Emerging economies will lead demand, driven by industrial expansion and stricter particulate regulations across Asia‑Pacific.
- Modular and compact designs will gain traction, enabling retrofit installations in manufacturing plants and smaller cement kilns.
- Digital monitoring and predictive maintenance will become standard, reducing downtime and maintenance burdens for operators.
- Demand for high‑efficiency collection (99%+), especially in metal and mining sectors, will increase as emission norms tighten.
- Competitive focus will shift toward service contracts and systems integration, not just equipment sales.
- Tubular design growth will accelerate, offering flexibility in layout and lower footprint than traditional plate systems.
- Adoption in marine and waste‑to‑energy plants will expand, opening new verticals beyond power and cement industries.
- Lifecycle cost pressures will drive development of corrosion‑resistant materials and lower‑energy configurations.
- Capital cost and operational complexity will remain obstacles for SMEs, limiting pace of adoption without financing solutions.
Request a Free Sample
Fill in your details and we'll send you a free sample report.
- Sample data tables & charts
- Research methodology
Need a Custom Version of This Report?
Tailor the scope, geography, or segments to your exact requirements.
- Custom geography or segment scope
- Direct access to our analyst team
Frequently Asked Questions
What is the current market size for Dry Electrostatic Precipitator, and what is its projected size in 2032?
At what Compound Annual Growth Rate is the Dry Electrostatic Precipitator projected to grow between 2025 and 2032?
Which Dry Electrostatic Precipitator segment held the largest share in 2024?
What are the primary factors fueling the growth of the Dry Electrostatic Precipitator?
Who are the leading companies in the Dry Electrostatic Precipitator market?
Table of Content
Chapter 1. Report Introduction
- 1.1 Report Description & Purpose
- 1.1.1 Report Title & Market Definition
- 1.1.2 Unique Selling Propositions (USP) & Key Differentiators
- 1.1.3 Value Proposition for Stakeholders
- 1.2 Research Objectives
- 1.2.1 Market Sizing Objectives (Volume & Revenue)
- 1.2.2 Segmentation Objectives
- 1.2.3 Competitive Intelligence Objectives
- 1.2.4 Forecast & Scenario Objectives
- 1.3 Report Scope
- 1.3.1 Dry Electrostatic Precipitator Scope – Types & Subtypes Covered
- 1.3.2 Geographic Scope – Regions & Countries Covered
- 1.3.3 Historical Period, Base Year & Forecast Period (2024; forecast to 2032)
- 1.3.4 Inclusions & Exclusions
- 1.4 HS Code & Classification Framework
- 1.5 Currency, Units & Pricing Basis
- 1.6 Target Stakeholders
- 1.7 Limitations & Assumptions
Chapter 2. Executive Summary
- 2.1 Global Dry Electrostatic Precipitator Market Snapshot
- 2.1.1 Market Size – Historical (2024) & Forecast (2024-2032) (2024: USD 7.9 billion → 2032: USD 12.49 billion)
- 2.1.2 Volume & Revenue – Global Totals
- 2.1.3 Key Market Highlights – Top Five Facts
- 2.2 Dry Electrostatic Precipitator Market Segmentation Snapshot
- 2.2.1 Market Split by Region – 2024 vs. 2032
- 2.3 Competitive Snapshot
- 2.3.1 Top 10 Players by Revenue Share – 2024
- 2.3.2 Top 10 Players by Volume Share – 2024
- 2.3.3 Recent Strategic Developments (18-Month Summary)
- 2.4 Key Investment Highlights & Strategic Conclusions
Chapter 3. Dry Electrostatic Precipitator Market Dynamics & Industry Analysis
- 3.1 Market Overview & Context
- 3.1.1 Dry Electrostatic Precipitator Market Position in the Broader Automotive Value Chain
- 3.1.2 OEM vs. Replacement Market Dynamics
- 3.1.3 Market Maturity & Development Stage by Region
- 3.2 Dry Electrostatic Precipitator Market Drivers
- 3.3 Dry Electrostatic Precipitator Market Restraints & Challenges
- 3.4 Dry Electrostatic Precipitator Market Opportunities
- 3.5 Porter's Five Forces Analysis
- 3.5.1 Threat of New Entrants
- 3.5.2 Bargaining Power of Suppliers
- 3.5.3 Bargaining Power of Buyers
- 3.5.4 Threat of Substitutes
- 3.5.5 Competitive Rivalry – Intensity Assessment
- 3.6 Dry Electrostatic Precipitator Value Chain Analysis
- 3.6.1 Upstream – Raw Material/Input Suppliers
- 3.6.1.1 Raw Material/Input 1
- 3.6.1.2 Raw Material/Input 2
- 3.6.1.3 Raw Material/Input 3
- 3.6.2 Midstream – Production/Manufacturing/Service Delivery
- 3.6.2.1 Production/Process Overview
- 3.6.2.2 Key Facility Locations & Capacity by Manufacturer
- 3.6.3 Downstream – Distribution & End Consumer
- 3.6.3.1 Primary Channel – B2B/OEM
- 3.6.3.2 Secondary Channels – Dealer, Retail, Online, Direct
- 3.6.4 Value Chain Profitability Analysis
- 3.6.1 Upstream – Raw Material/Input Suppliers
- 3.7 PESTEL Analysis
- 3.7.1 Political Factors
- 3.7.2 Economic Factors
- 3.7.3 Social Factors
- 3.7.4 Technological Factors
- 3.7.5 Environmental Factors
- 3.7.6 Legal Factors
- 3.8 Dry Electrostatic Precipitator Supply Chain Analysis
- 3.8.1 Raw Material/Input Supply Risk Assessment
- 3.8.2 Manufacturing Concentration Risk (Geographic Exposure)
- 3.8.3 Trade Disruption Impact Analysis
- 3.9 Regulatory & Policy Landscape
Note: The regulatory and policy landscape section covers regulations based on their applicability to the market, Dry Electrostatic Precipitator category, geography, and scope of the study. Only regulatory frameworks with a material impact on operations, compliance, trade, sustainability, or market access are analyzed in detail.
Chapter 4. Key Investment Pockets & Opportunity Analysis
- 4.1 Dry Electrostatic Precipitator Market Attractiveness Analysis
- 4.1.1 By Region – Investment Attractiveness Matrix (Volume × CAGR)
- 4.2 Absolute Revenue Growth Opportunity
- 4.2.1 By Region – Absolute USD Growth Through 2032
- 4.3 Incremental Volume Opportunity
- 4.3.1 By Region – Incremental Volume Through 2032
- 4.3.2 Segment – Incremental Volume
- 4.4 Emerging Submarket Opportunity Deep Dive (Subject to Applicability)
- 4.5 Emerging Market Opportunity Scorecards
- 4.5.1 United States
- 4.5.2 Europe
- 4.5.3 Asia
- 4.5.4 Middle East & Africa
Note: Emerging Market Opportunity Scorecards will be included based on relevance and strategic importance. Regions listed are indicative and may vary depending on data availability and market dynamics.
Chapter 5. Dry Electrostatic Precipitator Import-Export Analysis & Trade Flows
- 5.1 Global Trade Overview
- 5.1.1 Global Export Value by Country (2024)
- 5.1.2 Global Export Volume by Country (2024)
- 5.1.3 Global Import Value by Country (2024)
- 5.1.4 Global Import Volume by Country (2024)
- 5.1.5 Net Trade Balance by Country (2024)
- 5.2 Export Analysis – Segment
- 5.2.1 Type 1 (HS Code)
- 5.2.2 Type 2 (HS Code)
- 5.2.3 Type 3 (HS Code)
- 5.2.4 Type 4 (HS Code)
- 5.2.5 Type 5 (HS Code)
- 5.3 Import Analysis – Segment
- 5.3.1 Type 1 (HS Code)
- 5.3.2 Type 2 (HS Code)
- 5.3.3 Type 3 (HS Code)
- 5.3.4 Type 4 (HS Code)
- 5.3.5 Type 5 (HS Code)
- 5.4 Average Unit Trade Prices
- 5.4.1 Average Export Price – Segment & Country
- 5.4.2 Average Import Price – Segment & Source Country
- 5.4.3 Price Trends (2024)
- 5.5 Key Trade Route Analysis
- 5.5.1 Trade Route 1
- 5.5.2 Trade Route 2
- 5.5.3 Trade Route 3
- 5.5.4 Trade Route 4
- 5.5.5 Trade Route 5
- 5.6 Trade Policy Impact Assessment
- 5.6.1 US Anti-Dumping & Section 301 Tariffs
- 5.6.2 EU Customs Union Impact
- 5.6.3 Major Free Trade Agreements
- 5.6.4 USMCA Rules of Origin
Note: Trade policy analysis will be included only where relevant to the Dry Electrostatic Precipitator market.
Chapter 6. Competitive Landscape & Company Benchmarking
- 6.1 Dry Electrostatic Precipitator Market Concentration & Structure
- 6.1.1 Herfindahl-Hirschman Index (HHI) – vs. 2024
- 6.1.2 Tier 1, Tier 2 & Tier 3 Market Structure
- 6.1.3 Global, Regional & Local Player Dynamics
- 6.2 Dry Electrostatic Precipitator Market Share Analysis – 2024
- 6.2.1 Global Revenue Share by Company
- 6.2.2 Global Volume Share by Company
- 6.2.3 Regional Revenue Share
- 6.2.4 Market Share Evolution ( vs. 2024)
- 6.2.5 OEM Segment Share by Company
- 6.2.6 Replacement Segment Share by Company
- 6.3 Production/Delivery Capacity & Facility Analysis
- 6.3.1 Global Installed Capacity
- 6.3.2 Capacity Utilization Rates
- 6.3.3 Production/Output Volume
- 6.3.4 Facility Locations & Capacity Map
- 6.3.5 Planned Capacity Additions
- 6.4 Dry Electrostatic Precipitator Competitive Benchmarking Matrix
- 6.4.1 Revenue, Volume, CAGR & Profitability Comparison
- 6.4.2 Channel Revenue Mix
- 6.4.3 Geographic Revenue Exposure
- 6.4.4 R&D Intensity
- 6.4.5 Sustainability Maturity
- 6.5 Strategic Developments in Dry Electrostatic Precipitator (Last 24 Months)
- 6.5.1 Mergers, Acquisitions & Divestments
- 6.5.2 New Dry Electrostatic Precipitator Launches
- 6.5.3 Facility Expansions
- 6.5.4 Strategic Alliances, Joint Ventures & Partnerships
- 6.5.5 Distribution Expansion & Market Entry
- 6.5.6 Sustainability & ESG Initiatives
- 6.6 Competitive Strategy Mapping
- 6.6.1 Leader, Challenger, Follower & Niche Classification
- 6.6.2 Pricing Strategy Comparison
- 6.6.3 Channel Strategy Matrix
Note: Strategic developments are included based on their materiality and the availability of reliable information.
Chapter 7. Global Dry Electrostatic Precipitator Market – By Distribution Channel
- 7.1 Segment Overview
- 7.1.1 Volume & Revenue Split by Channel (2024 & 2032)
- 7.1.2 Channel Mix Evolution (2024-2032)
Chapter 8. Regional Market Analysis – Global Overview
- 8.1 Global Regional Overview
- 8.1.1 Regional Volume Share
- 8.1.2 Regional Revenue Share
- 8.1.3 Regional Volume by Region
- 8.1.4 Regional Revenue by Region
- 8.1.5 Regional Forecast Through 2032
- 8.2 Cross-Regional Segment Analysis
- 8.2.1 By Distribution Channel
- 8.2.2 By Brand/Price Tier
Chapter 9. North America Dry Electrostatic Precipitator Market
- 9.1 United States
- 9.2 Canada
- 9.3 Mexico
Chapter 10. Europe Dry Electrostatic Precipitator Market
- 10.1 Germany
- 10.2 France
- 10.3 Italy
- 10.4 United Kingdom
- 10.5 Spain
- 10.6 Poland
- 10.7 Russia
- 10.8 Netherlands
- 10.9 Belgium
- 10.10 Sweden
- 10.11 Denmark
- 10.12 Norway
- 10.13 Rest of Europe
Chapter 11. Asia Pacific Dry Electrostatic Precipitator Market
- 11.1 China
- 11.2 India
- 11.3 Japan
- 11.4 South Korea
- 11.5 Thailand
- 11.6 Indonesia
- 11.7 Vietnam
- 11.8 Malaysia
- 11.9 Australia
- 11.10 Rest of Asia Pacific
Chapter 12. Latin America Dry Electrostatic Precipitator Market
- 12.1 Brazil
- 12.2 Argentina
- 12.3 Colombia
- 12.4 Chile
- 12.5 Rest of Latin America
Chapter 13. Middle East Dry Electrostatic Precipitator Market
- 13.1 Saudi Arabia
- 13.2 United Arab Emirates
- 13.3 Turkey
- 13.4 Israel
- 13.5 Iran
- 13.6 Rest of the Middle East
Chapter 14. Africa Dry Electrostatic Precipitator Market
- 14.1 South Africa
- 14.2 Egypt
- 14.3 Nigeria
- 14.4 Morocco
- 14.5 Rest of Africa
Chapter 15. Dry Electrostatic Precipitator Company Profiles
- 15.1 [Company 01]
- 15.1.1 Company Overview
- 15.1.2 Key Management Personnel
- 15.1.3 Products & Services Portfolio
- 15.1.4 Financial Performance
- 15.1.5 Key Market Focus & Geographic Presence
- 15.1.6 Recent Developments & Strategic Initiatives
Note: The company profile list is preliminary and may change based on research findings, market developments, data availability, and client requirements.
Chapter 16. Appendices
- Appendix A – List of Abbreviations & Acronyms
- Appendix B – Industry Classification Code Reference – Full Series
- Appendix C – Production & Capacity Data Tables
- Appendix D – End-Use & Demand Base Tables
- Appendix E – Consumption & Replacement Rate Assumptions
- Appendix F – ASP Reference Tables
- Appendix G – Manufacturing & Facility Database
- Appendix H – Import-Export Data Tables
- Appendix I – Regulatory Summary Tables
- Appendix J – Primary Research Participant List (Anonymized)
- Appendix K – Primary Research Questionnaire Framework
- Appendix L – Data Sources & Bibliography
- Appendix M – Market Size Divergence & Source Comparison
Chapter 17. Research Methodology
- 17.1 Research Framework & Philosophy
- 17.2 Secondary Research – Sources, Hierarchy & Data Extraction
- 17.3 Data Modeling – Bottom-Up & Top-Down Market Sizing
- 17.4 Primary Research – Stakeholder Framework, LOI & Sample Sizes
- 17.5 Forecast Methodology – Regression, Scenario & Sensitivity Analysis
- 17.6 Quality Control – Four-Layer Validation Framework
- 17.7 Limitations & Standard Assumptions
- 17.8 Disclaimer
