
Market overview
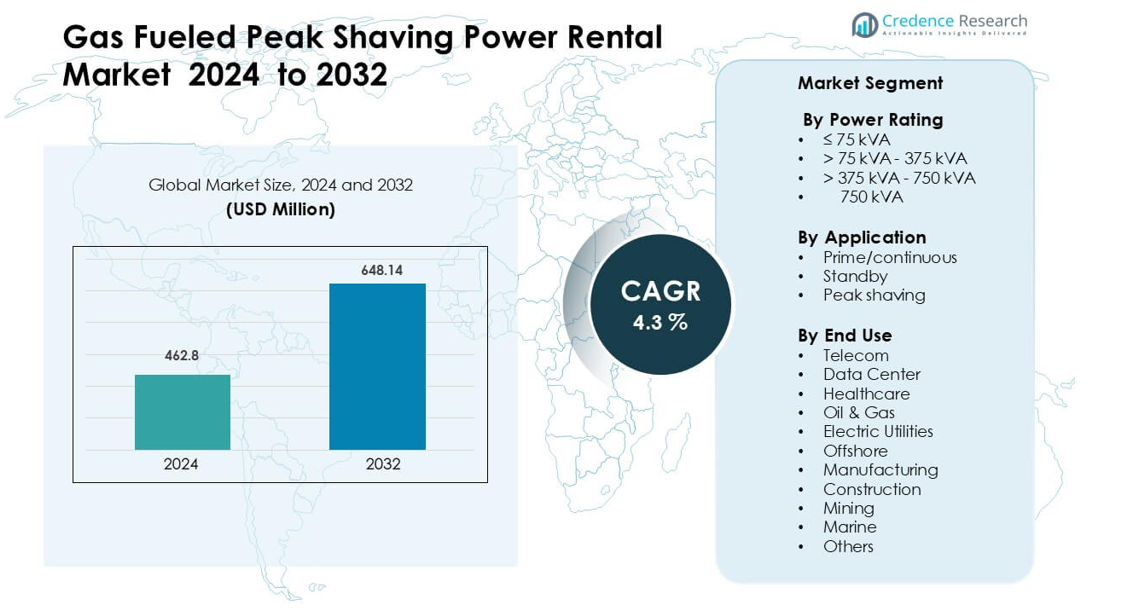
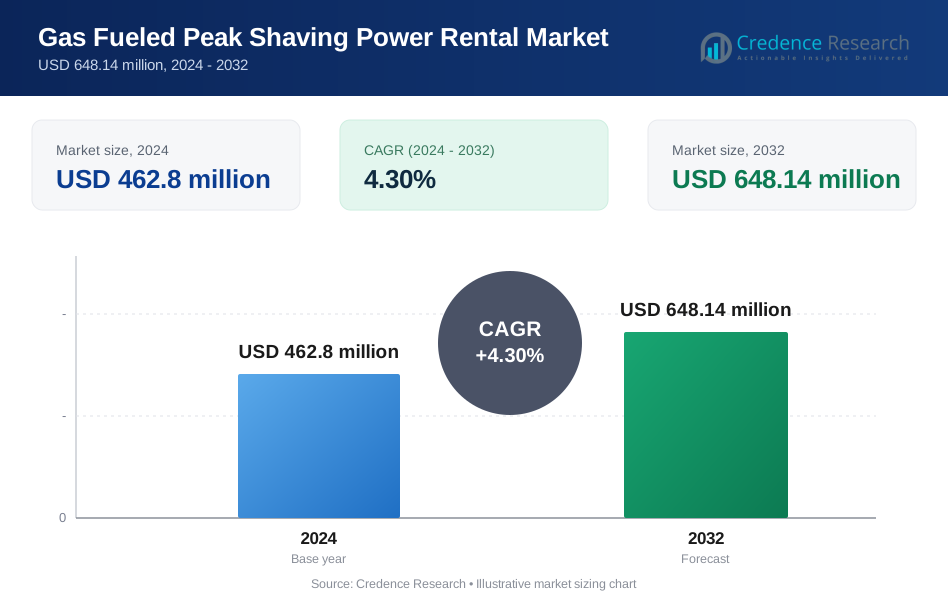
Gas Fueled Peak Shaving Power Rental Market was valued at USD 462.8 million in 2024 and is anticipated to reach USD 648.14 million by 2032, growing at a CAGR of 4.3 % during the forecast period.
| REPORT ATTRIBUTE | DETAILS |
|---|---|
| Historical Period | 2020-2023 |
| Base Year | 2024 |
| Forecast Period | 2025-2032 |
| Gas Fueled Peak Shaving Power Rental Market Size 2024 | USD 462.8 million |
| Gas Fueled Peak Shaving Power Rental Market, CAGR | 4.3% |
| Gas Fueled Peak Shaving Power Rental Market Size 2032 | USD 648.14 million |
The Gas Fueled Peak Shaving Power Rental Market is shaped by major players such as GMMCO, Generac Power Systems, Byrne Equipment Rental, HIMOINSA, Ashtead Group, Bredenoord, Aggreko, Caterpillar, Cummins, and Herc Rentals. These companies expand gas-based rental fleets, integrate digital monitoring tools, and offer hybrid peak-shaving packages to meet rising industrial and commercial demand. North America leads the global market with about 37% share in 2024, driven by strong adoption across data centers, utilities, and manufacturing sites that face high demand charges and growing grid-stability requirements.
Market Insights
- The Gas Fueled Peak Shaving Power Rental Market was USD 462.8 million in 2024 and is projected to reach USD 648.14 million by 2032, growing at a 4.3% CAGR.
- Rising demand charges and higher grid-peak penalties drive strong adoption among industrial and commercial users that need cost-effective short-term load control.
- Digital load-management tools, hybrid gas-battery models, and expansion of cleaner gaseous rental fleets shape major market trends and support wider uptake across utilities and data centers.
- Competition intensifies among GMMCO, Generac Power Systems, Byrne Equipment Rental, HIMOINSA, Ashtead Group, Bredenoord, Aggreko, Caterpillar, Cummins, and Herc Rentals as firms invest in fleet upgrades and rapid-deployment services.
- North America leads with 37% share, while Europe holds about 28%. The > 375–750 kVA segment dominates capacity demand, and peak-shaving application accounts for nearly 47% share due to its strong role in managing high-tariff periods.
Market Segmentation Analysis:
By Power Rating
The > 375 kVA – 750 kVA range leads the Gas Fueled Peak Shaving Power Rental Market with about 34% share in 2024. Mid-to-large commercial sites choose this class for strong load-handling capacity and stable peak-demand support. Growth rises as data centers, refineries, and utility operators rely on flexible rental fleets to avoid grid penalties during high-demand periods. The > 750 kVA class grows fast due to expanding heavy-industrial needs, while ≤ 75 kVA units mainly serve small facilities that require short-duration peak trimming during seasonal load spikes.
- For instance, Caterpillar’s CG137-12 gas generator has a rating of 500 kVA (400 ekW) and supports fuel from CNG, LNG or field gas, making it a preferred choice in oilfield and gas-flare peak shaving deployments.
By Application
Peak shaving dominates this segment with nearly 47% share in 2024. Companies adopt peak-shaving rentals to cut maximum-demand charges and maintain operational stability during grid strain. Demand strengthens as utilities impose higher time-of-use rates and commercial users aim to reduce power-intensity costs. Prime and continuous applications grow steadily across remote industrial zones that lack firm grid access. Standby units see rising interest from hospitals, telecom towers, and factories that need quick-start gaseous generators to prevent outages linked to grid congestion.
- For instance, Cummins’ QSK60G gas generator is rated for 1,600 kW (2,000 kVA) continuous duty, making it well-suited for peaking or prime-power peak-shaving applications.
By End Use
Electric utilities lead this segment with about 29% share in 2024 as they deploy rented gas-fueled units to stabilize feeder lines and manage seasonal demand peaks. Data centers follow due to rising server loads that require clean, fast-response gas systems for peak trimming. Telecom and healthcare segments grow due to reliability needs during voltage drops. Oil & gas, construction, and mining sites add traction as these industries face variable load cycles. Marine and offshore users adopt gas rentals for low-emission compliance and fuel-flexible backup requirements.
Key Growth Drivers
Rising Demand Charges and Grid Peak Penalties
Growing demand charges and expanding grid-peak penalties drive strong interest in gas-fueled peak shaving rentals. Many commercial and industrial sites face higher time-of-use tariffs as utilities respond to stress on transmission networks. Gas rental units help these users cut maximum-demand costs during peak hours while maintaining smooth power flow. The rentals offer quick deployment, predictable fuel behavior, and stable on-site control, which supports cost-cutting strategies across factories, data centers, and large commercial buildings. As load curves become more volatile due to electrification trends, peak shaving becomes a stronger cost-avoidance tool, pushing more businesses toward flexible rental fleets.
- For instance, Himoinsa deployed two HGP 250 T5 natural-gas generator sets in a biomedical lab to shave peak demand by over 500 kVA, running the units in parallel during high-tariff hours
Expansion of Data Centers and Digital Infrastructure
The rapid growth in regional data center clusters boosts adoption of gas-fueled peak shaving rentals. Rising server workloads and higher rack densities push facilities to manage sharp load spikes more effectively. Gas units provide fast response, low vibration, and cleaner operation compared to diesel, which helps operators meet internal sustainability targets. Many hyperscale and colocation sites also use rentals during grid congestion or transformer delays to avoid downtime. As edge-computing nodes expand and high-density cooling loads rise, data centers increasingly rent gas units to stabilize power profiles and maintain energy-cost predictability during peak operations.
- For instance, Aggreko installed 12 next-generation natural gas generators at a colocation facility in Dublin, providing 14 MW of gas-to-power capacity during commissioning.
Shift Toward Cleaner and Low-Emission Temporary Power
Industries are shifting toward low-emission rental solutions to meet internal ESG goals and comply with new air-quality rules. Gas-fueled units emit fewer NOx, SOx, and particulates than diesel, which helps operators maintain regulatory compliance in urban and industrial corridors. The lower environmental footprint also supports temporary operations in construction, utilities, telecom, and oil & gas. Many companies adopt gas rentals during peak periods to reduce diesel dependence and avoid regulatory scrutiny. This transition aligns with national clean-energy mandates, creating steady demand for flexible gas-based peak shaving units across multiple end-use sectors.
Key Trend & Opportunity
Integration of Smart Load Management Systems
Digital optimization tools create strong opportunities in the market as operators add smart load management systems to improve peak shaving efficiency. These systems analyze load curves, forecast peaks, and automate gas generator dispatch to cut demand charges. Rental providers now bundle monitoring dashboards, remote diagnostics, and predictive maintenance to enhance reliability. This shift enables customers to run rentals only when needed, reducing fuel consumption and tightening operational control. The integration of IoT-based management also expands adoption among data centers, utilities, and large manufacturing plants that value precise load balancing and lower operational risk.
- For instance, Cummins offers its PowerCommand Network system, which can parallel and synchronize generator sets in under 15 seconds, while their PowerCommand iWatch platform supports remote, real-time monitoring of over 100 engine and electrical parameters.
Growth of Hybrid Gas-Battery Peak Shaving Models
Hybrid configurations combining gas generators with battery storage create new opportunities for peak-demand control. Batteries handle short spikes and instant-response loads, while gas units support longer-duration shaving windows. This model reduces runtime on gas engines, lowers emissions, and improves operational efficiency. Rental companies are increasingly offering hybrid packages for users facing rapidly fluctuating demand patterns. The structure fits well in commercial buildings, logistics hubs, and renewable-rich regions with unstable grid behavior. As battery prices fall and hybrid control systems improve, more users shift toward gas-battery rentals to secure cleaner and more predictable power support.
- For instance, Aggreko offers hybrid power plant packages that combine gas (or diesel) generators with battery storage, helping to reduce generator run hours and emissions by using the battery as a buffer.
Key Challenge
Fuel Supply Constraints and Price Sensitivity
Fluctuating natural gas prices create a major challenge for rental users who rely on predictable operating costs. Sudden spikes in LNG or pipeline gas rates can weaken the cost advantage of peak shaving, especially for large power consumers. Some regions also face inconsistent gas availability, which limits on-site deployment in remote industrial clusters. Rental providers must coordinate stable supply chains to prevent interruptions during high-demand periods. These fuel uncertainties reduce user confidence and may drive operators toward alternative solutions such as battery-supported systems or microgrid-based demand management strategies.
Regulatory Complexity in Urban and Industrial Zones
Compliance challenges continue to affect deployment in regions with strict emission and noise regulations. Gas units offer cleaner performance than diesel, but they still face permitting requirements related to NOx levels, venting, and noise thresholds. Urban sites often need additional mitigation steps such as acoustic enclosures, catalytic reduction systems, or operational curfews. These requirements increase installation time and cost, reducing the financial advantages of renting temporary gas-based power. The complexity also delays urgent deployments for utilities, data centers, and construction projects that rely on rapid peak shaving support.
Regional Analysis
North America
North America leads the Gas Fueled Peak Shaving Power Rental Market with about 37% share in 2024. The region benefits from strong rental adoption across data centers, utilities, and manufacturing plants that face high demand charges and strict grid-stability requirements. Gas rentals gain traction as users shift from diesel to cleaner peak-shaving options to meet regulatory and ESG goals. The United States drives most demand due to expanding digital infrastructure and frequent grid congestion during summer peaks. Canada adds growth through mining, oil sands, and remote industrial applications requiring flexible temporary power.
Europe
Europe holds nearly 28% share in 2024, supported by strict emission regulations that favor gas-based rentals over diesel. Utilities use peak-shaving units to stabilize grids stressed by rising renewable integration and seasonal consumption spikes. Growth is strong in Germany, the United Kingdom, and the Nordics as industries rely on gas rentals to avoid demand penalties and ensure operational continuity. Data centers in Western Europe also adopt gas units to meet sustainability targets. Increasing electrification across transport and industry enhances interest in temporary gas-based solutions to control peak loads and manage grid imbalance.
Asia Pacific
Asia Pacific accounts for about 24% share in 2024, driven by expanding industrialization and rapid growth in data centers, telecom, and manufacturing. Countries such as China, India, and Southeast Asian markets see high demand for gas rentals to support peak loads in congested urban grids. Rising electricity tariffs and volatile consumption patterns push industries toward flexible peak-shaving solutions. Infrastructure growth, construction activity, and the rise of urban commercial centers further support adoption. The region also benefits from increasing availability of LNG and pipeline gas, which improves the viability of gas-fueled rental fleets.
Latin America
Latin America captures nearly 6% share in 2024, with demand concentrated in mining, oil & gas, and industrial sectors that rely on peak-shaving units during grid instability. Brazil, Mexico, and Chile register steady adoption as utilities face uneven demand curves and occasional supply constraints. Gas rentals grow due to lower emissions and reduced fuel storage requirements compared with diesel. Remote industrial zones adopt gas-based units to avoid high demand charges and maintain production reliability. Economic reforms and ongoing energy-market modernization support further uptake across the region.
Middle East & Africa
The Middle East & Africa region holds about 5% share in 2024, supported by demand from oil & gas, utilities, and large construction projects. Gulf countries adopt gas peak-shaving units to manage high cooling-driven load spikes and maintain grid reliability during peak summer months. In Africa, mining and industrial sites use gas rentals due to rising demand charges and grid instability. Expanding LNG availability and regional pipeline development strengthen market potential. Sustainability goals also push users to choose gas-based temporary power instead of diesel for cleaner and lower-maintenance peak-shaving operations.
Market Segmentations:
By Power Rating
- ≤ 75 kVA
- > 75 kVA - 375 kVA
- > 375 kVA - 750 kVA
- > 750 kVA
By Application
- Prime/continuous
- Standby
- Peak shaving
By End Use
- Telecom
- Data Center
- Healthcare
- Oil & Gas
- Electric Utilities
- Offshore
- Manufacturing
- Construction
- Mining
- Marine
- Others
By Geography
- North America
- U.S.
- Canada
- Mexico
- Europe
- Germany
- France
- U.K.
- Italy
- Spain
- Rest of Europe
- Asia Pacific
- China
- Japan
- India
- South Korea
- South-east Asia
- Rest of Asia Pacific
- Latin America
- Brazil
- Argentina
- Rest of Latin America
- Middle East & Africa
- GCC Countries
- South Africa
- Rest of the Middle East and Africa
Competitive Landscape
The Gas Fueled Peak Shaving Power Rental Market features strong competition among GMMCO, Generac Power Systems, Byrne Equipment Rental, HIMOINSA, Ashtead Group, Bredenoord, Aggreko, Caterpillar, Cummins, and Herc Rentals. These companies expand rental fleets to serve rising peak-load needs across industrial and commercial sites. Many providers invest in cleaner gas units to meet growing emission rules in urban zones. Firms add digital monitoring tools that improve load control and remote system visibility for users. Several players strengthen service networks to reduce deployment time during demand spikes. Partnerships with utilities and data center operators help secure long contracts. Companies also introduce hybrid gas-battery rental models to support short spikes and longer peak windows. Continuous upgrades in efficiency, noise control, and fuel systems help providers maintain a competitive edge. Rental firms further differentiate through maintenance programs that guarantee uptime and reduce user risk.
Key Player Analysis
- GMMCO
- Generac Power Systems
- Byrne Equipment Rental
- HIMOINSA
- Ashtead Group
- Bredenoord
- Aggreko
- Caterpillar
- Cummins
- Herc Rentals
Recent Developments
- In June 2025, GMMCO featured in media as Powering progress in India s mining sector, indicating an increased focus on gas-fueled genset rentals in mining operations.
- In 2024, Byrne announced its inclusion in the 2024 IRN100 (ranking of global top 100 equipment rental companies), highlighting growth of its rental fleet and capability (including power generation) in the Middle East.
- In February 2024, Byrne announced a fleet expansion to meet rising project activity in the region this includes generator rental assets which are relevant to peak-shaving power rental.
Report Coverage
The research report offers an in-depth analysis based on Power Rating, Application, End-Use and Geography. It details leading market players, providing an overview of their business, product offerings, investments, revenue streams, and key applications. Additionally, the report includes insights into the competitive environment, SWOT analysis, current market trends, as well as the primary drivers and constraints. Furthermore, it discusses various factors that have driven market expansion in recent years. The report also explores market dynamics, regulatory scenarios, and technological advancements that are shaping the industry. It assesses the impact of external factors and global economic changes on market growth. Lastly, it provides strategic recommendations for new entrants and established companies to navigate the complexities of the market.
Future Outlook
- Demand will rise as more industries face higher grid-peak penalties and volatile load patterns.
- Gas rental units will gain preference over diesel due to cleaner operation and lower emissions.
- Data center expansion will drive steady adoption of long-duration peak shaving solutions.
- Hybrid gas-battery systems will become common for managing short spikes and extended peak windows.
- Digital monitoring and predictive analytics will improve load optimization and fleet efficiency.
- Utilities will increase rental usage to stabilize feeders during seasonal demand surges.
- LNG and pipeline gas expansion will support wider deployment across emerging markets.
- Rental providers will invest in quieter, low-emission designs to meet urban compliance needs.
- Industrial users will integrate rentals into long-term energy-cost management strategies.
- Partnerships between rental companies and utility operators will expand for peak-demand programs.
Request a Free Sample
Fill in your details and we'll send you a free sample report.
- Sample data tables & charts
- Research methodology
Need a Custom Version of This Report?
Tailor the scope, geography, or segments to your exact requirements.
- Custom geography or segment scope
- Direct access to our analyst team
Frequently Asked Questions
What is the current market size for Gas Fueled Peak Shaving Power Rental Market, and what is its projected size in 2032?
At what Compound Annual Growth Rate is Gas Fueled Peak Shaving Power Rental Market projected to grow between 2025 and 2032?
Which Gas Fueled Peak Shaving Power Rental Market segment held the largest share in 2024?
What are the primary factors fueling the growth of Gas Fueled Peak Shaving Power Rental Market?
Who are the leading companies in Gas Fueled Peak Shaving Power Rental Market?
Table of Content
Chapter 1. Report Introduction
- 1.1 Report Description & Purpose
- 1.1.1 Report Title & Market Definition
- 1.1.2 Unique Selling Propositions (USP) & Key Differentiators
- 1.1.3 Value Proposition for Stakeholders
- 1.2 Research Objectives
- 1.2.1 Market Sizing Objectives (Volume & Revenue)
- 1.2.2 Segmentation Objectives
- 1.2.3 Competitive Intelligence Objectives
- 1.2.4 Forecast & Scenario Objectives
- 1.3 Report Scope
- 1.3.1 Gas Fueled Peak Shaving Power Rental Scope – Types & Subtypes Covered
- 1.3.2 Geographic Scope – Regions & Countries Covered
- 1.3.3 Historical Period, Base Year & Forecast Period (2024; forecast to 2032)
- 1.3.4 Inclusions & Exclusions
- 1.4 HS Code & Classification Framework
- 1.5 Currency, Units & Pricing Basis
- 1.6 Target Stakeholders
- 1.7 Limitations & Assumptions
Chapter 2. Executive Summary
- 2.1 Global Gas Fueled Peak Shaving Power Rental Market Snapshot
- 2.1.1 Market Size – Historical (2024) & Forecast (2024-2032) (2024: USD 462.8 million → 2032: USD 648.14 million)
- 2.1.2 Volume & Revenue – Global Totals
- 2.1.3 Key Market Highlights – Top Five Facts
- 2.2 Gas Fueled Peak Shaving Power Rental Market Segmentation Snapshot
- 2.2.1 Market Split by Region – 2024 vs. 2032
- 2.3 Competitive Snapshot
- 2.3.1 Top 10 Players by Revenue Share – 2024
- 2.3.2 Top 10 Players by Volume Share – 2024
- 2.3.3 Recent Strategic Developments (18-Month Summary)
- 2.4 Key Investment Highlights & Strategic Conclusions
Chapter 3. Gas Fueled Peak Shaving Power Rental Market Dynamics & Industry Analysis
- 3.1 Market Overview & Context
- 3.1.1 Gas Fueled Peak Shaving Power Rental Market Position in the Broader Automotive Value Chain
- 3.1.2 OEM vs. Replacement Market Dynamics
- 3.1.3 Market Maturity & Development Stage by Region
- 3.2 Gas Fueled Peak Shaving Power Rental Market Drivers
- 3.3 Gas Fueled Peak Shaving Power Rental Market Restraints & Challenges
- 3.4 Gas Fueled Peak Shaving Power Rental Market Opportunities
- 3.5 Porter's Five Forces Analysis
- 3.5.1 Threat of New Entrants
- 3.5.2 Bargaining Power of Suppliers
- 3.5.3 Bargaining Power of Buyers
- 3.5.4 Threat of Substitutes
- 3.5.5 Competitive Rivalry – Intensity Assessment
- 3.6 Gas Fueled Peak Shaving Power Rental Value Chain Analysis
- 3.6.1 Upstream – Raw Material/Input Suppliers
- 3.6.1.1 Raw Material/Input 1
- 3.6.1.2 Raw Material/Input 2
- 3.6.1.3 Raw Material/Input 3
- 3.6.2 Midstream – Production/Manufacturing/Service Delivery
- 3.6.2.1 Production/Process Overview
- 3.6.2.2 Key Facility Locations & Capacity by Manufacturer
- 3.6.3 Downstream – Distribution & End Consumer
- 3.6.3.1 Primary Channel – B2B/OEM
- 3.6.3.2 Secondary Channels – Dealer, Retail, Online, Direct
- 3.6.4 Value Chain Profitability Analysis
- 3.6.1 Upstream – Raw Material/Input Suppliers
- 3.7 PESTEL Analysis
- 3.7.1 Political Factors
- 3.7.2 Economic Factors
- 3.7.3 Social Factors
- 3.7.4 Technological Factors
- 3.7.5 Environmental Factors
- 3.7.6 Legal Factors
- 3.8 Gas Fueled Peak Shaving Power Rental Supply Chain Analysis
- 3.8.1 Raw Material/Input Supply Risk Assessment
- 3.8.2 Manufacturing Concentration Risk (Geographic Exposure)
- 3.8.3 Trade Disruption Impact Analysis
- 3.9 Regulatory & Policy Landscape
Note: The regulatory and policy landscape section covers regulations based on their applicability to the market, Gas Fueled Peak Shaving Power Rental category, geography, and scope of the study. Only regulatory frameworks with a material impact on operations, compliance, trade, sustainability, or market access are analyzed in detail.
Chapter 4. Key Investment Pockets & Opportunity Analysis
- 4.1 Gas Fueled Peak Shaving Power Rental Market Attractiveness Analysis
- 4.1.1 By Region – Investment Attractiveness Matrix (Volume × CAGR)
- 4.2 Absolute Revenue Growth Opportunity
- 4.2.1 By Region – Absolute USD Growth Through 2032
- 4.3 Incremental Volume Opportunity
- 4.3.1 By Region – Incremental Volume Through 2032
- 4.3.2 Segment – Incremental Volume
- 4.4 Emerging Submarket Opportunity Deep Dive (Subject to Applicability)
- 4.5 Emerging Market Opportunity Scorecards
- 4.5.1 United States
- 4.5.2 Europe
- 4.5.3 Asia
- 4.5.4 Middle East & Africa
Note: Emerging Market Opportunity Scorecards will be included based on relevance and strategic importance. Regions listed are indicative and may vary depending on data availability and market dynamics.
Chapter 5. Gas Fueled Peak Shaving Power Rental Import-Export Analysis & Trade Flows
- 5.1 Global Trade Overview
- 5.1.1 Global Export Value by Country (2024)
- 5.1.2 Global Export Volume by Country (2024)
- 5.1.3 Global Import Value by Country (2024)
- 5.1.4 Global Import Volume by Country (2024)
- 5.1.5 Net Trade Balance by Country (2024)
- 5.2 Export Analysis – Segment
- 5.2.1 Type 1 (HS Code)
- 5.2.2 Type 2 (HS Code)
- 5.2.3 Type 3 (HS Code)
- 5.2.4 Type 4 (HS Code)
- 5.2.5 Type 5 (HS Code)
- 5.3 Import Analysis – Segment
- 5.3.1 Type 1 (HS Code)
- 5.3.2 Type 2 (HS Code)
- 5.3.3 Type 3 (HS Code)
- 5.3.4 Type 4 (HS Code)
- 5.3.5 Type 5 (HS Code)
- 5.4 Average Unit Trade Prices
- 5.4.1 Average Export Price – Segment & Country
- 5.4.2 Average Import Price – Segment & Source Country
- 5.4.3 Price Trends (2024)
- 5.5 Key Trade Route Analysis
- 5.5.1 Trade Route 1
- 5.5.2 Trade Route 2
- 5.5.3 Trade Route 3
- 5.5.4 Trade Route 4
- 5.5.5 Trade Route 5
- 5.6 Trade Policy Impact Assessment
- 5.6.1 US Anti-Dumping & Section 301 Tariffs
- 5.6.2 EU Customs Union Impact
- 5.6.3 Major Free Trade Agreements
- 5.6.4 USMCA Rules of Origin
Note: Trade policy analysis will be included only where relevant to the Gas Fueled Peak Shaving Power Rental market.
Chapter 6. Competitive Landscape & Company Benchmarking
- 6.1 Gas Fueled Peak Shaving Power Rental Market Concentration & Structure
- 6.1.1 Herfindahl-Hirschman Index (HHI) – vs. 2024
- 6.1.2 Tier 1, Tier 2 & Tier 3 Market Structure
- 6.1.3 Global, Regional & Local Player Dynamics
- 6.2 Gas Fueled Peak Shaving Power Rental Market Share Analysis – 2024
- 6.2.1 Global Revenue Share by Company
- 6.2.2 Global Volume Share by Company
- 6.2.3 Regional Revenue Share
- 6.2.4 Market Share Evolution ( vs. 2024)
- 6.2.5 OEM Segment Share by Company
- 6.2.6 Replacement Segment Share by Company
- 6.3 Production/Delivery Capacity & Facility Analysis
- 6.3.1 Global Installed Capacity
- 6.3.2 Capacity Utilization Rates
- 6.3.3 Production/Output Volume
- 6.3.4 Facility Locations & Capacity Map
- 6.3.5 Planned Capacity Additions
- 6.4 Gas Fueled Peak Shaving Power Rental Competitive Benchmarking Matrix
- 6.4.1 Revenue, Volume, CAGR & Profitability Comparison
- 6.4.2 Channel Revenue Mix
- 6.4.3 Geographic Revenue Exposure
- 6.4.4 R&D Intensity
- 6.4.5 Sustainability Maturity
- 6.5 Strategic Developments in Gas Fueled Peak Shaving Power Rental (Last 24 Months)
- 6.5.1 Mergers, Acquisitions & Divestments
- 6.5.2 New Gas Fueled Peak Shaving Power Rental Launches
- 6.5.3 Facility Expansions
- 6.5.4 Strategic Alliances, Joint Ventures & Partnerships
- 6.5.5 Distribution Expansion & Market Entry
- 6.5.6 Sustainability & ESG Initiatives
- 6.6 Competitive Strategy Mapping
- 6.6.1 Leader, Challenger, Follower & Niche Classification
- 6.6.2 Pricing Strategy Comparison
- 6.6.3 Channel Strategy Matrix
Note: Strategic developments are included based on their materiality and the availability of reliable information.
Chapter 7. Global Gas Fueled Peak Shaving Power Rental Market – By Distribution Channel
- 7.1 Segment Overview
- 7.1.1 Volume & Revenue Split by Channel (2024 & 2032)
- 7.1.2 Channel Mix Evolution (2024-2032)
Chapter 8. Regional Market Analysis – Global Overview
- 8.1 Global Regional Overview
- 8.1.1 Regional Volume Share
- 8.1.2 Regional Revenue Share
- 8.1.3 Regional Volume by Region
- 8.1.4 Regional Revenue by Region
- 8.1.5 Regional Forecast Through 2032
- 8.2 Cross-Regional Segment Analysis
- 8.2.1 By Distribution Channel
- 8.2.2 By Brand/Price Tier
Chapter 9. North America Gas Fueled Peak Shaving Power Rental Market
- 9.1 United States
- 9.2 Canada
- 9.3 Mexico
Chapter 10. Europe Gas Fueled Peak Shaving Power Rental Market
- 10.1 Germany
- 10.2 France
- 10.3 Italy
- 10.4 United Kingdom
- 10.5 Spain
- 10.6 Poland
- 10.7 Russia
- 10.8 Netherlands
- 10.9 Belgium
- 10.10 Sweden
- 10.11 Denmark
- 10.12 Norway
- 10.13 Rest of Europe
Chapter 11. Asia Pacific Gas Fueled Peak Shaving Power Rental Market
- 11.1 China
- 11.2 India
- 11.3 Japan
- 11.4 South Korea
- 11.5 Thailand
- 11.6 Indonesia
- 11.7 Vietnam
- 11.8 Malaysia
- 11.9 Australia
- 11.10 Rest of Asia Pacific
Chapter 12. Latin America Gas Fueled Peak Shaving Power Rental Market
- 12.1 Brazil
- 12.2 Argentina
- 12.3 Colombia
- 12.4 Chile
- 12.5 Rest of Latin America
Chapter 13. Middle East Gas Fueled Peak Shaving Power Rental Market
- 13.1 Saudi Arabia
- 13.2 United Arab Emirates
- 13.3 Turkey
- 13.4 Israel
- 13.5 Iran
- 13.6 Rest of the Middle East
Chapter 14. Africa Gas Fueled Peak Shaving Power Rental Market
- 14.1 South Africa
- 14.2 Egypt
- 14.3 Nigeria
- 14.4 Morocco
- 14.5 Rest of Africa
Chapter 15. Gas Fueled Peak Shaving Power Rental Company Profiles
- 15.1 [Company 01]
- 15.1.1 Company Overview
- 15.1.2 Key Management Personnel
- 15.1.3 Products & Services Portfolio
- 15.1.4 Financial Performance
- 15.1.5 Key Market Focus & Geographic Presence
- 15.1.6 Recent Developments & Strategic Initiatives
Note: The company profile list is preliminary and may change based on research findings, market developments, data availability, and client requirements.
Chapter 16. Appendices
- Appendix A – List of Abbreviations & Acronyms
- Appendix B – Industry Classification Code Reference – Full Series
- Appendix C – Production & Capacity Data Tables
- Appendix D – End-Use & Demand Base Tables
- Appendix E – Consumption & Replacement Rate Assumptions
- Appendix F – ASP Reference Tables
- Appendix G – Manufacturing & Facility Database
- Appendix H – Import-Export Data Tables
- Appendix I – Regulatory Summary Tables
- Appendix J – Primary Research Participant List (Anonymized)
- Appendix K – Primary Research Questionnaire Framework
- Appendix L – Data Sources & Bibliography
- Appendix M – Market Size Divergence & Source Comparison
Chapter 17. Research Methodology
- 17.1 Research Framework & Philosophy
- 17.2 Secondary Research – Sources, Hierarchy & Data Extraction
- 17.3 Data Modeling – Bottom-Up & Top-Down Market Sizing
- 17.4 Primary Research – Stakeholder Framework, LOI & Sample Sizes
- 17.5 Forecast Methodology – Regression, Scenario & Sensitivity Analysis
- 17.6 Quality Control – Four-Layer Validation Framework
- 17.7 Limitations & Standard Assumptions
- 17.8 Disclaimer
