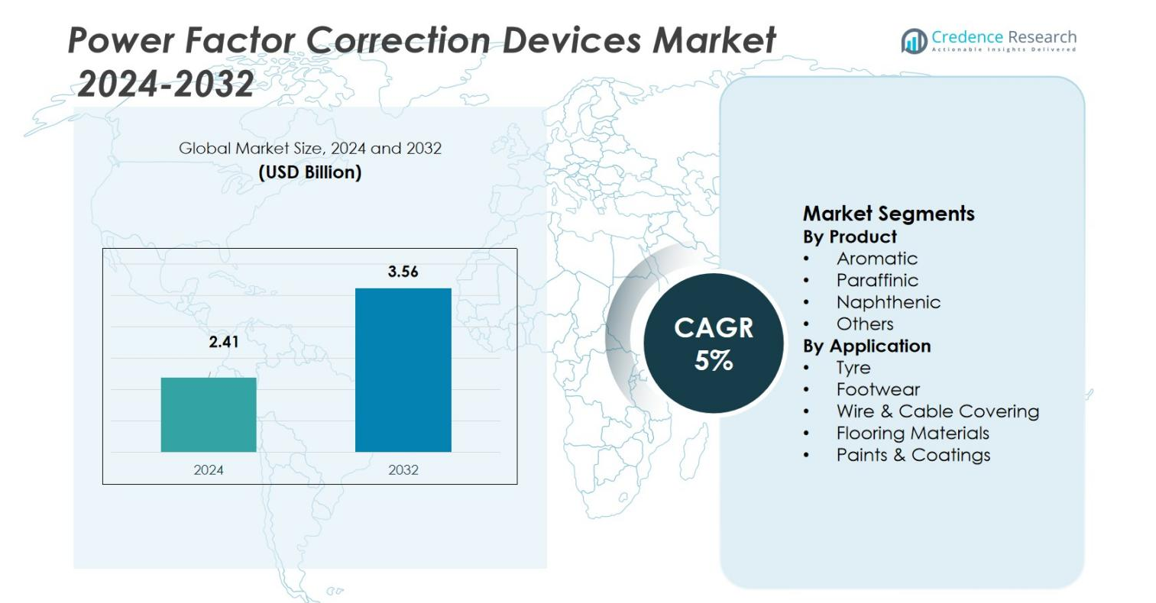
Home » Semiconductor & Electronics » Power Factor Correction Devices Market

Power Factor Correction Devices Market By Type (Distributed Power Factor Correction Devices, Centralized Power Factor Correction Devices, Combined Power Factor Correction Devices and Others) By Application (Application I, Application II and Application III) Growth, Future Prospects & Competitive Analysis, 2016 – 2030

Price: $4999

Published: | Report ID: 15773 | Report Format : PDF

Key Highlights of the report

How are the major segments performing in the power factor correction devices market?

  • In 2022, the combined power factor correction devices category accounted for the largest share of the market, driven by several causes, including expanding energy-efficient system demand, energy-saving policies being put into place and rising acceptance of renewable energy sources.
  • In 2022, the application II category held the largest share. Power factor correction devices are used in Application II to improve the effectiveness of power grids. And solar photovoltaic systems utilize these gadgets.

What is the market size of power factor correction devices regarding value?

The global power factor correction devices market is anticipated to grow at a substantial CAGR of 8.10% in the upcoming years. The global Power factor correction devices industry was estimated to be worth USD 6.9 billion in 2022 and was expected to be worth USD 11.9 billion by 2028.

Design Element 2

Access crucial information at unmatched prices!

Request your free sample report today & start making informed decisions powered by Credence Research!

Download Free Sample
CTA Design Element 3

Which region dominated the power factor correction devices market?

In 2022, the North American region was anticipated to hold a prominent share in the global power factor correction devices market due to sizable applications sectors like the industrial sector and the automotive business, which are predicted to grow quickly. The market consists of Mexico, Canada, and the United States. The rising demand for energy-efficient products in the area is one of the main factors driving the market. Power factor correction devices have become more popular across a range of industries, including the manufacturing, commercial, and residential sectors, due to the increased focus on energy efficiency and sustainability. The region’s rising demand for renewable energy sources is another important market factor. The requirement for power factor correction devices to enhance the power factor of these systems is expanding along with the need for renewable energy sources like wind and solar electricity.

Power Factor Correction Devices Market

How US market is performing in the power factor correction devices market?

In 2022, the United States was anticipated to hold a prominent share of the North American region’s global power factor correction devices market. Several variables, such as the rising demand for energy-efficient solutions, governmental requirements, and the requirement for consistent power quality, influence the market. With a sizable demand from numerous end-use industries, such as data centers, manufacturing, and commercial buildings, the United States is the largest market in North America for power factor correction devices. The industry is expanding due to government rules addressing energy efficiency and an increase in the usage of renewable energy sources.

How is the economy impacting the global power factor correction devices growth?

The state of the world economy significantly influences the development of the market for power factor correction devices. Because of their widespread use in various industries and applications susceptible to changes in economic conditions, PFC devices are in high demand in different areas and nations. PFC device demand may decline during recessions as businesses cut back on capital expenditures and prioritize cost-cutting initiatives. Reduced energy demand due to the recession may also affect the demand for PFC devices. Furthermore, the pandemic has caused a halt in economic activity in several different locations, which has affected the demand for PFC devices. Delivery and production delays are the result of the pandemic’s disruption of the PFC device supply chain. The closing of manufacturing facilities, travel restrictions, and labor shortages have caused a supply chain disruption.

What is the competitive environment of the power factor correction devices market?

Numerous players are active in the fiercely competitive Power Factor Correction Devices market. The market’s participants are concentrating on product innovation, strategic alliances, and mergers and acquisitions to obtain a competitive edge. The market is also seeing the introduction of new competitors, escalating the competition level. To establish a presence in the industry, the new providers are concentrating on providing PFC solutions that are both technologically sophisticated and reasonably priced. Market participants are concentrating on extending their geographic reach through strategic acquisitions, alliances, and product innovation and partnerships. For instance, in 2020, Schneider Electric purchased the Spanish company Telvent DMS, which specializes in creating distribution management systems, to increase the scope of its smart grid products.

Executive Summary

What are the key trends in the power factor correction devices market?

  • Rising demand for PFC devices from various industries: Due to the increased demand for energy efficiency and the implementation of energy-saving legislation, the demand for power factor correction (PFC) devices is rising across various industries. PFC devices are used to increase the power factor of electrical systems, which can lower energy costs, system efficiency, and carbon emissions. The automotive sector is one of the main users of PFC devices. Electric cars (EVs) and hybrid electric vehicles use PFC devices to increase the efficiency of their electrical systems (HEVs). These gadgets aid in reducing energy losses throughout the powertrain, improving battery life and efficiency. Another significant user of PFC devices is the manufacturing sector. These tools are used to increase the energy efficiency of industrial motors and decrease energy usage. In addition, the telecommunications industry uses PFC devices to increase energy efficiency. These gadgets are used to increase the power factor of telecom equipment, which aids in lowering expenses and energy usage.

How has the market for power factor correction devices been influenced by the increasing use of renewable energy sources?

The demand for power factor correction (PFC) devices is driven by the growing use of renewable energy sources like wind and solar. Because they are more advantageous for the environment and renewable energy technologies are becoming more affordable, renewable energy sources are growing in popularity. Renewable energy sources are intermittent, so their output might change based on the weather and other circumstances. The electrical grid may have problems due to this variability, including voltage changes and poor power quality. By enhancing the power factor of renewable energy systems, PFC devices can aid in mitigating these problems. Furthermore, PFC devices can aid in boosting the effectiveness of renewable energy sources. When an electrical system’s power factor is raised, less current is needed to supply the same amount of power, which lowers energy losses and boosts efficiency. This improved efficiency may contribute to the cost-effectiveness and competitiveness of renewable energy systems compared to conventional fossil fuel-based power generation.

Which are the key investments by the power factor correction devices market players?

The primary investments made by PFC device market participants are concentrated on creating more sophisticated and effective PFC devices, entering new markets, and distinguishing their products to remain competitive. These expenditures are expected to continue to fuel innovation and growth in the PFC device market as the need for energy-efficient systems rises. In order to create PFC devices that are more sophisticated and effective, PFC device manufacturers are also investing in research and development. New materials, designs, and technologies are being developed to increase the functionality and dependability of PFC devices.

Some major power factor correction devices market players are Siemens AG, ABB, Toshiba Corporation, Schneider Electric, Mitsubishi Electric Corporation and LARSEN& TOUBRO LIMITED.

What are the major driving factors for the power factor correction devices market?

The market for PFC devices is primarily driven by the growing emphasis on energy efficiency and the need to lower energy prices and usage. Electrical systems’ power factors can be improved with PFC devices, which can lower energy losses and boost efficiency. The deployment of PFC devices in many industries is also fueled by the implementation of energy-saving legislation and the increased need for sustainable energy sources. Additionally, using PFC devices is driven by the rising need for renewable energy sources like wind and solar energy, increasing the efficiency and stability of renewable energy systems. Overall, the PFC device market is driven primarily by the demand for energy efficiency, the implementation of energy-saving legislation, and the increased acceptance of renewable energy sources.

What are the major risks for the power factor correction devices market?

The high initial cost of these devices, which may dissuade some organizations and customers from investing in them, is one of the main obstacles for the PFC devices industry. Another barrier is the low level of awareness and comprehension of PFC technology since many companies and consumers might not be aware of the advantages or mechanism of action of PFC devices. Additionally, the complexity of PFC devices and the shortage of experienced personnel to install and maintain them could impede market expansion.

Which is the key type category in the power factor correction devices market?

The combined power factor correction devices category held the largest share of the market, driven by several factors, including growing demand for energy-efficient systems, the implementation of energy-saving regulations, and the acceptance of renewable energy sources. The primary purpose of combined power factor correction devices is to reduce the phase angle discrepancy between current and voltage. Depending on the type of electrical system, it aids in either raising or lowering harmonics. By limiting rapid surge currents that enter appliances and can cause up to some degree of damage, combined power factor correction devices are crucial for protecting them from overload conditions.

How is the power factor correction devices market performing in regions?

Europe market is anticipated to witness the fastest growth in the global power factor correction devices market during the forecast period. The adoption of energy-efficient technology in more and more sectors of the economy, along with the implementation of legislation requiring energy conservation, are both responsible for the growth. The region’s need for PFC devices is also driven by the rising demand for electricity and the need to cut back on energy use. Europe’s biggest PFC device markets are Germany and the UK, followed by France, Italy, and Spain. The markets for PFC devices in these nations are anticipated to increase significantly during the coming years. The market for PFC devices is anticipated to increase as renewable energy sources are increasingly adopted in Europe.

What is the regulatory landscape for the power factor correction devices market?

In the upcoming years, the regulatory environment for the market for PFC devices is anticipated to tighten due to the rising demand for energy efficiency and the requirement to lower greenhouse gas emissions. As a result, PFC devices are anticipated to become more widely used across a range of businesses and geographical areas. The two main laws impacting the market for PFC devices in Europe are the Energy Efficiency Directive (EED) and the Eco-design Directive. The EED compels member states to implement energy-saving measures, including the usage of PFC devices and sets a goal of increasing energy efficiency by 20% by 2020. Moreover, several international standards bodies have created specifications for PFC devices, including the International Electrotechnical Commission (IEC) and the Institute of Electrical and Electronics Engineers (IEEE).

Shape Your Report to Specific Countries or Regions & Enjoy 30% Off!

What are the major players planning for the future of the power factor correction devices market?

The key players in the PFC devices market are concentrating on strategies like product innovation, portfolio growth, partnerships, and collaborations to stay competitive. These players are spending money on R&D to create PFC devices that are more effective, dependable, and performant. Expanding their position in developing regions like Asia-Pacific, where the demand for PFC devices is anticipated to increase more quickly, is another area in which certain firms are concentrating their efforts. By offering new PFC devices that address the distinct requirements of various industries, businesses are also aiming to diversify their product line. For companies in the PFC devices market, partnerships and collaborations are likewise becoming increasingly crucial.

REPORT ATTRIBUTE DETAILS
Power Factor Correction Devices Market, Tornado Analysis Yes
Power Factor Correction Devices Market, STAR Analysis Yes
Power Factor Correction Devices Market, SRC Analysis Yes
Power Factor Correction Devices Market, Import-Export Data Yes (On Demand)
Power Factor Correction Devices Market Pricing Analysis Yes (On Demand)
Power Factor Correction Devices Market Segment Analysis By Type (Distributed Power Factor Correction Devices, Centralized Power Factor Correction Devices, Combined Power Factor Correction Devices and Others)

By Application (Application I, Application II and Application III)

Power Factor Correction Devices Market, Regional Analysis North America (US and Canada)

Europe (Germany, UK, France, Italy, Spain, and Rest of Europe)

Asia Pacific (China, India, Japan, South Korea, South East Asia, and Rest of Asia Pacific)

Latin America (Brazil, Mexico, and Rest of Latin America)

Middle East and Africa (GCC Countries, South Africa, and Rest of Middle East and Africa)

Power Factor Correction Devices Market Key Companies Siemens AG, ABB, Toshiba Corporation, Schneider Electric, Mitsubishi Electric Corporation and LARSEN& TOUBRO LIMITED.
Power Factor Correction Devices Market Competitive Landscape Market Share Analysis

Competitive Benchmarking

Key Players Market Positioning

Geographical Presence Analysis

Major Strategies Adopted

Segmentation of Global Power Factor Correction Devices Market-

Global Power Factor Correction Devices Market – By Type

  • Distributed Power Factor Correction Devices
  • Centralized Power Factor Correction Devices
  • Combined Power Factor Correction Devices
  • Others

Global Power Factor Correction Devices Market – By Application

  • Application I
  • Application II
  • Application III

Global Power Factor Correction Devices Market – By Region

  • North America
    • U.S.
    • Canada
  • Europe
    • Germany
    • France
    • U.K.
    • Italy
    • Spain
    • Rest of Europe
  • Asia Pacific
    • China
    • Japan
    • India
    • South Korea
    • South-east Asia
    • Rest of Asia Pacific
  • Latin America
    • Brazil
    • Mexico
    • Rest of Latin America
  • Middle East & Africa
    • GCC Countries
    • South Africa
    • Rest of Middle East and Africa

1. Preface
1.1. Report Description
1.1.1. Purpose of the Report
1.1.2. Target Audience
1.1.3. USP and Key Offerings
1.2. Research Scope
1.3. Research Methodology
1.3.1. Phase I – Secondary Research
1.3.2. Phase II – Primary Research
1.3.3. Phase III – Expert Panel Review
1.3.4. Approach Adopted
1.3.4.1. Top-Down Approach
1.3.4.2. Bottom-Up Approach
1.3.5. Assumptions
1.4. Market Introduction
1.5. Market Research Scope

2. Executive Summary
2.1. Market Snapshot: Global Power Factor Correction Devices Market
2.2. Global Power Factor Correction Devices Market, By Type
2.3. Global Power Factor Correction Devices Market, By Application
2.4. Global Power Factor Correction Devices Market, By Region

3. Market Dynamics & Factors Analysis
3.1. Introduction
3.1.1. Global Power Factor Correction Devices Market Value, 2017-2030, (US$ Bn)
3.1.2. Y-o-Y Growth Trend Analysis
3.2. Market Dynamics
3.2.1. Market Drivers
3.2.2. Market Restraints
3.2.3. Market Opportunities
3.2.4. Major Industry Challenges
3.3. Growth and Development Patterns
3.4. Investment Feasibility Analysis
3.5. Market Opportunity Analysis
3.5.1. Type
3.5.2. Application
3.5.3. Geography

4. Premium Insights
4.1. STAR (Situation, Task, Action, Results) Analysis
4.2. Porter’s Five Forces Analysis
4.2.1. Threat of New Entrants
4.2.2. Bargaining Power of Buyers/Consumers
4.2.3. Bargaining Power of Suppliers
4.2.4. Threat of Substitute Types
4.2.5. Intensity of Competitive Rivalry
4.3. Key Market Trends
4.3.1. Demand Side Trends
4.3.2. Supply Side Trends
4.4. Value Chain Analysis
4.5. Technology Analysis
4.6. Analysis and Recommendations
4.7. Marketing Strategy Analysis
4.7.1. Direct Marketing
4.7.2. Indirect Marketing
4.7.3. Marketing Channel Development Trend

5. Market Positioning of Key Players, 2022
5.1. Company Market Share of Key Players, 2022
5.2. Competitive Benchmarking
5.3. Market Positioning of Key Vendors
5.4. Geographical Presence Analysis
5.5. Major Strategies Adopted by Key Players
5.5.1. Key Strategies Analysis
5.5.2. Mergers and Acquisitions
5.5.3. Partnerships
5.5.4. Product Launch
5.5.5. Geographical Expansion
5.5.6. Others

6. Economic Impact Analysis
6.1. Recession Impact
6.1.1. North America
6.1.2. Europe
6.1.3. Asia Pacific
6.1.4. Latin America
6.1.5. Middle East and Africa
6.2. Ukraine-Russia War Impact
6.2.1. North America
6.2.2. Europe
6.2.3. Asia Pacific
6.2.4. Latin America
6.2.5. Middle East and Africa
6.3. COVID-19 Impact Analysis
6.3.1. North America
6.3.2. Europe
6.3.3. Asia Pacific
6.3.4. Latin America
6.3.5. Middle East and Africa

7. Global Power Factor Correction Devices Market
7.1. Global Power Factor Correction Devices Market, by Type, 2017-2030(US$ Bn)
7.1.1. Overview
7.1.2. Global Power Factor Correction Devices Market, By Type, 2022 vs 2030 (in%)
7.1.3. Global Power Factor Correction Devices Market, By Distributed Power Factor Correction Devices, 2017-2030 (US$ Bn)
7.1.4. Global Power Factor Correction Devices Market, By Centralized Power Factor Correction Devices, 2017-2030 (US$ Bn)
7.1.5. Global Power Factor Correction Devices Market, By Combined Power Factor Correction Devices, 2017-2030 (US$ Bn)
7.1.6. Global Power Factor Correction Devices Market, By Others, 2017-2030 (US$ Bn)
7.2. Global Power Factor Correction Devices Market, by Application, 2017-2030(US$ Bn)
7.2.1. Overview
7.2.2. Global Power Factor Correction Devices Market, By Application, 2022 vs 2030 (in%)
7.2.3. Global Power Factor Correction Devices Market, By Application I, 2017-2030 (US$ Bn)
7.2.4. Global Power Factor Correction Devices Market, By Application Il, 2017-2030 (US$ Bn)
7.2.5. Global Power Factor Correction Devices Market, By Application Ill, 2017-2030 (US$ Bn)

8. North America Power Factor Correction Devices Market Analysis
8.1. North America Power Factor Correction Devices Market, by Type, 2017-2030(US$ Bn)
8.1.1. Overview
8.1.2. SRC Analysis
8.2. North America Power Factor Correction Devices Market, by Application, 2017-2030(US$ Bn)
8.2.1. Overview
8.2.2. SRC Analysis
8.3. North America Power Factor Correction Devices Market, by Country, 2017-2030 (US$ Bn)
8.3.1. U.S.
8.3.1.1. U.S. Power Factor Correction Devices Market Estimates and Forecast, 2017-2030 (US$ Bn)
8.3.1.2. U.S. Power Factor Correction Devices, By Type, 2017-2030 (US$ Bn)
8.3.1.3. U.S. Power Factor Correction Devices, By Application, 2017-2030 (US$ Bn)
8.3.2. Canada
8.3.2.1. Canada Power Factor Correction Devices Market Estimates and Forecast, 2017-2030 (US$ Bn)
8.3.2.2. Canada Power Factor Correction Devices, By Type, 2017-2030 (US$ Bn)
8.3.2.3. Canada Power Factor Correction Devices, By Application, 2017-2030 (US$ Bn)

9. Europe Power Factor Correction Devices Market Analysis
9.1. Europe Power Factor Correction Devices Market, by Type, 2017-2030(US$ Bn)
9.1.1. Overview
9.1.2. SRC Analysis
9.2. Europe Power Factor Correction Devices Market, by Application, 2017-2030(US$ Bn)
9.2.1. Overview
9.2.2. SRC Analysis
9.3. Europe Power Factor Correction Devices Market, by Country, 2017-2030 (US$ Bn)
9.3.1. Germany
9.3.1.1. Germany Power Factor Correction Devices Market Estimates and Forecast, 2017-2030 (US$ Bn)
9.3.1.2. Germany Power Factor Correction Devices, By Type, 2017-2030 (US$ Bn)
9.3.1.3. Germany Power Factor Correction Devices, By Application, 2017-2030 (US$ Bn)
9.3.2. France
9.3.2.1. France Power Factor Correction Devices Market Estimates and Forecast, 2017-2030 (US$ Bn)
9.3.2.2. France Power Factor Correction Devices, By Type, 2017-2030 (US$ Bn)
9.3.2.3. France Power Factor Correction Devices, By Application, 2017-2030 (US$ Bn)
9.3.3. UK
9.3.3.1. UK Power Factor Correction Devices Market Estimates and Forecast, 2017-2030 (US$ Bn)
9.3.3.2. UK Power Factor Correction Devices, By Type, 2017-2030 (US$ Bn)
9.3.3.3. UK Power Factor Correction Devices, By Application, 2017-2030 (US$ Bn)
9.3.4. Italy
9.3.4.1. Italy Power Factor Correction Devices Market Estimates and Forecast, 2017-2030 (US$ Bn)
9.3.4.2. Italy Power Factor Correction Devices, By Type, 2017-2030 (US$ Bn)
9.3.4.3. Italy Power Factor Correction Devices, By Application, 2017-2030 (US$ Bn)
9.3.5. Spain
9.3.5.1. Spain Power Factor Correction Devices Market Estimates and Forecast, 2017-2030 (US$ Bn)
9.3.5.2. Spain Power Factor Correction Devices, By Type, 2017-2030 (US$ Bn)
9.3.5.3. Spain Power Factor Correction Devices, By Application, 2017-2030 (US$ Bn)
9.3.6. Rest of Europe
9.3.6.1. Rest of Europe Power Factor Correction Devices Market Estimates and Forecast, 2017-2030 (US$ Bn)
9.3.6.2. Rest of Europe Power Factor Correction Devices, By Type, 2017-2030 (US$ Bn)
9.3.6.3. Rest of Europe Power Factor Correction Devices, By Application, 2017-2030 (US$ Bn)

10. Asia Pacific Power Factor Correction Devices Market Analysis
10.1. Asia Pacific Power Factor Correction Devices Market, by Type, 2017-2030(US$ Bn)
10.1.1. Overview
10.1.2. SRC Analysis
10.2. Asia Pacific Power Factor Correction Devices Market, by Application, 2017-2030(US$ Bn)
10.2.1. Overview
10.2.2. SRC Analysis
10.3. Asia Pacific Power Factor Correction Devices Market, by Country, 2017-2030 (US$ Bn)
10.3.1. China
10.3.1.1. China Power Factor Correction Devices Market Estimates and Forecast, 2017-2030 (US$ Bn)
10.3.1.2. China Power Factor Correction Devices, By Type, 2017-2030 (US$ Bn)
10.3.1.3. China Power Factor Correction Devices, By Application, 2017-2030 (US$ Bn)
10.3.2. Japan
10.3.2.1. Japan Power Factor Correction Devices Market Estimates and Forecast, 2017-2030 (US$ Bn)
10.3.2.2. Japan Power Factor Correction Devices, By Type, 2017-2030 (US$ Bn)
10.3.2.3. Japan Power Factor Correction Devices, By Application, 2017-2030 (US$ Bn)
10.3.3. India
10.3.3.1. India Power Factor Correction Devices Market Estimates and Forecast, 2017-2030 (US$ Bn)
10.3.3.2. India Power Factor Correction Devices, By Type, 2017-2030 (US$ Bn)
10.3.3.3. India Power Factor Correction Devices, By Application, 2017-2030 (US$ Bn)
10.3.4. South Korea
10.3.4.1. South Korea Power Factor Correction Devices Market Estimates and Forecast, 2017-2030 (US$ Bn)
10.3.4.2. South Korea Power Factor Correction Devices, By Type, 2017-2030 (US$ Bn)
10.3.4.3. South Korea Power Factor Correction Devices, By Application, 2017-2030 (US$ Bn)
10.3.5. South-East Asia
10.3.5.1. South-East Asia Power Factor Correction Devices Market Estimates and Forecast, 2017-2030 (US$ Bn)
10.3.5.2. South-East Asia Power Factor Correction Devices, By Type, 2017-2030 (US$ Bn)
10.3.5.3. South-East Asia Power Factor Correction Devices, By Application, 2017-2030 (US$ Bn)
10.3.6. Rest of Asia Pacific
10.3.6.1. Rest of Asia Pacific Power Factor Correction Devices Market Estimates and Forecast, 2017-2030 (US$ Bn)
10.3.6.2. Rest of Asia Pacific Power Factor Correction Devices, By Type, 2017-2030 (US$ Bn)
10.3.6.3. Rest of Asia Pacific Power Factor Correction Devices, By Application, 2017-2030 (US$ Bn)

11. Latin America Power Factor Correction Devices Market Analysis
11.1. Latin America Power Factor Correction Devices Market, by Type, 2017-2030(US$ Bn)
11.1.1. Overview
11.1.2. SRC Analysis
11.2. Latin America Power Factor Correction Devices Market, by Application, 2017-2030(US$ Bn)
11.2.1. Overview
11.2.2. SRC Analysis
11.3. Latin America Power Factor Correction Devices Market, by Country, 2017-2030 (US$ Bn)
11.3.1. Brazil
11.3.1.1. Brazil Power Factor Correction Devices Market Estimates and Forecast, 2017-2030 (US$ Bn)
11.3.1.2. Brazil Power Factor Correction Devices, By Type, 2017-2030 (US$ Bn)
11.3.1.3. Brazil Power Factor Correction Devices, By Application, 2017-2030 (US$ Bn)
11.3.2. Mexico
11.3.2.1. Mexico Power Factor Correction Devices Market Estimates and Forecast, 2017-2030 (US$ Bn)
11.3.2.2. Mexico Power Factor Correction Devices, By Type, 2017-2030 (US$ Bn)
11.3.2.3. Mexico Power Factor Correction Devices, By Application, 2017-2030 (US$ Bn)
11.3.3. Rest of Latin America
11.3.3.1. Rest of Latin America Power Factor Correction Devices Market Estimates and Forecast, 2017-2030 (US$ Bn)
11.3.3.2. Rest of Latin America Power Factor Correction Devices, By Type, 2017-2030 (US$ Bn)
11.3.3.3. Rest of Latin America Power Factor Correction Devices, By Application, 2017-2030 (US$ Bn)

12. Middle East and Africa Power Factor Correction Devices Market Analysis
12.1. Middle East and Africa Power Factor Correction Devices Market, by Type, 2017-2030(US$ Bn)
12.1.1. Overview
12.1.2. SRC Analysis
12.2. Middle East and Africa Power Factor Correction Devices Market, by Application, 2017-2030(US$ Bn)
12.2.1. Overview
12.2.2. SRC Analysis
12.3. Middle East and Africa Power Factor Correction Devices Market, by Country, 2017-2030 (US$ Bn)
12.3.1. GCC Countries
12.3.1.1. GCC Countries Power Factor Correction Devices Market Estimates and Forecast, 2017-2030 (US$ Bn)
12.3.1.2. GCC Countries Power Factor Correction Devices, By Type, 2017-2030 (US$ Bn)
12.3.1.3. GCC Countries Power Factor Correction Devices, By Application, 2017-2030 (US$ Bn)
12.3.2. South Africa
12.3.2.1. South Africa Power Factor Correction Devices Market Estimates and Forecast, 2017-2030 (US$ Bn)
12.3.2.2. South Africa Power Factor Correction Devices, By Type, 2017-2030 (US$ Bn)
12.3.2.3. South Africa Power Factor Correction Devices, By Application, 2017-2030 (US$ Bn)
12.3.3. Rest of Middle East and Africa
12.3.3.1. Rest of Middle East and Africa Power Factor Correction Devices Market Estimates and Forecast, 2017-2030 (US$ Bn)
12.3.3.2. Rest of Middle East and Africa Power Factor Correction Devices, By Type, 2017-2030 (US$ Bn)
12.3.3.3. Rest of Middle East and Africa Power Factor Correction Devices, By Application, 2017-2030 (US$ Bn)

13. Company Profiles
13.1. Siemens AG
13.1.1. Company Overview
13.1.2. Products/Services Portfolio
13.1.3. Geographical Presence
13.1.4. Financial Summary
13.1.4.1. Market Revenue and Net Profit (2019-2022)
13.1.4.2. Business Segment Revenue Analysis
13.1.4.3. Geographical Revenue Analysis
13.2. ABB
13.3. Toshiba Corporation
13.4. Schneider Electric
13.5. Mitsubishi Electric Corporation
13.6. LARSEN& TOUBRO LIMITED

List of Figures

FIG. 1 Global Power Factor Correction Devices Market: Research Methodology
FIG. 2 Market Size Estimation – Top Down & Bottom up Approach
FIG. 3 Global Power Factor Correction Devices Market Segmentation
FIG. 4 Global Power Factor Correction Devices Market, by Type, 2022 (US$ Bn)
FIG. 5 Global Power Factor Correction Devices Market, by Application, 2022 (US$ Bn)
FIG. 6 Global Power Factor Correction Devices Market, by Geography, 2022 (US$ Bn)
FIG. 7 Attractive Investment Proposition, by Type, 2022
FIG. 8 Attractive Investment Proposition, by Application, 2022
FIG. 9 Attractive Investment Proposition, by Geography, 2022
FIG. 10 Global Market Share Analysis of Key Power Factor Correction Devices Market Manufacturers, 2022
FIG. 11 Global Market Positioning of Key Power Factor Correction Devices Market Manufacturers, 2022
FIG. 12 Global Power Factor Correction Devices Market Value Contribution, By Type, 2022 & 2030 (Value %)
FIG. 13 Global Power Factor Correction Devices Market, by Distributed Power Factor Correction Devices, Value, 2017-2030 (US$ Bn)
FIG. 14 Global Power Factor Correction Devices Market, by Centralized Power Factor Correction Devices, Value, 2017-2030 (US$ Bn)
FIG. 15 Global Power Factor Correction Devices Market, by Combined Power Factor Correction Devices, Value, 2017-2030 (US$ Bn)
FIG. 16 Global Power Factor Correction Devices Market, by Others, Value, 2017-2030 (US$ Bn)
FIG. 17 Global Power Factor Correction Devices Market Value Contribution, By Application, 2022 & 2030 (Value %)
FIG. 18 Global Power Factor Correction Devices Market, by Application I, Value, 2017-2030 (US$ Bn)
FIG. 19 Global Power Factor Correction Devices Market, by Application Il, Value, 2017-2030 (US$ Bn)
FIG. 20 Global Power Factor Correction Devices Market, by Application Ill, Value, 2017-2030 (US$ Bn)
FIG. 21 North America Power Factor Correction Devices Market, 2017-2030 (US$ Bn)
FIG. 22 U.S. Power Factor Correction Devices Market, 2017-2030 (US$ Bn)
FIG. 23 Canada Power Factor Correction Devices Market, 2017-2030 (US$ Bn)
FIG. 24 Europe Power Factor Correction Devices Market, 2017-2030 (US$ Bn)
FIG. 25 Germany Power Factor Correction Devices Market, 2017-2030 (US$ Bn)
FIG. 26 France Power Factor Correction Devices Market, 2017-2030 (US$ Bn)
FIG. 27 U.K. Power Factor Correction Devices Market, 2017-2030 (US$ Bn)
FIG. 28 Italy Power Factor Correction Devices Market, 2017-2030 (US$ Bn)
FIG. 29 Spain Power Factor Correction Devices Market, 2017-2030 (US$ Bn)
FIG. 30 Rest of Europe Power Factor Correction Devices Market, 2017-2030 (US$ Bn)
FIG. 31 Asia Pacific Power Factor Correction Devices Market, 2017-2030 (US$ Bn)
FIG. 32 China Power Factor Correction Devices Market, 2017-2030 (US$ Bn)
FIG. 33 Japan Power Factor Correction Devices Market, 2017-2030 (US$ Bn)
FIG. 34 India Power Factor Correction Devices Market, 2017-2030 (US$ Bn)
FIG. 35 South Korea Power Factor Correction Devices Market, 2017-2030 (US$ Bn)
FIG. 36 Southeast Asia Power Factor Correction Devices Market, 2017-2030 (US$ Bn)
FIG. 37 Rest of Asia Pacific Power Factor Correction Devices Market, 2017-2030 (US$ Bn)
FIG. 38 Latin America Power Factor Correction Devices Market, 2017-2030 (US$ Bn)
FIG. 39 Brazil Power Factor Correction Devices Market, 2017-2030 (US$ Bn)
FIG. 40 Mexico Power Factor Correction Devices Market, 2017-2030 (US$ Bn)
FIG. 41 Rest of Latin America Power Factor Correction Devices Market, 2017-2030 (US$ Bn)
FIG. 42 Middle East & Africa Power Factor Correction Devices Market, 2017-2030 (US$ Bn)
FIG. 43 GCC Countries Power Factor Correction Devices Market, 2017-2030 (US$ Bn)
FIG. 44 South Africa Power Factor Correction Devices Market, 2017-2030 (US$ Bn)
FIG. 45 Rest of Middle East and Africa Power Factor Correction Devices Market, 2017-2030 (US$ Bn)

List of Tables

TABLE 1 Market Snapshot: Global Power Factor Correction Devices Market
TABLE 2 Global Power Factor Correction Devices Market, by Competitive Benchmarking, 2022
TABLE 3 Global Power Factor Correction Devices Market, by Geographical Presence Analysis, 2022
TABLE 4 Global Power Factor Correction Devices Market, by Key Strategies Analysis, 2022
TABLE 5 Global Power Factor Correction Devices Market, by Type, 2017-2030 (US$ Bn)
TABLE 6 Global Power Factor Correction Devices Market, by Application, 2017-2030 (US$ Bn)
TABLE 7 Global Power Factor Correction Devices Market, by Geography, 2017-2030 (US$ Bn)
TABLE 8 North America Power Factor Correction Devices Market, by Type, 2017-2030 (US$ Bn)
TABLE 9 North America Power Factor Correction Devices Market, by Application, 2017-2030 (US$ Bn)
TABLE 10 North America Power Factor Correction Devices Market, by Country, 2017-2030 (US$ Bn)
TABLE 11 US Power Factor Correction Devices Market, by Type, 2017-2030 (US$ Bn)
TABLE 12 US Power Factor Correction Devices Market, by Application, 2017-2030 (US$ Bn)
TABLE 13 Canada Power Factor Correction Devices Market, by Type, 2017-2030 (US$ Bn)
TABLE 14 Canada Power Factor Correction Devices Market, by Application, 2017-2030 (US$ Bn)
TABLE 15 Europe Power Factor Correction Devices Market, by Type, 2017-2030 (US$ Bn)
TABLE 16 Europe Power Factor Correction Devices Market, by Application, 2017-2030 (US$ Bn)
TABLE 17 Europe Power Factor Correction Devices Market, by Country, 2017-2030 (US$ Bn)
TABLE 18 Germany Power Factor Correction Devices Market, by Type, 2017-2030 (US$ Bn)
TABLE 19 Germany Power Factor Correction Devices Market, by Application, 2017-2030 (US$ Bn)
TABLE 20 France Power Factor Correction Devices Market, by Type, 2017-2030 (US$ Bn)
TABLE 21 France Power Factor Correction Devices Market, by Application, 2017-2030 (US$ Bn)
TABLE 22 UK Power Factor Correction Devices Market, by Type, 2017-2030 (US$ Bn)
TABLE 23 UK Power Factor Correction Devices Market, by Application, 2017-2030 (US$ Bn)
TABLE 24 Italy Power Factor Correction Devices Market, by Type, 2017-2030 (US$ Bn)
TABLE 25 Italy Power Factor Correction Devices Market, by Application, 2017-2030 (US$ Bn)
TABLE 26 Spain Power Factor Correction Devices Market, by Type, 2017-2030 (US$ Bn)
TABLE 27 Spain Power Factor Correction Devices Market, by Application, 2017-2030 (US$ Bn)
TABLE 28 Rest of Europe Power Factor Correction Devices Market, by Type, 2017-2030 (US$ Bn)
TABLE 29 Rest of Europe Power Factor Correction Devices Market, by Application, 2017-2030 (US$ Bn)
TABLE 30 Asia Pacific Power Factor Correction Devices Market, by Type, 2017-2030 (US$ Bn)
TABLE 31 Asia Pacific Power Factor Correction Devices Market, by Application, 2017-2030 (US$ Bn)
TABLE 32 Asia Pacific Power Factor Correction Devices Market, by Country, 2017-2030 (US$ Bn)
TABLE 33 China Power Factor Correction Devices Market, by Type, 2017-2030 (US$ Bn)
TABLE 34 China Power Factor Correction Devices Market, by Application, 2017-2030 (US$ Bn)
TABLE 35 Japan Power Factor Correction Devices Market, by Type, 2017-2030 (US$ Bn)
TABLE 36 Japan Power Factor Correction Devices Market, by Application, 2017-2030 (US$ Bn)
TABLE 37 India Power Factor Correction Devices Market, by Type, 2017-2030 (US$ Bn)
TABLE 38 India Power Factor Correction Devices Market, by Application, 2017-2030 (US$ Bn)
TABLE 39 South Korea Power Factor Correction Devices Market, by Type, 2017-2030 (US$ Bn)
TABLE 40 South Korea Power Factor Correction Devices Market, by Application, 2017-2030 (US$ Bn)
TABLE 41 South East Asia Power Factor Correction Devices Market, by Type, 2017-2030 (US$ Bn)
TABLE 42 South East Asia Power Factor Correction Devices Market, by Application, 2017-2030 (US$ Bn)
TABLE 43 Rest of Asia Pacific Power Factor Correction Devices Market, by Type, 2017-2030 (US$ Bn)
TABLE 44 Rest of Asia Pacific Power Factor Correction Devices Market, by Application, 2017-2030 (US$ Bn)
TABLE 45 Latin America Power Factor Correction Devices Market, by Type, 2017-2030 (US$ Bn)
TABLE 46 Latin America Power Factor Correction Devices Market, by Application, 2017-2030 (US$ Bn)
TABLE 47 Latin America Power Factor Correction Devices Market, by Country, 2017-2030 (US$ Bn)
TABLE 48 Brazil Power Factor Correction Devices Market, by Type, 2017-2030 (US$ Bn)
TABLE 49 Brazil Power Factor Correction Devices Market, by Application, 2017-2030 (US$ Bn)
TABLE 50 Mexico Power Factor Correction Devices Market, by Type, 2017-2030 (US$ Bn)
TABLE 51 Mexico Power Factor Correction Devices Market, by Application, 2017-2030 (US$ Bn)
TABLE 52 Rest of Latin America Power Factor Correction Devices Market, by Type, 2017-2030 (US$ Bn)
TABLE 53 Rest of Latin America Power Factor Correction Devices Market, by Application, 2017-2030 (US$ Bn)
TABLE 54 Middle East and Africa Power Factor Correction Devices Market, by Type, 2017-2030 (US$ Bn)
TABLE 55 Middle East and Africa Power Factor Correction Devices Market, by Application, 2017-2030 (US$ Bn)
TABLE 56 Middle East and Africa Power Factor Correction Devices Market, by Country, 2017-2030 (US$ Bn)
TABLE 57 GCC Countries Power Factor Correction Devices Market, by Type, 2017-2030 (US$ Bn)
TABLE 58 GCC Countries Power Factor Correction Devices Market, by Application, 2017-2030 (US$ Bn)
TABLE 59 South Africa Power Factor Correction Devices Market, by Type, 2017-2030 (US$ Bn)
TABLE 60 South Africa Power Factor Correction Devices Market, by Application, 2017-2030 (US$ Bn)
TABLE 61 Rest of the Middle East and Africa Power Factor Correction Devices Market, by Type, 2017-2030 (US$ Bn)
TABLE 62 Rest of the Middle East and Africa Power Factor Correction Devices Market, by Application, 2017-2030 (US$ Bn)

Frequently Asked Questions

How does COVID-19 Impact the global power factor correction devices market?

COVID-19 has significantly impacted the power factor correction devices market. The pandemic has caused problems in the manufacturing, demand, and supply chains for many goods and services, including PFC devices.

Which is the leading region of the market for power factor correction devices?

North America accounted for the most heightened share in the global power factor correction devices market.

What are the key drivers for the growth of the power factor correction devices market?

The market for PFC devices is primarily driven by the growing emphasis on energy efficiency and the need to lower energy prices and usage.

Which is the major segment in the power factor correction devices market by type?

The combined power factor correction devices segment had a major share in the global market in 2022.

Which is the major segment in the power factor correction devices market by application?

The application II segment had a major share in the global market.

Fiber Optics Market

Published:
Report ID: 36367

Field Programmable Gate Array (FPGA) Market

Published:
Report ID: 36359

Electronic Contract Manufacturing and Design Services Market

Published:
Report ID: 36355

Battery Energy Storage System Market

Published:
Report ID: 36352

Laptop Market

Published:
Report ID: 36318

Fiber Optic Preform Market

Published:
Report ID: 36286

Commercial Display Market

Published:
Report ID: 36262

Vibration Control System Market

Published:
Report ID: 36259

Semiconductor Memory Market

Published:
Report ID: 36250

North America Industrial Valve Market

Published:
Report ID: 36223

Flip Chip Market

Published:
Report ID: 36203

Contactless Biometrics Technology Market

Published:
Report ID: 36194

Purchase Options

$2999
Delivery Format: Excel.
$4999
Designed for the individual purchaser.
$6999
Users located at a single corporate site or regional office.
$7999
Allowed for unlimited sharing globally within one company.
Smallform of Sample request

Have a question?

User Profile

Don’t settle for less – trust Mitul to help you find the best solution.

Report delivery within 24 to 48 hours

– Other Info –

What people say?-

User Review

I am very impressed with the information in this report. The author clearly did their research when they came up with this product and it has already given me a lot of ideas.

Jana Schmidt
CEDAR CX Technologies

– Connect with us –

Phone

+91 6232 49 3207


support

24/7 Research Support


sales@credenceresearch.com

– Research Methodology –

Going beyond the basics: advanced techniques in research methodology

– Trusted By –

Pepshi, LG, Nestle
Motorola, Honeywell, Johnson and johnson
LG Chem, SIEMENS, Pfizer
Unilever, Samsonite, QIAGEN