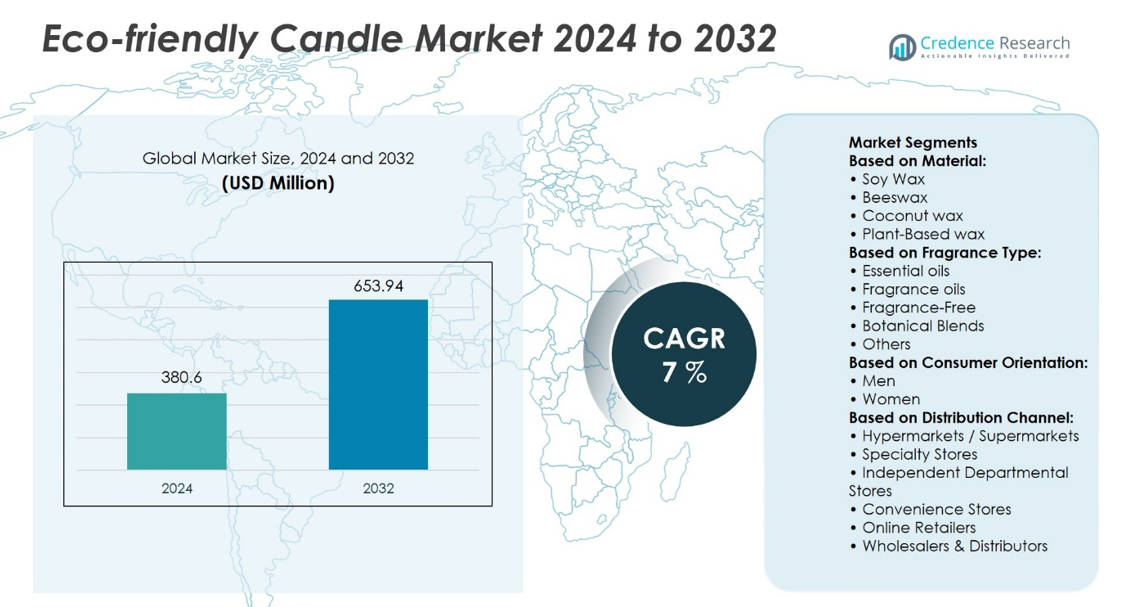
Home » Consumer Goods » Eco-friendly Candle Market

Eco-friendly Candle Market

Eco-friendly Candle Market By Material (Soy Wax, Beeswax, Coconut Wax, Plant-Based Wax); By Fragrance Type (Essential Oils, Fragrance Oils, Fragrance-Free, Botanical Blends, Others); By Consumer Orientation (Men, Women); By Distribution Channel (Hypermarkets / Supermarkets, Specialty Stores, Independent Departmental Stores, Convenience Stores, Online Retailers, Wholesalers & Distributors); By Geography – Growth, Share, Opportunities & Competitive Analysis, 2024 – 2032

Price: $4699

Published: | Report ID: 61971 | Report Format : Excel, PDF
REPORT ATTRIBUTE DETAILS
Historical Period  2019-2022
Base Year  2023
Forecast Period  2024-2032
Eco-Friendly Candle Market Size 2024  USD 380.6 Million
Eco-Friendly Candle Market, CAGR  7%
Eco-Friendly Candle Market Size 2032  USD 653.94 Million

Market Overview

The Eco-Friendly Candle Market is projected to grow from USD 380.6 million in 2024 to USD 653.94 million by 2032, reflecting a compound annual growth rate (CAGR) of 7%.

The eco-friendly candle market is driven by increasing consumer demand for sustainable and non-toxic products, fueled by growing environmental awareness and health consciousness. Rising concerns over the harmful effects of traditional candles have led to a shift toward natural, renewable materials such as soy, beeswax, and coconut wax. Additionally, the trend toward personalized and artisanal products further supports market growth. As eco-conscious consumers seek alternatives to petroleum-based candles, the industry is embracing innovations in biodegradable packaging and energy-efficient production methods, positioning eco-friendly candles as a preferred choice in the growing wellness and sustainability sectors.

The eco-friendly candle market is thriving in regions such as North America and Europe, where sustainability and wellness trends are gaining momentum. Key players in this space include P.F. Candle Co., Brooklyn Candle Studio, and Mrs. Meyer’s Clean Day, who have established a strong presence through innovative, natural products. Companies like Prosperity Candle and GoodLight Natural Candles emphasize ethical sourcing and environmental responsibility, appealing to eco-conscious consumers. The increasing demand for natural ingredients like soy, beeswax, and coconut wax, along with eco-friendly fragrances and packaging, drives the growth of these leading brands in global markets.

Design Element 2

Access crucial information at unmatched prices!

Request your sample report today & start making informed decisions powered by Credence Research!

Download Sample

CTA Design Element 3

Market Drivers

Growing Environmental Consciousness

Consumers are increasingly aware of the environmental impact of traditional candles made from paraffin wax, which is derived from petroleum. As sustainability becomes a key concern, many are moving toward cleaner alternatives. Health-conscious individuals are also driving this shift, as traditional candles can release harmful chemicals and pollutants during burning. For instance, a study by the Environmental Protection Agency (EPA) highlights that paraffin candles can emit harmful substances like benzene and toluene. Eco-friendly candles made from natural materials like soy, beeswax, and coconut wax offer a cleaner, healthier option, contributing to both personal well-being and environmental preservation.

Changing Consumer Preferences

The growing preference for natural and organic products aligns with the increasing interest in wellness and self-care. Consumers are now more likely to choose eco-friendly candles made from sustainably sourced materials. Ethical sourcing is a key driver, as consumers demand products that reflect their values, favoring brands committed to sustainable and responsible production practices. This shift is reshaping the candle industry, with more brands offering eco-conscious alternatives to meet this evolving demand.

Aromatherapy and Wellness Trends

Eco-friendly candles are gaining popularity in the wellness space, particularly for their role in aromatherapy. Scented candles are widely used for relaxation, stress relief, and mood enhancement, and eco-friendly options provide a cleaner, healthier experience. As consumers incorporate mindfulness and self-care into their routines, these candles fit seamlessly into their lifestyles. For instance, the Global Wellness Institute reported a rise in the use of aromatherapy products, including eco-friendly candles, as part of holistic wellness practices. The appeal of non-toxic, environmentally friendly products enhances the growing trend of using candles to support mental and emotional well-being.

E-commerce and Online Retail

The rise of e-commerce has made it easier for consumers to discover and purchase eco-friendly candles from a variety of brands. Online retail platforms offer convenience and accessibility, enabling consumers to find sustainable products from the comfort of their homes. Direct-to-consumer models allow brands to bypass traditional retail channels, offering personalized shopping experiences and building stronger connections with eco-conscious buyers. This has further fueled the growth of the eco-friendly candle market.

Market Trends

Shift Toward Sustainability and Health-Conscious Choices

Consumers are becoming increasingly aware of the environmental and health impacts of traditional paraffin candles, driving the demand for eco-friendly alternatives. The environmental impact of petroleum-derived paraffin wax, along with concerns over harmful chemicals and pollutants released during burning, has prompted many to seek cleaner, healthier options. As part of this trend, there is a growing preference for natural ingredients like soy wax, beeswax, and coconut wax, which are not only more sustainable but also non-toxic. This shift is further strengthened by rising consumer demand for ethically sourced materials and candles produced with sustainable practices. Consumers are making more mindful purchasing decisions, favoring products that align with their values of environmental responsibility and health consciousness.

Wellness, Minimalism, and E-commerce Growth

The rising popularity of aromatherapy and wellness trends has contributed significantly to the growth of the eco-friendly candle market. For instance, according to surveys from health organizations, scented candles are increasingly used for stress relief, relaxation, and mood enhancement, with eco-friendly options preferred due to their cleaner ingredients and sustainable nature. This aligns with the broader mindfulness and self-care movement, where consumers incorporate eco-friendly candles into their daily routines as part of their self-care rituals. Additionally, minimalist living trends are fueling the demand for simple, functional, and aesthetically pleasing products, with eco-friendly candles often serving as a complement to minimalist décor. Consumers are also prioritizing sustainable living, and choosing eco-friendly candles represents a small but impactful step toward a more sustainable lifestyle. The rise of e-commerce platforms has made it easier for consumers to discover and purchase these products, offering accessibility and convenience. Direct-to-consumer models allow brands to connect with buyers more personally, providing customization options for scents, labels, and packaging. Innovations in the industry, such as the use of phthalate-free fragrances, unique wax blends, and sustainable packaging, further enhance the appeal of eco-friendly candles. These developments cater to a growing demand for personalized, ethically made products, aligning with the increasing focus on sustainability and wellness.

Market Challenges Analysis

Production Costs and Limited Consumer Awareness

Eco-friendly candles often face higher production costs due to the use of premium, natural ingredients such as soy, beeswax, and coconut wax, which are more expensive than traditional paraffin wax. Sourcing these materials sustainably and adhering to ethical sourcing practices further increases costs. For instance, soy wax can cost between $2 to $5 per pound, significantly more than paraffin wax. These higher production expenses can be a significant challenge for manufacturers, especially when trying to maintain competitive pricing. Additionally, limited consumer awareness about the environmental and health benefits of eco-friendly candles can hinder market growth. Many consumers remain unaware of the advantages these candles offer, which can contribute to price sensitivity. If potential buyers do not fully understand the positive impact on their health and the environment, they may be hesitant to pay a premium for eco-friendly options, making it difficult for brands to capture a larger share of the market.

Competition and Quality Control Challenges

The eco-friendly candle market faces strong competition from traditional paraffin candles, which have long-established brand recognition and a more affordable price point. Traditional candle manufacturers often benefit from larger marketing budgets and broader distribution networks, making it harder for eco-friendly brands to compete. Moreover, ensuring consistent quality can be challenging when using natural ingredients. These ingredients are often more variable in quality and performance compared to synthetic materials, which can affect the final product. A particular challenge is maintaining a consistent scent throw, as natural fragrances can differ in intensity and duration. Additionally, the need to comply with various regulations, including labeling and safety standards, can add to production and distribution costs. For eco-friendly candle manufacturers looking to expand internationally, they may face additional hurdles such as tariffs and differing regulatory requirements across regions, further complicating the global distribution of their products.

Market Segmentation Analysis:

By Material:

The eco-friendly candle market can be segmented based on the materials used in production, with soy wax, beeswax, coconut wax, and plant-based wax being the primary materials. Soy wax is a leading material due to its natural origin, renewable sourcing, and clean burn, making it a preferred choice for eco-conscious consumers. Beeswax, a more premium option, is valued for its natural air-purifying properties and long burn time, often appealing to high-end markets. Coconut wax is gaining traction for its smooth texture and ability to hold fragrance well, providing an even burn. Plant-based waxes, derived from various sources such as palm or rapeseed, offer another eco-friendly alternative. These materials are increasingly favored for their sustainability and non-toxic nature, aligning with the growing trend of health-conscious, environmentally aware consumers. The demand for natural, plant-derived materials continues to rise as more consumers seek alternatives to traditional paraffin wax, pushing manufacturers to explore new innovations in wax blends that balance performance with sustainability.

By Fragrance Type:

Eco-friendly candles are also segmented by fragrance type, with essential oils, fragrance oils, fragrance-free, botanical blends, and others being the main categories. Essential oils are a popular choice for eco-friendly candles due to their natural and therapeutic properties, offering consumers a range of benefits like relaxation and stress relief. Fragrance oils are synthetically made but can still be designed to be non-toxic and eco-friendly, catering to consumers seeking a variety of scents. Fragrance-free candles are growing in popularity among consumers sensitive to scents or those seeking a more neutral, natural ambiance. Botanical blends, which combine plant-based fragrances, are also in demand, offering unique and fragrant experiences while maintaining sustainability. This growing diversity in fragrance options aligns with the increased consumer interest in wellness and self-care. As eco-friendly candles become an integral part of these practices, brands are increasingly focusing on offering diverse, high-quality fragrance options that appeal to a broad range of preferences while staying true to sustainable principles.

Segments:

Based on Material:

  • Soy Wax
  • Beeswax
  • Coconut wax
  • Plant-Based wax

Based on Fragrance Type:

  • Essential oils
  • Fragrance oils
  • Fragrance-Free
  • Botanical Blends
  • Others

Based on Consumer Orientation:

  • Men
  • Women

Based on Distribution Channel:

  • Hypermarkets / Supermarkets
  • Specialty Stores
  • Independent Departmental Stores
  • Convenience Stores
  • Online Retailers
  • Wholesalers & Distributors

Based on the Geography:

  • North America
    • U.S.
    • Canada
    • Mexico
  • Europe
    • Germany
    • France
    • U.K.
    • Italy
    • Spain
    • Rest of Europe
  • Asia Pacific
    • China
    • Japan
    • India
    • South Korea
    • South-east Asia
    • Rest of Asia Pacific
  • Latin America
    • Brazil
    • Argentina
    • Rest of Latin America
  • Middle East & Africa
    • GCC Countries
    • South Africa
    • Rest of the Middle East and Africa

Regional Analysis

North America

The North American eco-friendly candle market holds a significant share, accounting for approximately 35%. The demand for sustainable products in this region is driven by growing environmental awareness and health-conscious consumers seeking non-toxic alternatives to traditional candles. In particular, the United States leads the market due to its large consumer base and a strong trend toward wellness and sustainability. As eco-friendly candles align with the rising popularity of aromatherapy and mindfulness practices, consumers are increasingly opting for natural, plant-based waxes such as soy and beeswax, along with fragrance options derived from essential oils. The U.S. market is also supported by the expansion of e-commerce platforms, making eco-friendly products more accessible to a broader audience. Additionally, key retail players and local artisanal brands are further fueling market growth by promoting their environmentally responsible and ethically sourced candle options. The rise of minimalist and sustainable living trends has also led to a shift in consumer purchasing behavior, with eco-friendly candles becoming integral to home décor and self-care routines. This growing consumer preference, coupled with increased online availability, is expected to drive continued market growth in North America, with the region projected to maintain its prominent market share in the coming years.

Europe

Europe is another key region in the global eco-friendly candle market, holding a market share of approximately 30%. The European market is witnessing a surge in demand for sustainable candles, particularly driven by stringent environmental regulations and a high level of environmental awareness among consumers. Countries like Germany, the UK, and France are at the forefront of this shift, with consumers actively seeking eco-friendly alternatives to traditional paraffin-based candles. In addition to sustainability, the wellness trend plays a significant role, with many European consumers using eco-friendly candles for relaxation, aromatherapy, and home ambiance. The demand for natural materials such as soy wax, beeswax, and coconut wax is particularly high in these countries, as they align with consumer values around ethical sourcing and health-conscious living. The region’s market growth is further supported by an increase in eco-conscious retail and online stores, offering a wide range of eco-friendly candle options. As European consumers continue to prioritize sustainability and wellness, the eco-friendly candle market in this region is expected to expand significantly, with the trend of minimalism and sustainable living continuing to shape consumer purchasing habits.

Key Player Analysis

  • Prosperity Candle
  • Simply Curated
  • Bee Lucia Wellness Co.
  • Way Out Wax
  • Himalayan Trading Post
  • GoodLight Natural Candles
  • Brooklyn Candle Studio
  • Meyer’s Clean Day
  • Natura Soylights
  • Eco Candle Co.
  • Big Dipper Wax Works
  • F. Candle Co.
  • The Pure Candle
  • Eym
  • The Little Market

Competitive Analysis

The eco-friendly candle market is highly competitive, with several leading players shaping the industry through innovation and sustainability. Key players such as P.F. Candle Co., Brooklyn Candle Studio, Natura Soylights, Eym, Eco Candle Co., Prosperity Candle, GoodLight Natural Candles, Big Dipper Wax Works, Way Out Wax, The Little Market, Simply Curated, Bee Lucia Wellness Co., and Himalayan Trading Post are driving growth by offering eco-conscious products made from natural waxes like soy, beeswax, and coconut wax. Companies are focusing on producing candles made from renewable resources such as soy, beeswax, and coconut wax, catering to the growing consumer demand for clean, non-toxic products. Many brands emphasize the use of essential oils and natural fragrances, steering away from synthetic alternatives. In addition, the shift towards environmentally friendly packaging, such as recyclable or biodegradable materials, plays a critical role in attracting eco-conscious consumers. E-commerce platforms are further intensifying competition, providing brands with the opportunity to reach a wider audience and offer personalized shopping experiences. To stay competitive, companies are also adopting direct-to-consumer models and emphasizing social responsibility, with some focusing on fair trade practices and supporting local artisans. The market continues to evolve with the rising importance of both sustainability and wellness.

Recent Developments

  • In November 2023, P.F. Candle Co. collaborated with Lisa Says Gah. This collaboration has helped the organization augment its products, taking inspiration from the latter and diversifying its offerings in the market. In addition, the organization has bolstered its market position in the Italian market.

Market Concentration & Characteristics

The eco-friendly candle market exhibits moderate concentration, with a blend of established brands and emerging artisanal producers. While large companies dominate through extensive distribution networks and strong brand recognition, smaller, niche players are carving out a significant presence by emphasizing sustainability, ethical sourcing, and unique product offerings. The market is characterized by a growing consumer preference for candles made from natural, renewable materials such as soy, beeswax, and coconut wax. Brands are increasingly focusing on clean, non-toxic ingredients and eco-friendly packaging to meet the rising demand for environmentally responsible products. In addition, there is a noticeable trend towards customization and personalization, with consumers seeking tailored scents and designs. The market is also highly influenced by wellness and self-care trends, where candles are seen not only as decorative items but also as tools for relaxation and aromatherapy. This dynamic environment fosters innovation while maintaining a strong commitment to sustainability.

Shape Your Report to Specific Countries or Regions & Enjoy 30% Off!

Report Coverage

The research report offers an in-depth analysis based on Material, Fragrance Type, Consumer Orientation, Distribution Channel and Geography. It details leading market players, providing an overview of their business, product offerings, investments, revenue streams, and key applications. Additionally, the report includes insights into the competitive environment, SWOT analysis, current market trends, as well as the primary drivers and constraints. Furthermore, it discusses various factors that have driven market expansion in recent years. The report also explores market dynamics, regulatory scenarios, and technological advancements that are shaping the industry. It assesses the impact of external factors and global economic changes on market growth. Lastly, it provides strategic recommendations for new entrants and established companies to navigate the complexities of the market.

Future Outlook

  1. The demand for eco-friendly candles will continue to grow as consumers increasingly prioritize sustainability and wellness.
  2. Natural waxes like soy, beeswax, and coconut wax will dominate the market due to their eco-friendly and non-toxic properties.
  3. The use of clean fragrances, such as essential oils and natural botanical blends, will become more popular.
  4. Consumers will seek candles with ethical sourcing and sustainable packaging, pushing brands to adopt eco-conscious practices.
  5. E-commerce platforms will further enhance accessibility, allowing brands to reach a broader, global audience.
  6. The market will witness growth in personalized and customized candle options to cater to individual preferences.
  7. Increased interest in aromatherapy will drive the demand for scented eco-friendly candles for stress relief and relaxation.
  8. Innovative candle-making techniques and blends, including plant-based wax alternatives, will emerge to meet consumer expectations.
  9. Brands focusing on transparency and environmental impact will have a competitive edge in the marketplace.
  10. As consumer awareness of environmental issues rises, eco-friendly candles will become a staple in sustainable home décor.

CHAPTER NO. 1 : INTRODUCTION……………………………………………………………….. 31
1.1.1. Report Description ………………………………………………………………………………………. 31
Purpose of the Report……………………………………………………………………………………………31
USP & Key Offerings………………………………………………………………………………………………31
1.1.2. Key Benefits for Stakeholders………………………………………………………………………… 31
1.1.3. Target Audience ………………………………………………………………………………………….. 32
1.1.4. Report Scope 32
1.1.5. Regional Scope……………………………………………………………………………………………. 33
CHAPTER NO. 2 : EXECUTIVE SUMMARY………………………………………………………. 34
2.1. Eco-friendly Candles Market Snapshot…………………………………………………………….. 34
2.1.1. Global Eco-friendly Candles Market, 2018 – 2032 (Million Units) (USD Million) ………… 36
2.2. Insights from Primary Respondents…………………………………………………………………. 37
CHAPTER NO. 3 : GEOPOLITICAL CRISIS IMPACT ANALYSIS………………………………. 38
3.1. Russia-Ukraine and Israel-Palestine War Impacts ………………………………………………. 38
CHAPTER NO. 4 : ECO-FRIENDLY CANDLES MARKET – INDUSTRY ANALYSIS………… 39
4.1. Introduction 39
4.2. Market Drivers……………………………………………………………………………………………. 40
4.2.1. Growing Hospitality Industry …………………………………………………………………………. 40
4.2.2. Rising E-commerce Sector……………………………………………………………………………… 41
4.3. Market Restraints………………………………………………………………………………………… 42
4.3.1. Excessive Competition and Larger Market Share Held by Leading Eco-Friendly Candle
Manufacturers ……………………………………………………………………………………………. 42
4.4. Market Opportunities…………………………………………………………………………………… 43
4.4.1. Market Opportunity Analysis…………………………………………………………………………. 43
4.5. Porter’s Five Forces Analysis………………………………………………………………………….. 44
CHAPTER NO. 5 : ANALYSIS COMPETITIVE LANDSCAPE …………………………………… 45
5.1. Company Market Share Analysis – 2023…………………………………………………………… 45
5.1.1. Global Eco-friendly Candles Market: Company Market Share, by Volume, 2023 ………. 45
5.1.2. Global Eco-friendly Candles Market: Company Market Share, by Revenue, 2023……… 46
5.1.3. Global Eco-friendly Candles Market: Top 6 Company Market Share, by Revenue, 2023 46
5.1.4. Global Eco-friendly Candles Market: Top 3 Company Market Share, by Revenue, 2023 47
5.2. Global Eco-friendly Candles Market Company Volume Market Share, 2023…………….. 48
5.3. Global Eco-friendly Candles Market Company Revenue Market Share, 2023 …………… 49
5.4. Company Assessment Metrics, 2023 ……………………………………………………………….. 50
5.4.1. Stars 50
5.4.2. Emerging Leaders………………………………………………………………………………………… 50
5.4.3. Pervasive Players…………………………………………………………………………………………. 50
5.4.4. Participants 50
5.5. Start-ups /SMEs Assessment Metrics, 2023 ………………………………………………………. 50
5.5.1. Progressive Companies…………………………………………………………………………………. 50
5.5.2. Responsive Companies…………………………………………………………………………………. 50
5.5.3. Dynamic Companies…………………………………………………………………………………….. 50
5.5.4. Starting Blocks ……………………………………………………………………………………………. 50
5.6. Strategic Developments………………………………………………………………………………… 51
5.6.1. Acquisitions & Mergers…………………………………………………………………………………. 51
New Product Launch……………………………………………………………………………………………..51
Regional Expansion ……………………………………………………………………………………………….51
5.7. Key Players Product Matrix……………………………………………………………………………. 52
CHAPTER NO. 6 : PESTEL & ADJACENT MARKET ANALYSIS ………………………………. 53
6.1. PESTEL 53
6.1.1. Political Factors…………………………………………………………………………………………… 53
6.1.2. Economic Factors ………………………………………………………………………………………… 53
6.1.3. Social Factors 53
6.1.4. Technological Factors …………………………………………………………………………………… 53
6.1.5. Environmental Factors………………………………………………………………………………….. 53
6.1.6. Legal Factors 53
6.2. Adjacent Market Analysis……………………………………………………………………………… 53
CHAPTER NO. 7 : ECO-FRIENDLY CANDLES MARKET – BY FRAGRANCE TYPE SEGMENT
ANALYSIS ……………………………………………………………………….. 54
7.1. Eco-friendly Candles Market Overview, by Fragrance Type Segment……………………… 54
7.1.1. Eco-friendly Candles Market Volume Share, By Fragrance Type, 2023 & 2032 …………. 55
7.1.2. Eco-friendly Candles Market Revenue Share, By Fragrance Type, 2023 & 2032 ………… 55
7.1.3. Eco-friendly Candles Market Attractiveness Analysis, By Fragrance Type ……………….. 56
7.1.4. Incremental Revenue Growth Opportunity, by Fragrance Type, 2024 – 2032……………. 56
7.1.5. Eco-friendly Candles Market Revenue, By Fragrance Type, 2018, 2023, 2027 & 2032 … 57
7.2. Essential oils 58
7.2.1. Global Essential oils Eco-friendly Candles Market Volume & Revenue, By Region, 2018 –
2023 (Million Units) (USD Million)…………………………………………………………………… 59
7.2.2. Global Essential oils Eco-friendly Candles Market Volume & Revenue, By Region, 2024 –
2032 (Million Units) (USD Million)…………………………………………………………………… 59
7.3. Fragrance oils 60
7.3.1. Global Fragrance oils Eco-friendly Candles Market Volume & Revenue, By Region, 2018 –
2023 (Million Units) (USD Million)…………………………………………………………………… 61
7.3.2. Global Fragrance oils Eco-friendly Candles Market Volume & Revenue, By Region, 2024 –
2032 (Million Units) (USD Million)…………………………………………………………………… 61
7.4. Fragrance-Free ……………………………………………………………………………………………. 62
7.5. Global Fragrance-Free Eco-friendly Candles Market Volume & Revenue, By Region, 2018
– 2023 (Million Units) (USD Million)…………………………………………………………………. 63
7.6. Global Fragrance-Free Eco-friendly Candles Market Volume & Revenue, By Region, 2024
– 2032 (Million Units) (USD Million) ………………………………………………………………… 63
7.7. Botanical Blends………………………………………………………………………………………….. 65
7.7.1. Global Botanical Blends Eco-friendly Candles Market Volume & Revenue, By Region,
2018 – 2023 (Million Units) (USD Million)………………………………………………………….. 66
7.7.2. Global Botanical Blends Eco-friendly Candles Market Volume & Revenue, By Region,
2024 – 2032 (Million Units) (USD Million)…………………………………………………………. 66
7.8. Others 67
7.8.1. Global Others Eco-friendly Candles Market Volume & Revenue, By Region, 2018 – 2023
(Million Units) (USD Million)………………………………………………………………………….. 68
7.8.2. Global Others Eco-friendly Candles Market Volume & Revenue, By Region, 2024 – 2032
(Million Units) (USD Million)………………………………………………………………………….. 68
CHAPTER NO. 8 : ECO-FRIENDLY CANDLES MARKET – BY MATERIAL SEGMENT
ANALYSIS ……………………………………………………………………….. 69
8.1. Eco-friendly Candles Market Overview, by Material Segment………………………………. 69
8.1.1. Eco-friendly Candles Market Volume Share, By Material, 2023 & 2032…………………… 70
8.1.2. Eco-friendly Candles Market Revenue Share, By Material, 2023 & 2032 …………………. 70
8.1.3. Eco-friendly Candles Market Attractiveness Analysis, By Material…………………………. 71
8.1.4. Incremental Revenue Growth Opportunity, by Material, 2024 – 2032…………………….. 71
8.1.5. Eco-friendly Candles Market Revenue, By Material, 2018, 2023, 2027 & 2032 …………. 72
8.2. Soy Wax 73
8.2.1. Global Soy Wax Eco-friendly Candles Market Volume & Revenue, By Region, 2018 – 2023
(Million Units) (USD Million)………………………………………………………………………….. 74
8.2.2. Global Soy Wax Eco-friendly Candles Market Volume & Revenue, By Region, 2024 – 2032
(Million Units) (USD Million)………………………………………………………………………….. 74
8.3. Beeswax 75
8.3.1. Global Beeswax Eco-friendly Candles Market Volume & Revenue, By Region, 2018 – 2023
(Million Units) (USD Million)………………………………………………………………………….. 76
8.3.2. Global Beeswax Eco-friendly Candles Market Volume & Revenue, By Region, 2024 –
2032 (Million Units) (USD Million)…………………………………………………………………… 76
8.4. Coconut wax 77
8.5. Global Coconut wax Eco-friendly Candles Market Volume & Revenue, By Region, 2018 –
2023 (Million Units) (USD Million)…………………………………………………………………… 78
8.6. Global Coconut wax Eco-friendly Candles Market Volume & Revenue, By Region, 2024 –
2032 (Million Units) (USD Million)…………………………………………………………………… 78
8.7. Plant-Based wax………………………………………………………………………………………….. 79
8.7.1. Global Plant-Based wax Eco-friendly Candles Market Volume & Revenue, By Region,
2018 – 2023 (Million Units) (USD Million)………………………………………………………….. 80
8.7.2. Global Plant-Based wax Eco-friendly Candles Market Volume & Revenue, By Region,
2024 – 2032 (Million Units) (USD Million)…………………………………………………………. 80
CHAPTER NO. 9 : ECO-FRIENDLY CANDLES MARKET – BY CONSUMER ORIENTATION
SEGMENT ANALYSIS …………………………………………………………. 81
9.1. Eco-friendly Candles Market Overview, by Consumer Orientation Segment ……………. 81
9.1.1. Eco-friendly Candles Market Volume Share, By Consumer Orientation, 2023 & 2032… 82
9.1.2. Eco-friendly Candles Market Revenue Share, By Consumer Orientation, 2023 & 2032 . 82
9.1.3. Eco-friendly Candles Market Attractiveness Analysis, By Consumer Orientation………. 83
9.1.4. Incremental Revenue Growth Opportunity, by Consumer Orientation, 2024 – 2032….. 83
9.1.5. Eco-friendly Candles Market Revenue, By Consumer Orientation, 2018, 2023, 2027 & 2032 84
9.2. Men 85
9.2.1. Global Men Eco-friendly Candles Market Volume & Revenue, By Region, 2018 – 2023
(Million Units) (USD Million)………………………………………………………………………….. 86
9.2.2. Global Men Eco-friendly Candles Market Volume & Revenue, By Region, 2024 – 2032
(Million Units) (USD Million)………………………………………………………………………….. 86
9.3. Women 87
9.3.1. Global Women Eco-friendly Candles Market Volume & Revenue, By Region, 2018 – 2023
(Million Units) (USD Million)………………………………………………………………………….. 88
9.3.2. Global Women Eco-friendly Candles Market Volume & Revenue, By Region, 2024 – 2032
(Million Units) (USD Million)………………………………………………………………………….. 88
CHAPTER NO. 10 : ECO-FRIENDLY CANDLES MARKET – BY DISTRIBUTION CHANNEL
SEGMENT ANALYSIS …………………………………………………………. 89
10.1. Eco-friendly Candles Market Overview, by Distribution Channel Segment………………. 89
10.1.1.Eco-friendly Candles Market Volume Share, By Distribution Channel, 2023 & 2032 ….. 90
10.1.2.Eco-friendly Candles Market Revenue Share, By Distribution Channel, 2023 & 2032…. 90
10.1.3.Eco-friendly Candles Market Attractiveness Analysis, By Distribution Channel ………… 91
10.1.4.Incremental Revenue Growth Opportunity, by Distribution Channel, 2024 – 2032 ……. 91
10.1.5.Eco-friendly Candles Market Revenue, By Distribution Channel, 2018, 2023, 2027 & 2032 92
10.2. Hypermarkets / Supermarkets……………………………………………………………………….. 93
10.2.1.Global Hypermarkets / Supermarkets Eco-friendly Candles Market Volume & Revenue,
By Region, 2018 – 2023 (Million Units) (USD Million)…………………………………………… 94
10.2.2.Global Hypermarkets / Supermarkets Eco-friendly Candles Market Volume & Revenue,
By Region, 2024 – 2032 (Million Units) (USD Million)………………………………………….. 95
10.3. Specialty Stores…………………………………………………………………………………………… 96
10.3.1.Global Specialty Stores Eco-friendly Candles Market Volume & Revenue, By Region, 2018
– 2023 (Million Units) (USD Million)…………………………………………………………………. 97
10.3.2.Global Specialty Stores Eco-friendly Candles Market Volume & Revenue, By Region, 2024
– 2032 (Million Units) (USD Million) ………………………………………………………………… 98
10.4. Independent Departmental Stores………………………………………………………………….. 99
10.5. Global Independent Departmental Stores Eco-friendly Candles Market Volume &
Revenue, By Region, 2018 – 2023 (Million Units) (USD Million)……………………………. 100
10.6. Global Independent Departmental Stores Eco-friendly Candles Market Volume &
Revenue, By Region, 2024 – 2032 (Million Units) (USD Million)…………………………… 101
10.7. Online Retailers…………………………………………………………………………………………. 102
10.7.1.Global Online Retailers Eco-friendly Candles Market Volume & Revenue, By Region,
2018 – 2023 (Million Units) (USD Million)………………………………………………………… 103
10.7.2.Global Online Retailers Eco-friendly Candles Market Volume & Revenue, By Region,
2024 – 2032 (Million Units) (USD Million)……………………………………………………….. 104
10.8. Others 105
10.8.1.Global Others Eco-friendly Candles Market Volume & Revenue, By Region, 2018 – 2023
(Million Units) (USD Million)………………………………………………………………………… 106
10.8.2.Global Others Eco-friendly Candles Market Volume & Revenue, By Region, 2024 – 2032
(Million Units) (USD Million)………………………………………………………………………… 107
CHAPTER NO. 11 : ECO-FRIENDLY CANDLES MARKET – REGIONAL ANALYSIS………. 108
11.1. Eco-friendly Candles Market Overview, by Regional Segments …………………………… 108
11.2. Region 109
11.2.1.Global Eco-friendly Candles Market Volume Share, By Region, 2023 & 2032 …………. 109
11.2.2.Global Eco-friendly Candles Market Revenue Share, By Region, 2023 & 2032 ………… 109
11.2.3.Eco-friendly Candles Market Attractiveness Analysis, By Region …………………………. 110
11.2.4.Incremental Revenue Growth Opportunity, by Region, 2024 – 2032 …………………….. 110
11.2.5.Eco-friendly Candles Market Revenue, By Region, 2018, 2023, 2027 & 2032………….. 111
11.2.6.Global Eco-friendly Candles Market Volume & Revenue, By Region, 2018 – 2023 (Million
Units) (USD Million)……………………………………………………………………………………. 112
11.2.7.Global Eco-friendly Candles Market Volume & Revenue, By Region, 2024 – 2032 (Million
Units) (USD Million)……………………………………………………………………………………. 112
11.3. Fragrance Type………………………………………………………………………………………….. 113
11.3.1.Global Eco-friendly Candles Market Volume & Revenue, By Fragrance Type, 2018 – 2023
(Million Units) (USD Million)………………………………………………………………………… 113
11.4. Global Eco-friendly Candles Market Volume & Revenue, By Fragrance Type, 2024 – 2032
(Million Units) (USD Million)………………………………………………………………………… 114
11.5. Material 115
11.5.1.Global Eco-friendly Candles Market Volume & Revenue, By Material, 2018 – 2023
(Million Units) (USD Million)………………………………………………………………………… 115
11.5.2.Global Eco-friendly Candles Market Volume & Revenue, By Material, 2024 – 2032
(Million Units) (USD Million)………………………………………………………………………… 116
11.6. Consumer Orientation………………………………………………………………………………… 117
11.6.1.Global Eco-friendly Candles Market Volume & Revenue, By Consumer Orientation, 2018
– 2023 (Million Units) (USD Million)……………………………………………………………….. 117
11.6.2.Global Eco-friendly Candles Market Volume & Revenue, By Consumer Orientation, 2024
– 2032 (Million Units) (USD Million)……………………………………………………………….. 118
11.7. Distribution Channel…………………………………………………………………………………… 119
11.7.1.Global Eco-friendly Candles Market Volume & Revenue, By Distribution Channel, 2018 –
2023 (Million Units) (USD Million)…………………………………………………………………. 119
11.7.2.Global Eco-friendly Candles Market Volume & Revenue, By Distribution Channel, 2024 –
2032 (Million Units) (USD Million)…………………………………………………………………. 120
CHAPTER NO. 12 : ECO-FRIENDLY CANDLES MARKET – NORTH AMERICA…………… 121
12.1. North America121
12.1.1.Key Highlights 121
12.1.2.North America Eco-friendly Candles Market Volume, By Country, 2018 – 2032 (Million Units) 122
12.1.3.North America Eco-friendly Candles Market Revenue, By Country, 2018 – 2023 (USD Million) 123
12.1.4.North America Eco-friendly Candles Market Volume, By Fragrance Type, 2018 – 2023 (Million Units) 124
12.1.5.North America Eco-friendly Candles Market Revenue, By Fragrance Type, 2018 – 2023 (USD Million) 125
12.1.6.North America Eco-friendly Candles Market Volume, By Material, 2018 – 2023 (Million Units) 126
12.1.7.North America Eco-friendly Candles Market Revenue, By Material, 2018 – 2023 (USD Million) 127
12.1.8.North America Eco-friendly Candles Market Volume, By Consumer Orientation, 2018 –
2023 (Million Units)……………………………………………………………………………………. 128
12.1.9.North America Eco-friendly Candles Market Revenue, By Consumer Orientation, 2018 –
2023 (USD Million) …………………………………………………………………………………….. 129
12.1.10. North America Eco-friendly Candles Market Volume, By Distribution
Channel, 2018 – 2023 (Million Units) ……………………………………………………………… 130
12.1.11. North America Eco-friendly Candles Market Revenue, By Distribution
Channel, 2018 – 2023 (USD Million)……………………………………………………………….. 131
12.2. U.S. 132
12.3. Canada 132
12.4. Mexico 132
CHAPTER NO. 13 : ECO-FRIENDLY CANDLES MARKET – EUROPE……………………….. 133
13.1. Europe 133
13.1.1.Key Highlights 133
13.1.2.Europe Eco-friendly Candles Market Volume, By Country, 2018 – 2032 (Million Units)134
13.1.3.Europe Eco-friendly Candles Market Revenue, By Country, 2018 – 2023 (USD Million)135
13.1.4.Europe Eco-friendly Candles Market Volume, By Fragrance Type, 2018 – 2023 (Million Units) 136
13.1.5.Europe Eco-friendly Candles Market Revenue, By Fragrance Type, 2018 – 2023 (USD Million) 137
13.1.6.Europe Eco-friendly Candles Market Volume, By Material, 2018 – 2023 (Million Units)138
13.1.7.Europe Eco-friendly Candles Market Revenue, By Material, 2018 – 2023 (USD Million)139
13.1.8.Europe Eco-friendly Candles Market Volume, By Consumer Orientation, 2018 – 2023 (Million Units) 140
13.1.9.Europe Eco-friendly Candles Market Revenue, By Consumer Orientation, 2018 – 2023 (USD Million) 141
13.1.10. Europe Eco-friendly Candles Market Volume, By Distribution Channel,
2018 – 2023 (Million Units)…………………………………………………………………………… 142
13.1.11. Europe Eco-friendly Candles Market Revenue, By Distribution Channel,
2018 – 2023 (USD Million) ……………………………………………………………………………. 143
13.2. UK 144
13.3. France 144
13.4. Germany 144
13.5. Italy 144
13.6. Spain 144
13.7. Russia 144
13.8. Belgium 144
13.9. Netherland 144
13.10. Austria 144
13.11. Sweden 144
13.12. Poland 144
13.13. Denmark 144
13.14. Switzerland 144
13.15. Rest of Europe144
CHAPTER NO. 14 : ECO-FRIENDLY CANDLES MARKET – ASIA PACIFIC…………………. 145
14.1. Asia Pacific 145
14.1.1.Key Highlights 145
14.1.2.Asia Pacific Eco-friendly Candles Market Volume, By Country, 2018 – 2032 (Million Units) 146
14.1.3.Asia Pacific Eco-friendly Candles Market Revenue, By Country, 2018 – 2023 (USD Million) 147
14.1.4.Asia Pacific Eco-friendly Candles Market Volume, By Fragrance Type, 2018 – 2023 (Million Units) 148
14.1.5.Asia Pacific Eco-friendly Candles Market Revenue, By Fragrance Type, 2018 – 2023 (USD Million) 149
14.1.6.Asia Pacific Eco-friendly Candles Market Volume, By Material, 2018 – 2023 (Million Units) 150
14.1.7.Asia Pacific Eco-friendly Candles Market Revenue, By Material, 2018 – 2023 (USD Million) 151
14.1.8.Asia Pacific Eco-friendly Candles Market Volume, By Consumer Orientation, 2018 – 2023 (Million Units) 152
14.1.9.Asia Pacific Eco-friendly Candles Market Revenue, By Consumer Orientation, 2018 – 2023 (USD Million) 153
14.1.10. Asia Pacific Eco-friendly Candles Market Volume, By Distribution Channel, 2018 – 2023 (Million Units)…………………………………………………………………………… 154
14.1.11. Asia Pacific Eco-friendly Candles Market Revenue, By Distribution
Channel, 2018 – 2023 (USD Million)……………………………………………………………….. 155
14.2. China 156
14.3. Japan 156
14.4. South Korea 156
14.5. India 156
14.6. Australia 156
14.7. Thailand 156
14.8. Indonesia 156
14.9. Vietnam 156
14.10. Malaysia 156
14.11. Philippines 156
14.12. Taiwan 156
14.13. Rest of Asia Pacific……………………………………………………………………………………… 156
CHAPTER NO. 15 : ECO-FRIENDLY CANDLES MARKET – LATIN AMERICA…………….. 157
15.1. Latin America 157
15.1.1.Key Highlights 157
15.1.2.Latin America Eco-friendly Candles Market Volume, By Country, 2018 – 2032 (Million Units) 158
15.1.3.Latin America Eco-friendly Candles Market Revenue, By Country, 2018 – 2023 (USD Million) 159
15.1.4.Latin America Eco-friendly Candles Market Volume, By Fragrance Type, 2018 – 2023 (Million Units) 160
15.1.5.Latin America Eco-friendly Candles Market Revenue, By Fragrance Type, 2018 – 2023 (USD Million) 161
15.1.6.Latin America Eco-friendly Candles Market Volume, By Material, 2018 – 2023 (Million Units) 162
15.1.7.Latin America Eco-friendly Candles Market Revenue, By Material, 2018 – 2023 (USD Million) 163
15.1.8.Latin America Eco-friendly Candles Market Volume, By Consumer Orientation, 2018 – 2023 (Million Units)……………………………………………………………………………………. 164
15.1.9.Latin America Eco-friendly Candles Market Revenue, By Consumer Orientation, 2018 – 2023 (USD Million) …………………………………………………………………………………….. 165
15.1.10. Latin America Eco-friendly Candles Market Volume, By Distribution
Channel, 2018 – 2023 (Million Units) ……………………………………………………………… 166
15.1.11. Latin America Eco-friendly Candles Market Revenue, By Distribution
Channel, 2018 – 2023 (USD Million)……………………………………………………………….. 167
15.2. Brazil 168
15.3. Argentina 168
15.4. Peru 168
15.5. Chile 168
15.6. Colombia 168
15.7. Rest of Latin America………………………………………………………………………………….. 168
CHAPTER NO. 16 : ECO-FRIENDLY CANDLES MARKET – MIDDLE EAST………………… 169
16.1. Middle East 169
16.1.1.Key Highlights 169
16.1.2.Middle East Eco-friendly Candles Market Volume, By Country, 2018 – 2032 (Million Units) 170
16.1.3.Middle East Eco-friendly Candles Market Revenue, By Country, 2018 – 2023 (USD Million) 171
16.1.4.Middle East Eco-friendly Candles Market Volume, By Fragrance Type, 2018 – 2023 (Million Units) 172
16.1.5.Middle East Eco-friendly Candles Market Revenue, By Fragrance Type, 2018 – 2023 (USD Million) 173
16.1.6.Middle East Eco-friendly Candles Market Volume, By Material, 2018 – 2023 (Million Units) 174
16.1.7.Middle East Eco-friendly Candles Market Revenue, By Material, 2018 – 2023 (USD Million) 175
16.1.8.Middle East Eco-friendly Candles Market Volume, By Consumer Orientation, 2018 – 2023 (Million Units) 176
16.1.9.Middle East Eco-friendly Candles Market Revenue, By Consumer Orientation, 2018 – 2023 (USD Million) …………………………………………………………………………………….. 177
16.1.10. Middle East Eco-friendly Candles Market Volume, By Distribution
Channel, 2018 – 2023 (Million Units) ……………………………………………………………… 178
16.1.11. Middle East Eco-friendly Candles Market Revenue, By Distribution
Channel, 2018 – 2023 (USD Million)……………………………………………………………….. 179
16.2. UAE 180
16.3. KSA 180
16.4. Israel 180
16.5. Turkey 180
16.6. Iran 180
16.7. Rest of Middle East…………………………………………………………………………………….. 180
CHAPTER NO. 17 : ECO-FRIENDLY CANDLES MARKET – AFRICA ………………………… 181
17.1. Africa 181
17.1.1.Key Highlights 181
17.1.2.Africa Eco-friendly Candles Market Volume, By Country, 2018 – 2032 (Million Units). 182
17.1.3.Africa Eco-friendly Candles Market Revenue, By Country, 2018 – 2023 (USD Million) . 183
17.1.4.Africa Eco-friendly Candles Market Volume, By Fragrance Type, 2018 – 2023 (Million Units) 184
17.1.5.Africa Eco-friendly Candles Market Revenue, By Fragrance Type, 2018 – 2023 (USD Million) 185
17.1.6.Africa Eco-friendly Candles Market Volume, By Material, 2018 – 2023 (Million Units) 186
17.1.7.Africa Eco-friendly Candles Market Revenue, By Material, 2018 – 2023 (USD Million) 187
17.1.8.Africa Eco-friendly Candles Market Volume, By Consumer Orientation, 2018 – 2023 (Million Units) 188
17.1.9.Africa Eco-friendly Candles Market Revenue, By Consumer Orientation, 2018 – 2023 (USD Million) 189
17.1.10. Africa Eco-friendly Candles Market Volume, By Distribution Channel, 2018
– 2023 (Million Units)………………………………………………………………………………….. 190
17.1.11. Africa Eco-friendly Candles Market Revenue, By Distribution Channel,
2018 – 2023 (USD Million) ……………………………………………………………………………. 191
17.2. Egypt 192
17.3. Nigeria 192
17.4. Algeria 192
17.5. Morocco 192
17.6. Rest of Africa 192
CHAPTER NO. 18 : COMPANY PROFILES……………………………………………………….. 193
18.1. P.F. Candle Co. ………………………………………………………………………………………….. 193
18.1.1.Company Overview ……………………………………………………………………………………. 193
18.1.2.Product Portfolio……………………………………………………………………………………….. 193
18.1.3.Swot Analysis 193
18.1.4.Business Strategy ………………………………………………………………………………………. 193
18.1.5.Financial Overview …………………………………………………………………………………….. 194
18.2. Brooklyn Candle Studio ………………………………………………………………………………. 195
18.3. Natura Soylight …………………………………………………………………………………………. 195
18.4. Eym 195
18.5. Eco Candle Co.195
18.6. Mrs. Meyer’s Clean Day ………………………………………………………………………………. 195
18.7. The Pure Candle ………………………………………………………………………………………… 195
18.8. Prosperity Candle ………………………………………………………………………………………. 195
18.9. GoodLight Natural Candles ………………………………………………………………………….. 195
18.10. Big Dipper Wax Works………………………………………………………………………………… 195
18.11. Way Out Wax 195
18.12. The Little Market……………………………………………………………………………………….. 195
18.13. Simply Curated………………………………………………………………………………………….. 195
18.14. Bee Lucia Wellness Co. ……………………………………………………………………………….. 195
18.15. Himalayan Trading Post………………………………………………………………………………. 195

List of Figures
FIG NO. 1. Global Eco-friendly Candles Market Volume & Revenue, 2018 – 2032 (Million Units) (USD
Million)…………………………………………………………………………………………………………………….36
FIG NO. 2. Porter’s Five Forces Analysis for Global Eco-friendly Candles Market……………………………….44
FIG NO. 3. Company Share Analysis, 2023 ……………………………………………………………………………………45
FIG NO. 4. Company Share Analysis, 2023 ……………………………………………………………………………………46
FIG NO. 5. Company Share Analysis, 2023 ……………………………………………………………………………………46
FIG NO. 6. Company Share Analysis, 2023 ……………………………………………………………………………………47
FIG NO. 7. Eco-friendly Candles Market – Company Volume Market Share, 2023…………………………….48
FIG NO. 8. Eco-friendly Candles Market – Company Revenue Market Share, 2023 ……………………………49
FIG NO. 9. Eco-friendly Candles Market Volume Share, By Fragrance Type, 2023 & 2032…………………..55
FIG NO. 10. Eco-friendly Candles Market Revenue Share, By Fragrance Type, 2023 & 2032 …………………55
FIG NO. 11. Market Attractiveness Analysis, By Fragrance Type ……………………………………………………….56
FIG NO. 12. Incremental Revenue Growth Opportunity by Fragrance Type, 2024 – 2032……………………..56
FIG NO. 13. Eco-friendly Candles Market Revenue, By Fragrance Type, 2018, 2023, 2027 & 2032 ………..57
FIG NO. 14. Global Eco-friendly Candles Market for Essential oils, Volume & Revenue (Million Units)
(USD Million) 2018 – 2032 …………………………………………………………………………………………..58
FIG NO. 15. Global Eco-friendly Candles Market for Fragrance oils, Volume & Revenue (Million Units)
(USD Million) 2018 – 2032 …………………………………………………………………………………………..60
FIG NO. 16. Global Eco-friendly Candles Market for Fragrance-Free, Volume & Revenue (Million Units)
(USD Million) 2018 – 2032 …………………………………………………………………………………………..62
FIG NO. 17. Global Eco-friendly Candles Market for Botanical Blends, Volume & Revenue (Million
Units) (USD Million) 2018 – 2032………………………………………………………………………………….65
FIG NO. 18. Global Eco-friendly Candles Market for Others, Volume & Revenue (Million Units) (USD
Million) 2018 – 2032…………………………………………………………………………………………………..67
FIG NO. 19. Eco-friendly Candles Market Volume Share, By Material, 2023 & 2032…………………………….70
FIG NO. 20. Eco-friendly Candles Market Revenue Share, By Material, 2023 & 2032 …………………………..70
FIG NO. 21. Market Attractiveness Analysis, By Material …………………………………………………………………71
FIG NO. 22. Incremental Revenue Growth Opportunity by Material, 2024 – 2032……………………………….71
FIG NO. 23. Eco-friendly Candles Market Revenue, By Material, 2018, 2023, 2027 & 2032 ………………….72
FIG NO. 24. Global Eco-friendly Candles Market for Soy Wax, Volume & Revenue (Million Units) (USD
Million) 2018 – 2032…………………………………………………………………………………………………..73
FIG NO. 25. Global Eco-friendly Candles Market for Beeswax, Volume & Revenue (Million Units) (USD
Million) 2018 – 2032…………………………………………………………………………………………………..75
FIG NO. 26. Global Eco-friendly Candles Market for Coconut wax, Volume & Revenue (Million Units)
(USD Million) 2018 – 2032 …………………………………………………………………………………………..77
FIG NO. 27. Global Eco-friendly Candles Market for Plant-Based wax, Volume & Revenue (Million
Units) (USD Million) 2018 – 2032………………………………………………………………………………….79
FIG NO. 28. Eco-friendly Candles Market Volume Share, By Consumer Orientation, 2023 & 2032 ………..82
FIG NO. 29. Eco-friendly Candles Market Revenue Share, By Consumer Orientation, 2023 & 2032……….82
FIG NO. 30. Market Attractiveness Analysis, By Consumer Orientation ……………………………………………..83
FIG NO. 31. Incremental Revenue Growth Opportunity by Consumer Orientation, 2024 – 2032 …………..83
FIG NO. 32. Eco-friendly Candles Market Revenue, By Consumer Orientation, 2018, 2023, 2027 &
2032 ………………………………………………………………………………………………………………………..84
FIG NO. 33. Global Eco-friendly Candles Market for Men, Volume & Revenue (Million Units) (USD
Million) 2018 – 2032…………………………………………………………………………………………………..85
FIG NO. 34. Global Eco-friendly Candles Market for Women, Volume & Revenue (Million Units) (USD
Million) 2018 – 2032…………………………………………………………………………………………………..87
FIG NO. 35. Eco-friendly Candles Market Volume Share, By Distribution Channel, 2023 & 2032 …………..90
FIG NO. 36. Eco-friendly Candles Market Revenue Share, By Distribution Channel, 2023 & 2032………….90
FIG NO. 37. Market Attractiveness Analysis, By Distribution Channel………………………………………………..91
FIG NO. 38. Incremental Revenue Growth Opportunity by Distribution Channel, 2024 – 2032 ……………..91
FIG NO. 39. Eco-friendly Candles Market Revenue, By Distribution Channel, 2018, 2023, 2027 & 2032…92
FIG NO. 40. Global Eco-friendly Candles Market for Hypermarkets / Supermarkets, Volume &
Revenue (Million Units) (USD Million) 2018 – 2032 ………………………………………………………..93
FIG NO. 41. Global Eco-friendly Candles Market for Specialty Stores, Volume & Revenue (Million
Units) (USD Million) 2018 – 2032………………………………………………………………………………….96
FIG NO. 42. Global Eco-friendly Candles Market for Independent Departmental Stores, Volume &
Revenue (Million Units) (USD Million) 2018 – 2032 ………………………………………………………..99
FIG NO. 43. Global Eco-friendly Candles Market for Online Retailers, Volume & Revenue (Million
Units) (USD Million) 2018 – 2032………………………………………………………………………………..102
FIG NO. 44. Global Eco-friendly Candles Market for Others, Volume & Revenue (Million Units) (USD
Million) 2018 – 2032…………………………………………………………………………………………………105
FIG NO. 45. Global Eco-friendly Candles Market Volume Share, By Region, 2023 & 2032…………………..109
FIG NO. 46. Global Eco-friendly Candles Market Revenue Share, By Region, 2023 & 2032 …………………109
FIG NO. 47. Market Attractiveness Analysis, By Region………………………………………………………………….110
FIG NO. 48. Incremental Revenue Growth Opportunity by Region, 2024 – 2032 ……………………………….110
FIG NO. 49. Eco-friendly Candles Market Revenue, By Region, 2018, 2023, 2027 & 2032…………………..111
FIG NO. 50. North America Eco-friendly Candles Market Volume & Revenue, 2018 – 2032 (Million
Units) (USD Million)………………………………………………………………………………………………….121
FIG NO. 51. Europe Eco-friendly Candles Market Volume & Revenue, 2018 – 2032 (Million Units) (USD
Million)…………………………………………………………………………………………………………………..133
FIG NO. 52. Asia Pacific Eco-friendly Candles Market Volume & Revenue, 2018 – 2032 (Million Units)
(USD Million)…………………………………………………………………………………………………………..145
FIG NO. 53. Latin America Eco-friendly Candles Market Volume & Revenue, 2018 – 2032 (Million
Units) (USD Million)………………………………………………………………………………………………….157
FIG NO. 54. Middle East Eco-friendly Candles Market Volume & Revenue, 2018 – 2032 (Million Units)
(USD Million)…………………………………………………………………………………………………………..169
FIG NO. 55. Africa Eco-friendly Candles Market Volume & Revenue, 2018 – 2032 (Million Units) (USD
Million)…………………………………………………………………………………………………………………..181

List of Tables
TABLE NO. 1. : Global Eco-friendly Candles Market: Snapshot………………………………………………………………34
TABLE NO. 2. : Drivers for the Eco-friendly Candles Market: Impact Analysis………………………………………….40
TABLE NO. 3. : Restraints for the Eco-friendly Candles Market: Impact Analysis……………………………………..42
TABLE NO. 4. : Global Essential oils Eco-friendly Candles Market Volume & Revenue, By Region, 2018 –
2023 (Million Units) (USD Million) ……………………………………………………………………………….59
TABLE NO. 5. : Global Essential oils Eco-friendly Candles Market Volume & Revenue, By Region, 2024 –
2032 (Million Units) (USD Million) ……………………………………………………………………………….59
TABLE NO. 6. : Global Fragrance oils Eco-friendly Candles Market Volume & Revenue, By Region, 2018 –
2023 (Million Units) (USD Million) ……………………………………………………………………………….61
TABLE NO. 7. : Global Fragrance oils Eco-friendly Candles Market Volume & Revenue, By Region, 2024 –
2032 (Million Units) (USD Million) ……………………………………………………………………………….61
TABLE NO. 8. : Global Fragrance-Free Eco-friendly Candles Market Volume & Revenue, By Region, 2018 –
2023 (Million Units) (USD Million) ……………………………………………………………………………….63
TABLE NO. 9. : Global Fragrance-Free Eco-friendly Candles Market Volume & Revenue, By Region, 2024 –
2032 (Million Units) (USD Million) ……………………………………………………………………………….63
TABLE NO. 10. : Global Botanical Blends Eco-friendly Candles Market Volume & Revenue, By Region, 2018
– 2023 (Million Units) (USD Million) ……………………………………………………………………………..66
TABLE NO. 11. : Global Botanical Blends Eco-friendly Candles Market Volume & Revenue, By Region, 2024
– 2032 (Million Units) (USD Million) ……………………………………………………………………………..66
TABLE NO. 12. : Global Others Eco-friendly Candles Market Volume & Revenue, By Region, 2018 – 2023
(Million Units) (USD Million) ……………………………………………………………………………………….68
TABLE NO. 13. : Global Others Eco-friendly Candles Market Volume & Revenue, By Region, 2024 – 2032
(Million Units) (USD Million) ……………………………………………………………………………………….68
TABLE NO. 14. : Global Soy Wax Eco-friendly Candles Market Volume & Revenue, By Region, 2018 – 2023
(Million Units) (USD Million) ……………………………………………………………………………………….74
TABLE NO. 15. : Global Soy Wax Eco-friendly Candles Market Volume & Revenue, By Region, 2024 – 2032
(Million Units) (USD Million) ……………………………………………………………………………………….74
TABLE NO. 16. : Global Beeswax Eco-friendly Candles Market Volume & Revenue, By Region, 2018 – 2023
(Million Units) (USD Million) ……………………………………………………………………………………….76
TABLE NO. 17. : Global Beeswax Eco-friendly Candles Market Volume & Revenue, By Region, 2024 – 2032
(Million Units) (USD Million) ……………………………………………………………………………………….76
TABLE NO. 18. : Global Coconut wax Eco-friendly Candles Market Volume & Revenue, By Region, 2018 –
2023 (Million Units) (USD Million) ……………………………………………………………………………….78
TABLE NO. 19. : Global Coconut wax Eco-friendly Candles Market Volume & Revenue, By Region, 2024 –
2032 (Million Units) (USD Million) ……………………………………………………………………………….78
TABLE NO. 20. : Global Plant-Based wax Eco-friendly Candles Market Volume & Revenue, By Region, 2018
– 2023 (Million Units) (USD Million) ……………………………………………………………………………..80
TABLE NO. 21. : Global Plant-Based wax Eco-friendly Candles Market Volume & Revenue, By Region, 2024
– 2032 (Million Units) (USD Million) ……………………………………………………………………………..80
TABLE NO. 22. : Global Men Eco-friendly Candles Market Volume & Revenue, By Region, 2018 – 2023
(Million Units) (USD Million) ……………………………………………………………………………………….86
TABLE NO. 23. : Global Men Eco-friendly Candles Market Volume & Revenue, By Region, 2024 – 2032
(Million Units) (USD Million) ……………………………………………………………………………………….86
TABLE NO. 24. : Global Women Eco-friendly Candles Market Volume & Revenue, By Region, 2018 – 2023
(Million Units) (USD Million) ……………………………………………………………………………………….88
TABLE NO. 25. : Global Women Eco-friendly Candles Market Volume & Revenue, By Region, 2024 – 2032
(Million Units) (USD Million) ……………………………………………………………………………………….88
TABLE NO. 26. : Global Hypermarkets / Supermarkets Eco-friendly Candles Market Volume & Revenue, By
Region, 2018 – 2023 (Million Units) (USD Million) ………………………………………………………….94
TABLE NO. 27. : Global Hypermarkets / Supermarkets Eco-friendly Candles Market Volume & Revenue, By
Region, 2024 – 2032 (Million Units) (USD Million) ………………………………………………………….95
TABLE NO. 28. : Global Specialty Stores Eco-friendly Candles Market Volume & Revenue, By Region, 2018
– 2023 (Million Units) (USD Million) ……………………………………………………………………………..97
TABLE NO. 29. : Global Specialty Stores Eco-friendly Candles Market Volume & Revenue, By Region, 2024
– 2032 (Million Units) (USD Million) ……………………………………………………………………………..98
TABLE NO. 30. : Global Independent Departmental Stores Eco-friendly Candles Market Volume &
Revenue, By Region, 2018 – 2023 (Million Units) (USD Million) ……………………………………..100
TABLE NO. 31. : Global Independent Departmental Stores Eco-friendly Candles Market Volume &
Revenue, By Region, 2024 – 2032 (Million Units) (USD Million) ……………………………………..101
TABLE NO. 32. : Global Online Retailers Eco-friendly Candles Market Volume & Revenue, By Region, 2018
– 2023 (Million Units) (USD Million) ……………………………………………………………………………103
TABLE NO. 33. : Global Online Retailers Eco-friendly Candles Market Volume & Revenue, By Region, 2024
– 2032 (Million Units) (USD Million) ……………………………………………………………………………104
TABLE NO. 34. : Global Others Eco-friendly Candles Market Volume & Revenue, By Region, 2018 – 2023
(Million Units) (USD Million) ……………………………………………………………………………………..106
TABLE NO. 35. : Global Others Eco-friendly Candles Market Volume & Revenue, By Region, 2024 – 2032
(Million Units) (USD Million) ……………………………………………………………………………………..107
TABLE NO. 36. : Global Eco-friendly Candles Market Volume & Revenue, By Region, 2018 – 2023 (Million
Units) (USD Million)………………………………………………………………………………………………….112
TABLE NO. 37. : Global Eco-friendly Candles Market Volume & Revenue, By Region, 2024 – 2032 (Million
Units) (USD Million)………………………………………………………………………………………………….112
TABLE NO. 38. : Global Eco-friendly Candles Market Volume & Revenue, By Fragrance Type, 2018 – 2023
(Million Units) (USD Million) ……………………………………………………………………………………..113
TABLE NO. 39. : Global Eco-friendly Candles Market Volume & Revenue, By Fragrance Type, 2024 – 2032
(Million Units) (USD Million) ……………………………………………………………………………………..114
TABLE NO. 40. : Global Eco-friendly Candles Market Volume & Revenue, By Material, 2018 – 2023 (Million
Units) (USD Million)………………………………………………………………………………………………….115
TABLE NO. 41. : Global Eco-friendly Candles Market Volume & Revenue, By Material, 2024 – 2032 (Million
Units) (USD Million)………………………………………………………………………………………………….116
TABLE NO. 42. : Global Eco-friendly Candles Market Volume & Revenue, By Consumer Orientation, 2018 –
2023 (Million Units) (USD Million) ……………………………………………………………………………..117
TABLE NO. 43. : Global Eco-friendly Candles Market Volume & Revenue, By Consumer Orientation, 2024 –
2032 (Million Units) (USD Million) ……………………………………………………………………………..118
TABLE NO. 44. : Global Eco-friendly Candles Market Volume & Revenue, By Distribution Channel, 2018 –
2023 (Million Units) (USD Million) ……………………………………………………………………………..119
TABLE NO. 45. : Global Eco-friendly Candles Market Volume & Revenue, By Distribution Channel, 2024 –
2032 (Million Units) (USD Million) ……………………………………………………………………………..120
TABLE NO. 46. : North America Eco-friendly Candles Market Volume, By Country, 2018 – 2023 (Million
Units)……………………………………………………………………………………………………………………..122
TABLE NO. 47. : North America Eco-friendly Candles Market Volume, By Country, 2024 – 2032 (Million
Units)……………………………………………………………………………………………………………………..122
TABLE NO. 48. : North America Eco-friendly Candles Market Revenue, By Country, 2018 – 2023 (USD
Million)…………………………………………………………………………………………………………………..123
TABLE NO. 49. : North America Eco-friendly Candles Market Revenue, By Country, 2024 – 2032 (USD
Million)…………………………………………………………………………………………………………………..123
TABLE NO. 50. : North America Eco-friendly Candles Market Volume, By Fragrance Type, 2018 – 2023
(Million Units) …………………………………………………………………………………………………………124
TABLE NO. 51. : North America Eco-friendly Candles Market Volume, By Fragrance Type, 2024 – 2032
(Million Units) …………………………………………………………………………………………………………124
TABLE NO. 52. : North America Eco-friendly Candles Market Revenue, By Fragrance Type, 2018 – 2023
(USD Million)…………………………………………………………………………………………………………..125
TABLE NO. 53. : North America Eco-friendly Candles Market Revenue, By Fragrance Type, 2024 – 2032
(USD Million)…………………………………………………………………………………………………………..125
TABLE NO. 54. : North America Eco-friendly Candles Market Volume, By Material, 2018 – 2023 (Million
Units)……………………………………………………………………………………………………………………..126
TABLE NO. 55. : North America Eco-friendly Candles Market Volume, By Material, 2024 – 2032 (Million
Units)……………………………………………………………………………………………………………………..126
TABLE NO. 56. : North America Eco-friendly Candles Market Revenue, By Material, 2018 – 2023 (USD
Million)…………………………………………………………………………………………………………………..127
TABLE NO. 57. : North America Eco-friendly Candles Market Revenue, By Material, 2024 – 2032 (USD
Million)…………………………………………………………………………………………………………………..127
TABLE NO. 58. : North America Eco-friendly Candles Market Volume, By Consumer Orientation, 2018 –
2023 (Million Units) …………………………………………………………………………………………………128
TABLE NO. 59. : North America Eco-friendly Candles Market Volume, By Consumer Orientation, 2024 –
2032 (Million Units) …………………………………………………………………………………………………128
TABLE NO. 60. : North America Eco-friendly Candles Market Revenue, By Consumer Orientation, 2018 –
2023 (USD Million) …………………………………………………………………………………………………..129
TABLE NO. 61. : North America Eco-friendly Candles Market Revenue, By Consumer Orientation, 2024 –
2032 (USD Million) …………………………………………………………………………………………………..129
TABLE NO. 62. : North America Eco-friendly Candles Market Volume, By Distribution Channel, 2018 – 2023
(Million Units) …………………………………………………………………………………………………………130
TABLE NO. 63. : North America Eco-friendly Candles Market Volume, By Distribution Channel, 2024 – 2032
(Million Units) …………………………………………………………………………………………………………130
TABLE NO. 64. : North America Eco-friendly Candles Market Revenue, By Distribution Channel, 2018 –
2023 (USD Million) …………………………………………………………………………………………………..131
TABLE NO. 65. : North America Eco-friendly Candles Market Revenue, By Distribution Channel, 2024 –
2032 (USD Million) …………………………………………………………………………………………………..131
TABLE NO. 66. : Europe Eco-friendly Candles Market Volume, By Country, 2018 – 2023 (Million Units)……..134
TABLE NO. 67. : Europe Eco-friendly Candles Market Volume, By Country, 2024 – 2032 (Million Units)……..134
TABLE NO. 68. : Europe Eco-friendly Candles Market Revenue, By Country, 2018 – 2023 (USD Million)……..135
TABLE NO. 69. : Europe Eco-friendly Candles Market Revenue, By Country, 2024 – 2032 (USD Million)……..135
TABLE NO. 70. : Europe Eco-friendly Candles Market Volume, By Fragrance Type, 2018 – 2023 (Million
Units)……………………………………………………………………………………………………………………..136
TABLE NO. 71. : Europe Eco-friendly Candles Market Volume, By Fragrance Type, 2024 – 2032 (Million
Units)……………………………………………………………………………………………………………………..136
TABLE NO. 72. : Europe Eco-friendly Candles Market Revenue, By Fragrance Type, 2018 – 2023 (USD
Million)…………………………………………………………………………………………………………………..137
TABLE NO. 73. : Europe Eco-friendly Candles Market Revenue, By Fragrance Type, 2024 – 2032 (USD
Million)…………………………………………………………………………………………………………………..137
TABLE NO. 74. : Europe Eco-friendly Candles Market Volume, By Material, 2018 – 2023 (Million Units)…….138
TABLE NO. 75. : Europe Eco-friendly Candles Market Volume, By Material, 2024 – 2032 (Million Units)…….138
TABLE NO. 76. : Europe Eco-friendly Candles Market Revenue, By Material, 2018 – 2023 (USD Million)…….139
TABLE NO. 77. : Europe Eco-friendly Candles Market Revenue, By Material, 2024 – 2032 (USD Million)…….139
TABLE NO. 78. : Europe Eco-friendly Candles Market Volume, By Consumer Orientation, 2018 – 2023
(Million Units) …………………………………………………………………………………………………………140
TABLE NO. 79. : Europe Eco-friendly Candles Market Volume, By Consumer Orientation, 2024 – 2032
(Million Units) …………………………………………………………………………………………………………140
TABLE NO. 80. : Europe Eco-friendly Candles Market Revenue, By Consumer Orientation, 2018 – 2023
(USD Million)…………………………………………………………………………………………………………..141
TABLE NO. 81. : Europe Eco-friendly Candles Market Revenue, By Consumer Orientation, 2024 – 2032
(USD Million)…………………………………………………………………………………………………………..141
TABLE NO. 82. : Europe Eco-friendly Candles Market Volume, By Distribution Channel, 2018 – 2023
(Million Units) …………………………………………………………………………………………………………142
TABLE NO. 83. : Europe Eco-friendly Candles Market Volume, By Distribution Channel, 2024 – 2032
(Million Units) …………………………………………………………………………………………………………142
TABLE NO. 84. : Europe Eco-friendly Candles Market Revenue, By Distribution Channel, 2018 – 2023 (USD
Million)…………………………………………………………………………………………………………………..143
TABLE NO. 85. : Europe Eco-friendly Candles Market Revenue, By Distribution Channel, 2024 – 2032 (USD
Million)…………………………………………………………………………………………………………………..143
TABLE NO. 86. : Asia Pacific Eco-friendly Candles Market Volume, By Country, 2018 – 2023 (Million Units) .146
TABLE NO. 87. : Asia Pacific Eco-friendly Candles Market Volume, By Country, 2024 – 2032 (Million Units) .146
TABLE NO. 88. : Asia Pacific Eco-friendly Candles Market Revenue, By Country, 2018 – 2023 (USD Million) .147
TABLE NO. 89. : Asia Pacific Eco-friendly Candles Market Revenue, By Country, 2024 – 2032 (USD Million) .147
TABLE NO. 90. : Asia Pacific Eco-friendly Candles Market Volume, By Fragrance Type, 2018 – 2023 (Million
Units)……………………………………………………………………………………………………………………..148
TABLE NO. 91. : Asia Pacific Eco-friendly Candles Market Volume, By Fragrance Type, 2024 – 2032 (Million
Units)……………………………………………………………………………………………………………………..148
TABLE NO. 92. : Asia Pacific Eco-friendly Candles Market Revenue, By Fragrance Type, 2018 – 2023 (USD
Million)…………………………………………………………………………………………………………………..149
TABLE NO. 93. : Asia Pacific Eco-friendly Candles Market Revenue, By Fragrance Type, 2024 – 2032 (USD
Million)…………………………………………………………………………………………………………………..149
TABLE NO. 94. : Asia Pacific Eco-friendly Candles Market Volume, By Material, 2018 – 2023 (Million Units) 150
TABLE NO. 95. : Asia Pacific Eco-friendly Candles Market Volume, By Material, 2024 – 2032 (Million Units) 150
TABLE NO. 96. : Asia Pacific Eco-friendly Candles Market Revenue, By Material, 2018 – 2023 (USD Million).151
TABLE NO. 97. : Asia Pacific Eco-friendly Candles Market Revenue, By Material, 2024 – 2032 (USD Million).151
TABLE NO. 98. : Asia Pacific Eco-friendly Candles Market Volume, By Consumer Orientation, 2018 – 2023
(Million Units) …………………………………………………………………………………………………………152
TABLE NO. 99. : Asia Pacific Eco-friendly Candles Market Volume, By Consumer Orientation, 2024 – 2032
(Million Units) …………………………………………………………………………………………………………152
TABLE NO. 100. : Asia Pacific Eco-friendly Candles Market Revenue, By Consumer Orientation, 2018 – 2023
(USD Million)…………………………………………………………………………………………………………..153
TABLE NO. 101. : Asia Pacific Eco-friendly Candles Market Revenue, By Consumer Orientation, 2024 – 2032
(USD Million)…………………………………………………………………………………………………………..153
TABLE NO. 102. : Asia Pacific Eco-friendly Candles Market Volume, By Distribution Channel, 2018 – 2023
(Million Units) …………………………………………………………………………………………………………154
TABLE NO. 103. : Asia Pacific Eco-friendly Candles Market Volume, By Distribution Channel, 2024 – 2032
(Million Units) …………………………………………………………………………………………………………154
TABLE NO. 104. : Asia Pacific Eco-friendly Candles Market Revenue, By Distribution Channel, 2018 – 2023
(USD Million)…………………………………………………………………………………………………………..155
TABLE NO. 105. : Asia Pacific Eco-friendly Candles Market Revenue, By Distribution Channel, 2024 – 2032
(USD Million)…………………………………………………………………………………………………………..155
TABLE NO. 106. : Latin America Eco-friendly Candles Market Volume, By Country, 2018 – 2023 (Million
Units)……………………………………………………………………………………………………………………..158
TABLE NO. 107. : Latin America Eco-friendly Candles Market Volume, By Country, 2024 – 2032 (Million
Units)……………………………………………………………………………………………………………………..158
TABLE NO. 108. : Latin America Eco-friendly Candles Market Revenue, By Country, 2018 – 2023 (USD
Million)…………………………………………………………………………………………………………………..159
TABLE NO. 109. : Latin America Eco-friendly Candles Market Revenue, By Country, 2024 – 2032 (USD
Million)…………………………………………………………………………………………………………………..159
TABLE NO. 110. : Latin America Eco-friendly Candles Market Volume, By Fragrance Type, 2018 – 2023
(Million Units) …………………………………………………………………………………………………………160
TABLE NO. 111. : Latin America Eco-friendly Candles Market Volume, By Fragrance Type, 2024 – 2032
(Million Units) …………………………………………………………………………………………………………160
TABLE NO. 112. : Latin America Eco-friendly Candles Market Revenue, By Fragrance Type, 2018 – 2023
(USD Million)…………………………………………………………………………………………………………..161
TABLE NO. 113. : Latin America Eco-friendly Candles Market Revenue, By Fragrance Type, 2024 – 2032
(USD Million)…………………………………………………………………………………………………………..161
TABLE NO. 114. : Latin America Eco-friendly Candles Market Volume, By Material, 2018 – 2023 (Million
Units)……………………………………………………………………………………………………………………..162
TABLE NO. 115. : Latin America Eco-friendly Candles Market Volume, By Material, 2024 – 2032 (Million
Units)……………………………………………………………………………………………………………………..162
TABLE NO. 116. : Latin America Eco-friendly Candles Market Revenue, By Material, 2018 – 2023 (USD
Million)…………………………………………………………………………………………………………………..163
TABLE NO. 117. : Latin America Eco-friendly Candles Market Revenue, By Material, 2024 – 2032 (USD
Million)…………………………………………………………………………………………………………………..163
TABLE NO. 118. : Latin America Eco-friendly Candles Market Volume, By Consumer Orientation, 2018 –
2023 (Million Units) …………………………………………………………………………………………………164
TABLE NO. 119. : Latin America Eco-friendly Candles Market Volume, By Consumer Orientation, 2024 –
2032 (Million Units) …………………………………………………………………………………………………164
TABLE NO. 120. : Latin America Eco-friendly Candles Market Revenue, By Consumer Orientation, 2018 –
2023 (USD Million) …………………………………………………………………………………………………..165
TABLE NO. 121. : Latin America Eco-friendly Candles Market Revenue, By Consumer Orientation, 2024 –
2032 (USD Million) …………………………………………………………………………………………………..165
TABLE NO. 122. : Latin America Eco-friendly Candles Market Volume, By Distribution Channel, 2018 – 2023
(Million Units) …………………………………………………………………………………………………………166
TABLE NO. 123. : Latin America Eco-friendly Candles Market Volume, By Distribution Channel, 2024 – 2032
(Million Units) …………………………………………………………………………………………………………166
TABLE NO. 124. : Latin America Eco-friendly Candles Market Revenue, By Distribution Channel, 2018 – 2023
(USD Million)…………………………………………………………………………………………………………..167
TABLE NO. 125. : Latin America Eco-friendly Candles Market Revenue, By Distribution Channel, 2024 – 2032
(USD Million)…………………………………………………………………………………………………………..167
TABLE NO. 126. : Middle East Eco-friendly Candles Market Volume, By Country, 2018 – 2023 (Million Units) 170
TABLE NO. 127. : Middle East Eco-friendly Candles Market Volume, By Country, 2024 – 2032 (Million Units) 170
TABLE NO. 128. : Middle East Eco-friendly Candles Market Revenue, By Country, 2018 – 2023 (USD Million) 171
TABLE NO. 129. : Middle East Eco-friendly Candles Market Revenue, By Country, 2024 – 2032 (USD Million) 171
TABLE NO. 130. : Middle East Eco-friendly Candles Market Volume, By Fragrance Type, 2018 – 2023 (Million
Units)……………………………………………………………………………………………………………………..172
TABLE NO. 131. : Middle East Eco-friendly Candles Market Volume, By Fragrance Type, 2024 – 2032 (Million
Units)……………………………………………………………………………………………………………………..172
TABLE NO. 132. : Middle East Eco-friendly Candles Market Revenue, By Fragrance Type, 2018 – 2023 (USD
Million)…………………………………………………………………………………………………………………..173
TABLE NO. 133. : Middle East Eco-friendly Candles Market Revenue, By Fragrance Type, 2024 – 2032 (USD
Million)…………………………………………………………………………………………………………………..173
TABLE NO. 134. : Middle East Eco-friendly Candles Market Volume, By Material, 2018 – 2023 (Million Units)174
TABLE NO. 135. : Middle East Eco-friendly Candles Market Volume, By Material, 2024 – 2032 (Million Units)174
TABLE NO. 136. : Middle East Eco-friendly Candles Market Revenue, By Material, 2018 – 2023 (USD Million)175
TABLE NO. 137. : Middle East Eco-friendly Candles Market Revenue, By Material, 2024 – 2032 (USD Million)175
TABLE NO. 138. : Middle East Eco-friendly Candles Market Volume, By Consumer Orientation, 2018 – 2023
(Million Units) …………………………………………………………………………………………………………176
TABLE NO. 139. : Middle East Eco-friendly Candles Market Volume, By Consumer Orientation, 2024 – 2032
(Million Units) …………………………………………………………………………………………………………176
TABLE NO. 140. : Middle East Eco-friendly Candles Market Revenue, By Consumer Orientation, 2018 – 2023
(USD Million)…………………………………………………………………………………………………………..177
TABLE NO. 141. : Middle East Eco-friendly Candles Market Revenue, By Consumer Orientation, 2024 – 2032
(USD Million)…………………………………………………………………………………………………………..177
TABLE NO. 142. : Middle East Eco-friendly Candles Market Volume, By Distribution Channel, 2018 – 2023
(Million Units) …………………………………………………………………………………………………………178
TABLE NO. 143. : Middle East Eco-friendly Candles Market Volume, By Distribution Channel, 2024 – 2032
(Million Units) …………………………………………………………………………………………………………178
TABLE NO. 144. : Middle East Eco-friendly Candles Market Revenue, By Distribution Channel, 2018 – 2023
(USD Million)…………………………………………………………………………………………………………..179
TABLE NO. 145. : Middle East Eco-friendly Candles Market Revenue, By Distribution Channel, 2024 – 2032
(USD Million)…………………………………………………………………………………………………………..179
TABLE NO. 146. : Africa Eco-friendly Candles Market Volume, By Country, 2018 – 2023 (Million Units)……….182
30 | P a g e
GLOBAL ECO-FRIENDLY CANDLES MARKET, 2018 – 2032
TABLE NO. 147. : Africa Eco-friendly Candles Market Volume, By Country, 2024 – 2032 (Million Units)……….182
TABLE NO. 148. : Africa Eco-friendly Candles Market Revenue, By Country, 2018 – 2023 (USD Million)……….183
TABLE NO. 149. : Africa Eco-friendly Candles Market Revenue, By Country, 2024 – 2032 (USD Million)……….183
TABLE NO. 150. : Africa Eco-friendly Candles Market Volume, By Fragrance Type, 2018 – 2023 (Million
Units)……………………………………………………………………………………………………………………..184
TABLE NO. 151. : Africa Eco-friendly Candles Market Volume, By Fragrance Type, 2024 – 2032 (Million
Units)……………………………………………………………………………………………………………………..184
TABLE NO. 152. : Africa Eco-friendly Candles Market Revenue, By Fragrance Type, 2018 – 2023 (USD
Million)…………………………………………………………………………………………………………………..185
TABLE NO. 153. : Africa Eco-friendly Candles Market Revenue, By Fragrance Type, 2024 – 2032 (USD
Million)…………………………………………………………………………………………………………………..185
TABLE NO. 154. : Africa Eco-friendly Candles Market Volume, By Material, 2018 – 2023 (Million Units)………186
TABLE NO. 155. : Africa Eco-friendly Candles Market Volume, By Material, 2024 – 2032 (Million Units)………186
TABLE NO. 156. : Africa Eco-friendly Candles Market Revenue, By Material, 2018 – 2023 (USD Million)………187
TABLE NO. 157. : Africa Eco-friendly Candles Market Revenue, By Material, 2024 – 2032 (USD Million)………187
TABLE NO. 158. : Africa Eco-friendly Candles Market Volume, By Consumer Orientation, 2018 – 2023
(Million Units) …………………………………………………………………………………………………………188
TABLE NO. 159. : Africa Eco-friendly Candles Market Volume, By Consumer Orientation, 2024 – 2032
(Million Units) …………………………………………………………………………………………………………188
TABLE NO. 160. : Africa Eco-friendly Candles Market Revenue, By Consumer Orientation, 2018 – 2023 (USD
Million)…………………………………………………………………………………………………………………..189
TABLE NO. 161. : Africa Eco-friendly Candles Market Revenue, By Consumer Orientation, 2024 – 2032 (USD
Million)…………………………………………………………………………………………………………………..189
TABLE NO. 162. : Africa Eco-friendly Candles Market Volume, By Distribution Channel, 2018 – 2023 (Million
Units)……………………………………………………………………………………………………………………..190
TABLE NO. 163. : Africa Eco-friendly Candles Market Volume, By Distribution Channel, 2024 – 2032 (Million
Units)……………………………………………………………………………………………………………………..190
TABLE NO. 164. : Africa Eco-friendly Candles Market Revenue, By Distribution Channel, 2018 – 2023 (USD
Million)…………………………………………………………………………………………………………………..191
TABLE NO. 165. : Africa Eco-friendly Candles Market Revenue, By Distribution Channel, 2024 – 2032 (USD
Million)…………………………………………………………………………………………………………………..191

Frequently Asked Questions:

What is the current size of the Eco-friendly Candle market?

The market is projected to grow from USD 380.6 million in 2024 to USD 653.94 million by 2032, at a CAGR of 7%.

What factors are driving the growth of the Eco-friendly Candle market?

Growth is driven by increasing consumer demand for sustainable, non-toxic products, growing environmental awareness, the rise of wellness and aromatherapy trends, and the popularity of online retail platforms.

What are the key segments within the Eco-friendly Candle market?

Key segments include Material (Soy Wax, Beeswax, Coconut Wax, Plant-Based Wax), Fragrance Type (Essential Oils, Fragrance Oils, Fragrance-Free, Botanical Blends), and Distribution Channels (Hypermarkets/Supermarkets, Specialty Stores, Online Retailers).

What are some challenges faced by the Eco-friendly Candle market?

Challenges include high production costs due to premium natural ingredients, competition from traditional candles, limited consumer awareness about eco-friendly options, and quality control issues related to natural materials.

Who are the major players in the Eco-friendly Candle market?

Major players include P.F. Candle Co., Brooklyn Candle Studio, GoodLight Natural Candles, Prosperity Candle, Mrs. Meyer’s Clean Day, Eco Candle Co., and Big Dipper Wax Works.

Eco-friendly Furniture Market

Published:
Report ID: 37489

Eco-Friendly Paper Plates Market

Published:
Report ID: 80808

Eco-friendly Tea Packaging Market

Published:
Report ID: 73253

Water-Based Ink Binder Market

Published:
Report ID: 99569

Glycine Soja (Soybean) Seed Extract Market

Published:
Report ID: 99537

Vitrified Clay Pipes Market

Published:
Report ID: 99514

Urban Farming Market

Published:
Report ID: 99501

Tape Measures Market

Published:
Report ID: 99498

Metallic Powder Coatings Market

Published:
Report ID: 99440

Glycine Soja (Soybean) Seed Extract Market

Published:
Report ID: 99537

Glycine Market

Published:
Report ID: 99532

Tape Measures Market

Published:
Report ID: 99498

Rice Crackers Market

Published:
Report ID: 99494

Mold Remediation Service Market

Published:
Report ID: 99476

Bladeless Fans Market

Published:
Report ID: 99276

Bicycle Helmet Market

Published:
Report ID: 99252

Soil Amendment Market

Published:
Report ID: 99195

Shotgun Shell Market

Published:
Report ID: 99191

Organic Food Products Market

Published:
Report ID: 99175

NPK Fertilizers Market

Published:
Report ID: 99170

Mold Release Agents Market

Published:
Report ID: 99156

Purchase Options

The report comes as a view-only PDF document, optimized for individual clients. This version is recommended for personal digital use and does not allow printing.
$4699

To meet the needs of modern corporate teams, our report comes in two formats: a printable PDF and a data-rich Excel sheet. This package is optimized for internal analysis and multi-location access, making it an excellent choice for organizations with distributed workforce.
$5699

The report will be delivered in printable PDF format along with the report’s data Excel sheet. This license offers 100 Free Analyst hours where the client can utilize Credence Research Inc.’s research team. It is highly recommended for organizations seeking to execute short, customized research projects related to the scope of the purchased report.
$12699

Credence Staff 3

MIKE, North America

Support Staff at Credence Research

KEITH PHILLIPS, Europe

Lee - CR Sales Staff

LEE VALLANCE, Asia Pacific

Smallform of Sample request

Report delivery within 24 to 48 hours

– Other Info –

What people say?-

User Review

I am very impressed with the information in this report. The author clearly did their research when they came up with this product and it has already given me a lot of ideas.

Jana Schmidt
CEDAR CX Technologies

– Connect with us –

Phone

+91 6232 49 3207


support

24/7 Research Support


sales@credenceresearch.com

– Research Methodology –

Going beyond the basics: advanced techniques in research methodology

– Trusted By –

Pepshi, LG, Nestle
Motorola, Honeywell, Johnson and johnson
LG Chem, SIEMENS, Pfizer
Unilever, Samsonite, QIAGEN

Request Sample