| REPORT ATTRIBUTE |
DETAILS |
| Historical Period |
2020-2023 |
| Base Year |
2024 |
| Forecast Period |
2025-2032 |
| Edutainment Market Size 2024 |
USD 1,729.81 million |
| Edutainment Market,CAGR |
15.90% |
| Edutainment Market Size 2032 |
USD 5,632.03 million |
Market Overview
The global edutainment market is projected to grow from USD 1,729.81 million in 2024 to an estimated USD 5,632.03 million by 2032, reflecting a compound annual growth rate (CAGR) of 15.90% from 2025 to 2032. This growth is driven by the increasing integration of educational content with entertainment across various platforms, enhancing learning experiences and engagement.
Key drivers of this market include technological advancements, such as the proliferation of smartphones and high-speed internet, which facilitate the delivery of edutainment content. Additionally, the growing demand for interactive and gamified learning solutions among students and professionals contributes to market expansion. Trends such as personalized learning experiences and the adoption of augmented and virtual reality in educational content further fuel market growth.
Geographically, North America holds a significant share of the edutainment market, owing to substantial investments in educational technology and a high adoption rate of digital learning solutions. However, the Asia-Pacific region is anticipated to exhibit the highest growth rate during the forecast period, driven by rapid urbanization, increasing internet penetration, and a large young population seeking innovative learning methods. Key players in the market include The Walt Disney Company, Nickelodeon, LeapFrog Enterprises, and Pearson Education, among others, who are actively developing and offering edutainment products and services to cater to the evolving needs of learners globally.
Market Insights
- The global edutainment market is projected to grow from USD 1,729.81 million in 2024 to USD 5,632.03 million by 2032, registering a CAGR of 15.90% from 2025 to 2032.
- The market is driven by the increasing demand for immersive and interactive learning experiences that blend education with entertainment.
- Advancements in AR, VR, and AI are revolutionizing content delivery, making learning more personalized, engaging, and accessible.
- The proliferation of smartphones and high-speed internet enables wider access to edutainment platforms, especially in developing regions.
- High development costs and limited infrastructure in low-income regions pose challenges to market expansion and scalability.
- North America leads the market due to strong investments in educational technology and early adoption of digital learning platforms.
- Asia-Pacific is expected to grow rapidly, fueled by urbanization, a large young population, and increasing internet penetration.
Market Drivers
Rising Demand for E-learning and Online Education
The global shift toward online learning, further accelerated by the COVID-19 pandemic, has played a significant role in the growth of the edutainment market. With educational institutions worldwide adopting e-learning platforms, there has been an increased demand for digital content that combines learning with entertainment. Online learning, whether through web-based courses, virtual classrooms, or mobile applications, offers flexibility and convenience, making it an attractive option for both students and educators.Edutainment, which often relies on multimedia content such as videos, games, and interactive simulations, is particularly suited for online learning environments. Its ability to blend entertainment with education makes learning more enjoyable and accessible for students of all ages. The integration of edutainment into e-learning platforms is enabling a diverse range of content, from STEM-focused games to language-learning apps, to be available on a global scale. As e-learning continues to grow in popularity, the demand for edutainment solutions that enhance the online learning experience is expected to increase, propelling the market forward.
Government Initiatives and Investments in Education
Governments around the world are increasingly investing in the development of innovative educational tools, recognizing the importance of modernizing education to meet the needs of the digital age. Many governments have implemented initiatives to encourage the adoption of digital learning solutions, including edutainment, in schools and universities. These initiatives often include funding for the creation of digital content, teacher training on edutainment tools, and initiatives aimed at reducing the digital divide by improving access to technology.In addition to national efforts, international organizations and educational institutions are also supporting the integration of edutainment into formal education systems. Programs aimed at enhancing STEM (science, technology, engineering, and mathematics) education, promoting digital literacy, and addressing educational gaps in remote and underserved regions have contributed to the adoption of edutainment solutions. As governments continue to prioritize education as a key area of development, the market for edutainment is expected to receive sustained support, ensuring its continued growth and integration into global education systems.
Technological Advancements and Digitalization
The global edutainment market has been significantly influenced by rapid technological advancements and the increasing adoption of digital platforms. Surveys indicate that the proliferation of smartphones, tablets, and computers has made educational content more accessible, particularly in emerging markets where internet penetration continues to expand. This shift has enabled the integration of entertainment elements, such as interactive games and simulations, into traditional learning models, creating a dynamic and engaging educational experience. Industry reports highlight that online platforms leveraging augmented reality (AR) and virtual reality (VR) are becoming central to delivering immersive learning experiences. These technologies allow students to engage in real-time scenarios, fostering deeper understanding and retention.Artificial intelligence (AI) and machine learning (ML) have also emerged as transformative forces in this sector. Data from industry surveys suggest that AI-driven tools are increasingly being used to offer personalized learning experiences tailored to individual student needs. This customization enhances both engagement and effectiveness, making edutainment tools indispensable in modern education. The continuous evolution of these technologies is expected to further drive innovation in the edutainment market, offering new opportunities for providers to meet the demands o tech-savvy learners globally.
Changing Preferences of Learners and Parents
Consumer surveys reveal a growing preference for interactive and gamified learning solutions among both learners and parents. Traditional teaching methods often fail to fully engage students, particularly younger ones, prompting a shift toward edutainment platforms that combine education with entertainment. Gamification strategies—incorporating elements like challenges and rewards—have been shown to boost motivation and engagement, especially in K-12 education. Reports suggest that parents increasingly value tools that foster critical thinking, creativity, and problem-solving skills while keeping learning enjoyable. Parental attitudes toward technology integration in education are also evolving. For instance, a large proportion of parents now support the use of digital tools in schools, recognizing their potential to enhance learning outcomes. Many parents also perceive educational games and apps as effective supplements to traditional schooling, aligning with their desire for innovative methods to improve academic performance. Additionally, the emphasis on life skills development through edutainment products has gained traction among families seeking holistic educational solutions. This trend underscores the rising demand for engaging and versatile learning experiences that cater to diverse learner needs while sustaining market growth.
Market Trends
Rise of Artificial Intelligence (AI) in Personalized Learning
The role of Artificial Intelligence (AI) in edutainment is another key trend shaping the market. AI-driven technologies are enabling personalized learning experiences by adapting educational content to meet the unique needs, preferences, and learning styles of individual students. This is particularly beneficial for students with diverse learning paces, backgrounds, and levels of understanding, ensuring that every learner receives tailored instruction.AI-powered platforms and applications are capable of analyzing user interactions, identifying knowledge gaps, and adjusting content to provide targeted feedback and recommendations. For example, AI can adapt quizzes and lessons in real-time, offering students more challenging tasks as they progress or revisiting foundational concepts as needed. This personalization enhances learning outcomes by making education more relevant and engaging. Additionally, AI can facilitate automation in administrative tasks, freeing up more time for instructors to focus on teaching. As AI technology continues to advance, its integration into edutainment products is expected to grow, driving further innovation in the market.
Growth of Mobile and On-Demand Learning Solutions
Mobile learning has emerged as a dominant trend in the edutainment market, reflecting broader shifts in how people access education. With smartphones and tablets becoming increasingly ubiquitous, learners now have the flexibility to engage with educational content anytime and anywhere. Mobile learning apps that offer interactive lessons, educational games, and on-demand content are gaining popularity due to their accessibility, convenience, and user-friendly interfaces.The popularity of on-demand learning solutions also aligns with the growing demand for flexibility in education. Learners are seeking platforms that allow them to learn at their own pace, revisit lessons, and choose topics that interest them. This flexibility is particularly attractive for adult learners, professionals, and those in remote or underserved areas who may have limited access to traditional educational institutions. Mobile learning platforms provide an engaging way to deliver edutainment content, from language learning apps to STEM-based games, and are poised to continue driving growth in the global edutainment market. The trend toward mobile and on-demand learning also reflects the broader digitalization of education, making learning more accessible and personalized than ever before.
Integration of Augmented Reality (AR) and Virtual Reality (VR)
One of the most notable trends in the global edutainment market is the increasing use of Augmented Reality (AR) and Virtual Reality (VR) technologies to enhance the learning experience. These immersive technologies are transforming how educational content is delivered by providing interactive and engaging experiences for learners. AR and VR allow students to experience simulations and visualizations that bring abstract concepts to life, making complex subjects such as physics, history, and biology more understandable and interesting. For instance, VR enables users to explore virtual worlds, participate in real-world scenarios, and practice skills in a risk-free environment. In edutainment, this is particularly useful for subjects like medical training, engineering, and art history, where hands-on experience can be challenging or impossible. AR, on the other hand, overlays digital information on the real world, which can be used to provide contextual learning in real-time. For example, AR has been effectively used in classrooms to enhance STEM education through interactive 3D models. This combination of virtual and augmented experiences makes learning both fun and educational, resulting in better student engagement and knowledge retention. The growing adoption of AR and VR in edutainment products reflects a broader trend toward immersive learning tools that are being embraced by academic institutions worldwide.
Gamification and Game-Based Learning
Gamification continues to be one of the most dominant trends in the edutainment market. This approach integrates game mechanics and dynamics—such as points, rewards, challenges, and leaderboards—into the educational process to boost student engagement, motivation, and retention. Game-based learning has proven to be highly effective, especially in K-12 education, by making learning interactive and fun. Learning through games offers a unique opportunity for students to develop problem-solving skills, critical thinking, and creativity while engaging in friendly competition or collaboration with peers. For instance, gamified platforms have been shown to significantly improve memory retention and engagement levels among students. Moreover, many game-based learning platforms allow for personalized learning experiences where students can progress at their own pace. This adaptability has been particularly impactful in higher education institutions adopting gamified tools for subjects like computer science or mathematics. The integration of gamification into educational apps and e-learning platforms has also been supported by government initiatives aimed at fostering digital education globally. As a result, gamification is not only enhancing the appeal of edutainment among younger audiences but also driving its adoption across diverse educational settings.
Market Challenges
Lack of Standardization and Content Fragmentation
The edutainment market is fragmented with a lack of universal standards, which complicates content integration and compatibility across different platforms and devices. There is no single unified approach to how edutainment content should be designed, developed, or delivered, leading to a variety of solutions that may not be compatible with each other. This lack of standardization can create challenges for educators and learners who seek consistency and ease of use across different tools and platforms. Furthermore, the sheer volume of content available in the market can lead to fragmentation, where content providers may focus on niche topics or platforms, leaving gaps in comprehensive, holistic educational solutions. As a result, end-users may face difficulties in selecting appropriate resources that align with educational standards or curricular needs, thereby limiting the broader adoption of edutainment solutions. These challenges hinder the seamless delivery of high-quality, effective learning experiences on a global scale.
High Development and Implementation Costs
High Development and Implementation Costs remain a critical hurdle in the edutainment market, particularly due to the financial and technical demands of integrating cutting-edge technologies like Augmented Reality (AR), Virtual Reality (VR), and Artificial Intelligence (AI). These technologies, while transformative for learning experiences, require substantial investments in development, skilled talent, and advanced infrastructure. For instance, surveys have highlighted that creating high-quality educational apps or platforms involves considerable costs associated with features such as gamification, personalized learning paths, and immersive 3D simulations. These complexities necessitate specialized software and hardware, driving up production expenses. Moreover, the implementation process often faces delays due to integration challenges, increasing overall costs for companies. Studies have shown that extended deployment timelines not only inflate budgets but also hinder innovation and scalability. Smaller firms, especially in emerging markets, struggle to compete with established players who can absorb these costs more effectively. Additionally, the reliance on high-speed internet and sophisticated devices limits accessibility for many users in less developed regions. This digital divide further exacerbates the scalability issues of edutainment solutions. Despite these challenges, companies are exploring partnerships with educational institutions and tech firms to share resources and reduce costs, aiming to make these advanced learning tools more accessible globally.
Market Opportunities
Expansion of E-learning and Remote Education Solutions
The growing shift towards e-learning and remote education presents a significant opportunity for the global edutainment market. With the increasing adoption of online education, particularly post-pandemic, the demand for digital learning solutions is at an all-time high. Edutainment, which combines education with entertainment, is an ideal solution for engaging students in virtual classrooms and remote learning environments. As educational institutions, corporates, and even parents seek innovative ways to enhance learning experiences, edutainment tools such as interactive games, virtual lessons, and multimedia resources offer an opportunity to improve engagement and knowledge retention. This expanding shift towards remote education creates a vast market for companies that develop edutainment products to support digital learning across all age groups, including children, teenagers, and adults seeking to develop new skills.
Growing Demand for Personalized and Gamified Learning Experiences
Another significant opportunity for the edutainment market lies in the rising demand for personalized, gamified learning experiences. As educational institutions and learners seek more tailored approaches to learning, the integration of Artificial Intelligence (AI) and machine learning into edutainment solutions is becoming a key differentiator. Personalized learning experiences, where content adapts to the individual learner’s pace and preferences, can significantly improve learning outcomes. Additionally, the gamification of educational content is gaining traction, especially among younger audiences, as it increases engagement and motivation. By offering a combination of personalized education and entertaining, game-based learning, companies in the edutainment sector can cater to diverse learning needs and expand their customer base, opening up new revenue streams. This demand for customized and interactive learning solutions is expected to drive market growth in the coming years.
Market Segmentation Analysis
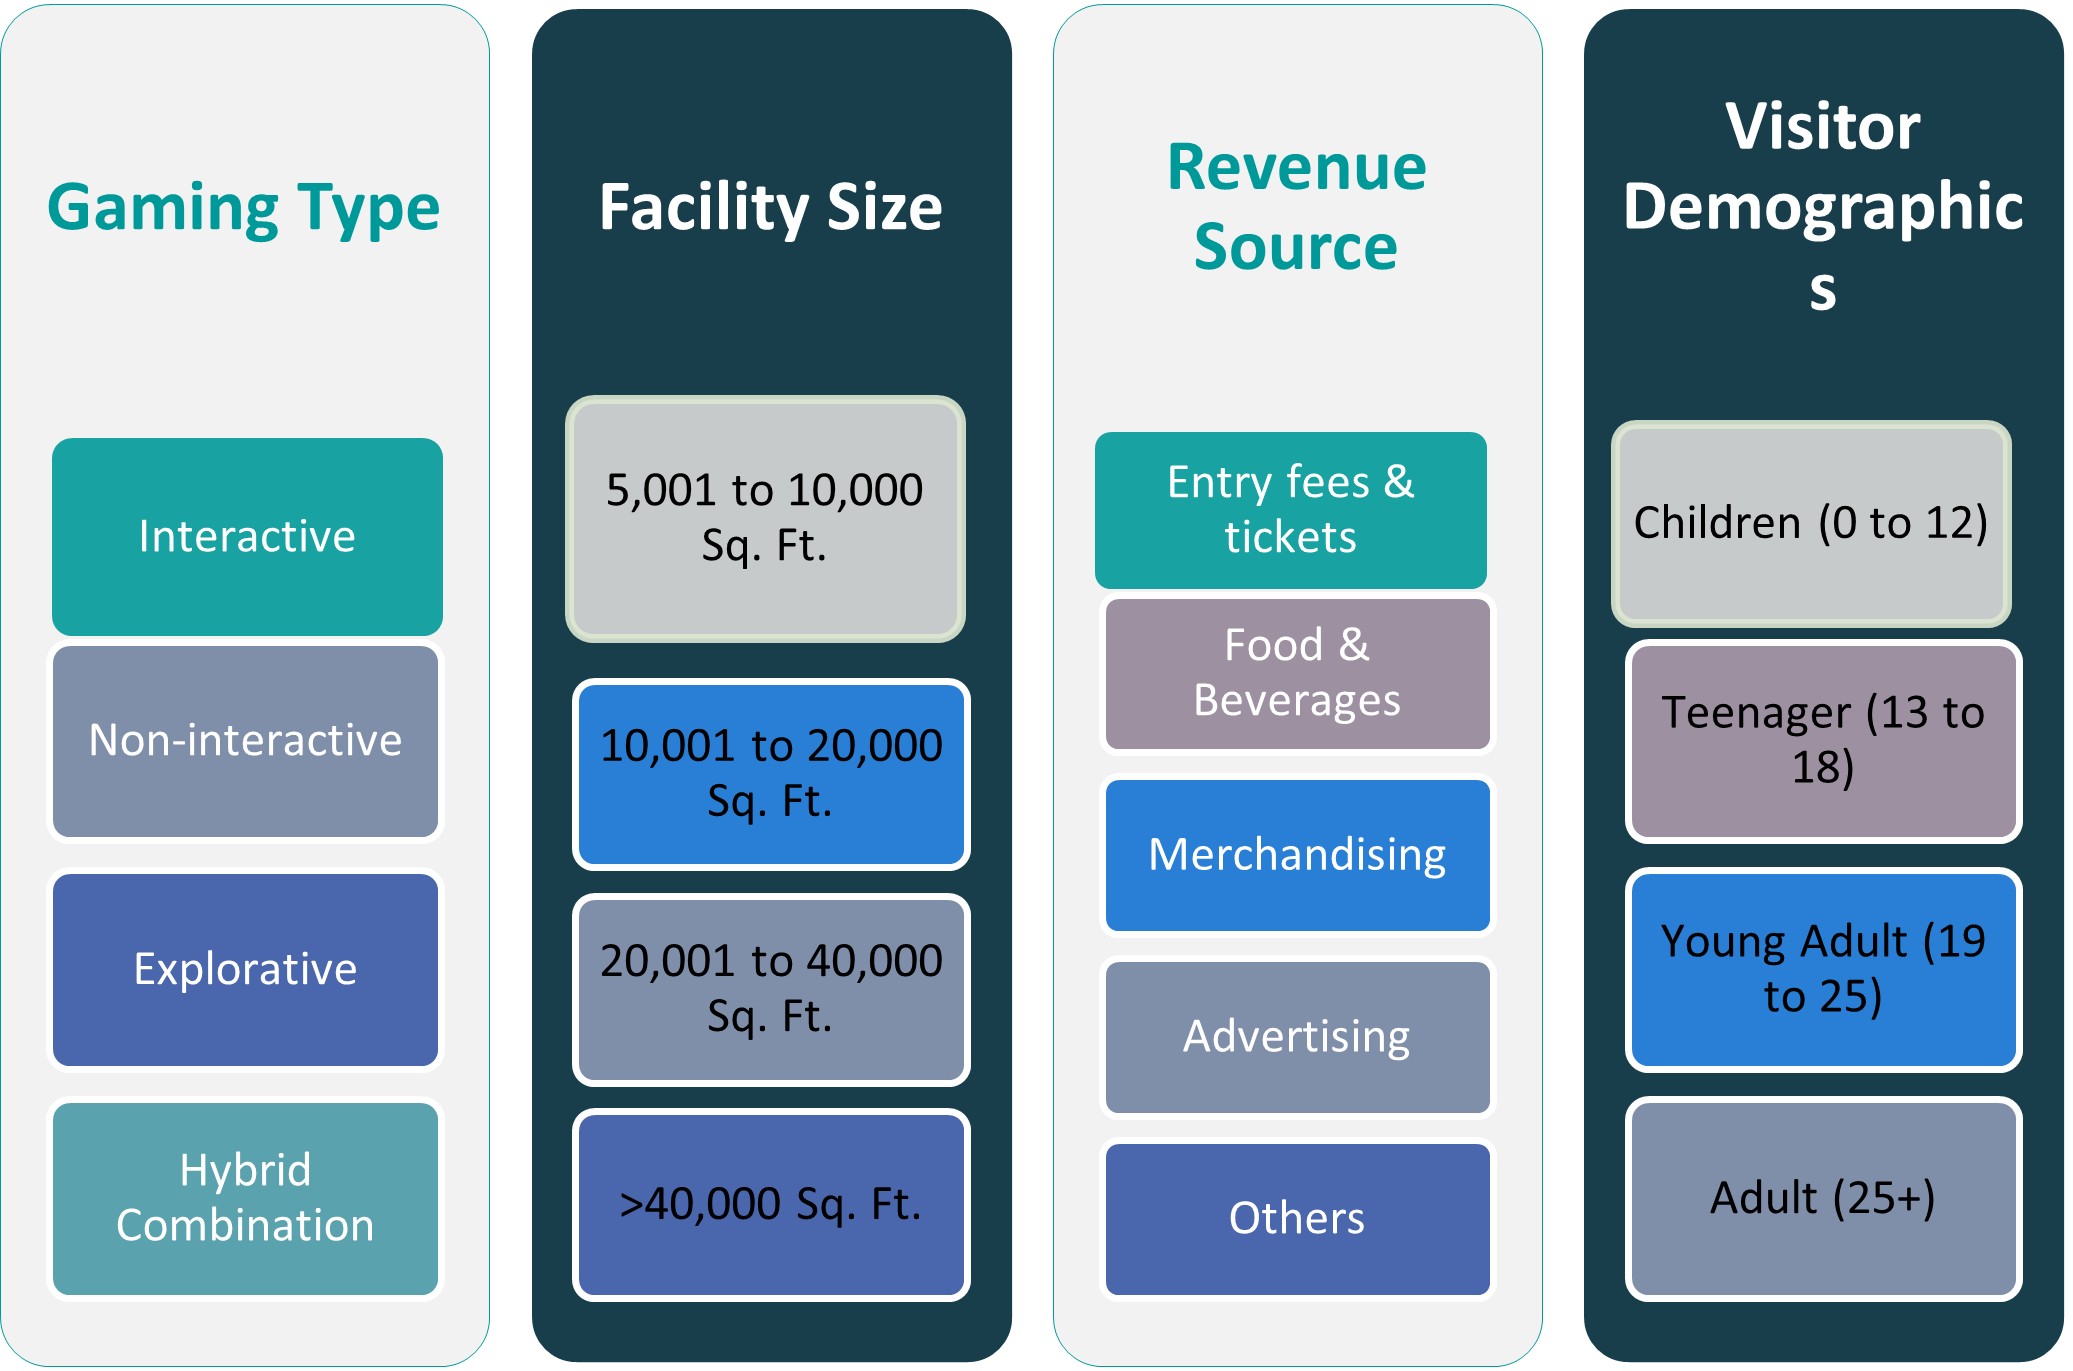
By Gaming Type
The market is categorized into interactive, non-interactive, explorative, and hybrid combination formats. Among these, interactive edutainment holds a substantial market share due to its ability to engage users through active participation, particularly in educational games and simulations. Explorative and hybrid combination games are also gaining popularity as they offer a blend of immersive storytelling and problem-solving, appealing to older children and young adults. Non-interactive formats, though less engaging, still serve educational purposes in museum exhibits and digital content.
By Facility Size
Edutainment centers are classified based on square footage: 5,001 to 10,000 sq. ft., 10,001 to 20,000 sq. ft., 20,001 to 40,000 sq. ft., and more than 40,000 sq. ft. Facilities ranging from 10,001 to 20,000 sq. ft. dominate the market due to their cost-efficiency and ability to offer diverse attractions within manageable space. Larger centers (over 40,000 sq. ft.) are typically found in urban or tourist-heavy regions and focus on large-scale experiences, such as VR parks or science discovery zones.
Segments
Based on Gaming Type
- Interactive
- Non-interactive
- Explorative
- Hybrid Combination
Based on Facility Size
- 5,001 to 10,000 Sq. Ft.
- 10,001 to 20,000 Sq. Ft.
- 20,001 to 40,000 Sq. Ft.
- >40,000 Sq. Ft.
Based on Revenue Source
- Entry fees & tickets
- Food & Beverages
- Merchandising
- Advertising
- Others
Based on Visitor Demographics
- Children (0 to 12)
- Teenager (13 to 18)
- Young Adult (19 to 25)
- Adult (25+)
Based on Region
- North America
- S.
- Canada
- Mexico
- Europe
- Germany
- France
- K.
- Italy
- Spain
- Rest of Europe
- Asia Pacific
- China
- Japan
- India
- South Korea
- South-east Asia
- Rest of Asia Pacific
- Latin America
- Brazil
- Argentina
- Rest of Latin America
- Middle East & Africa
- GCC Countries
- South Africa
- Rest of the Middle East and Africa
Regional Analysis
North America (34.5%)
North America holds the largest share of the global edutainment market, accounting for 34.5% of the total market value. This dominance is attributed to the region’s advanced technological infrastructure, widespread internet access, and high investment in educational technologies. The United States leads the regional market, driven by the presence of established industry players, strong demand for immersive learning solutions, and increasing adoption of digital content across schools and museums.
Europe (26.1%)
Europe follows with a market share of 26.1%, supported by robust public and private investment in education and cultural engagement. Countries such as the United Kingdom, Germany, and France are key contributors, where edutainment is being integrated into both formal and informal educational settings. European consumers exhibit strong demand for content that combines learning with creativity and interactivity, particularly in science centers, edutainment parks, and digital platforms.
Key players
- KidZania
- Legoland Discovery Center
- Kindercity
- Pororo Park
- CurioCity
Competitive Analysis
The global edutainment market is highly competitive, with key players striving to differentiate themselves through unique thematic offerings, immersive learning experiences, and technology integration. KidZania leads the market with its real-life role-playing environments that foster skill development and career awareness in children. Legoland Discovery Center maintains a strong brand presence by combining play with creative building and STEM-based activities. Kindercity focuses on science and technology-driven exhibits, promoting curiosity and hands-on learning. Pororo Park leverages character-based attractions to appeal to younger children, offering a mix of entertainment and early education. CurioCity emphasizes exploratory learning through interactive installations and digital innovation. These players continually invest in expanding their global footprint, upgrading facilities, and adopting new technologies like AR/VR to enhance customer engagement. Strategic partnerships, franchising models, and diversified revenue streams enable them to mintain competitive advantages in an evolving and experience-driven market landscape.
Recent Developments
- In March 2025, KidZania‘s Global COO, Hernan Barbieri, visited India to strengthen the role of edutainment in learning. He engaged with stakeholders at KidZania-Mumbai and KidZania-Delhi NCR, emphasizing operational excellence and the transformative impact of immersive role-play experiences on children’s education.
Market Concentration and Characteristics
The global edutainment market exhibits a moderately concentrated structure, characterized by the presence of a few dominant players alongside a growing number of regional and niche providers. Market leaders such as KidZania, Legoland Discovery Center, and Pororo Park hold significant brand equity and operational scale, often leveraging franchising and partnerships to expand globally. The market is marked by high barriers to entry due to substantial capital investment required for infrastructure, technology integration, and content development. Key characteristics of the market include innovation-driven competition, a focus on immersive and interactive learning experiences, and a strong dependence on visitor engagement and repeat footfall. Additionally, the increasing incorporation of digital platforms and personalized learning tools reflects a shift towards hybrid business models that combine physical and virtual edutainment offerings.
Report Coverage
The research report offers an in-depth analysis based on Gaming Type, Facility Size, Revenue Source, Visitor Demographics and Region. It details leading market players, providing an overview of their business, product offerings, investments, revenue streams, and key applications. Additionally, the report includes insights into the competitive environment, SWOT analysis, current market trends, as well as the primary drivers and constraints. Furthermore, it discusses various factors that have driven market expansion in recent years. The report also explores market dynamics, regulatory scenarios, and technological advancements that are shaping the industry. It assesses the impact of external factors and global economic changes on market growth. Lastly, it provides strategic recommendations for new entrants and established companies to navigate the complexities of the market.
Future Outlook
- The global edutainment market is anticipated to experience substantial growth, with projections estimating a rise from USD 1,729.81 million in 2024 to an estimated USD 5,632.03 million by 2032, reflecting a compound annual growth rate (CAGR) of 15.90% from 2025 to 2032.
- The incorporation of technologies such as augmented reality (AR) and virtual reality (VR) is expected to enhance interactive learning experiences, making educational content more engaging and immersive for users.
- The Asia-Pacific region is poised for significant growth in the edutainment sector, driven by increasing smartphone and internet adoption, particularly in countries like China, Japan, South Korea, and India.
- Advancements in artificial intelligence (AI) are facilitating the development of personalized learning platforms, allowing content to be tailored to individual learning styles and paces, thereby improving educational outcomes.
- The proliferation of mobile devices is enabling the growth of on-demand learning solutions, providing users with the flexibility to access educational content anytime and anywhere, catering to the modern learner’s needs.
- The trend of integrating game mechanics into educational content continues to gain momentum, enhancing user engagement and motivation through elements like rewards, challenges, and interactive storytelling.
- Governments and private entities are increasingly investing in digital infrastructure to support edutainment initiatives, recognizing the potential of digital learning solutions to enhance educational accessibility and quality.
- The emergence of free generative AI tools poses challenges to traditional edutainment providers, as these tools offer alternative learning solutions that may undercut paid services, necessitating innovation and differentiation in the market.
- There is a growing emphasis on Science, Technology, Engineering, and Mathematics (STEM) education within edutainment offerings, aiming to equip learners with critical skills relevant to the evolving job market.
- Edutainment companies are increasingly incorporating sustainability and social responsibility into their business models, developing content that raises awareness about environmental issues and promotes social values among learners.


