Market Overview:
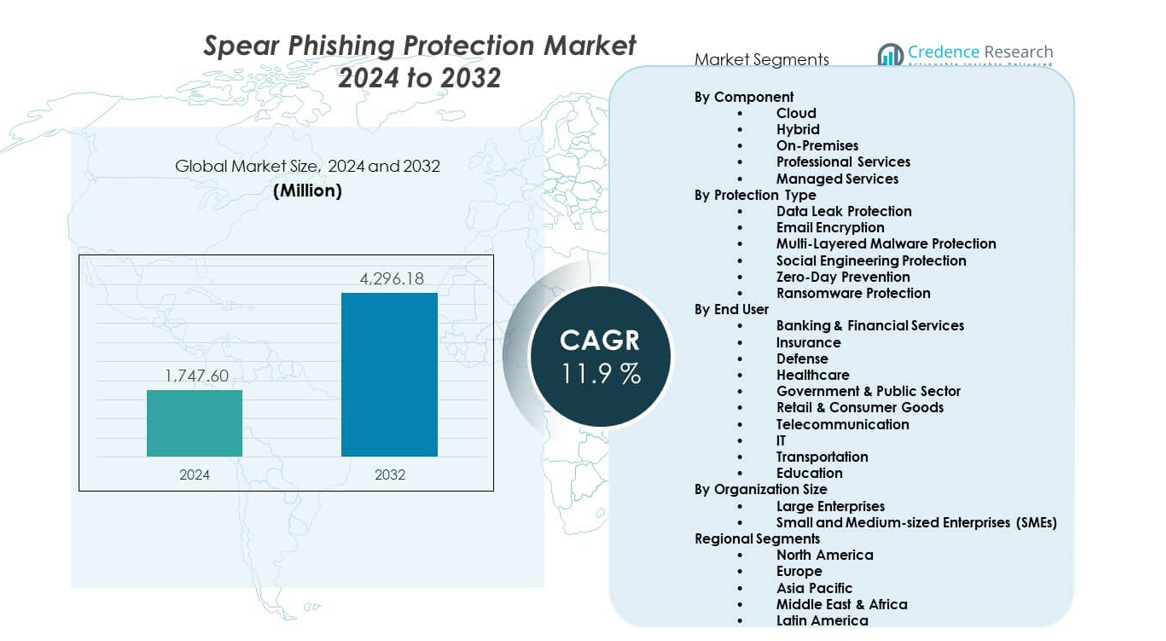
The Spear Phishing Protection Market is projected to grow from USD 1,747.6 million in 2024 to an estimated USD 4,296.18 million by 2032, with a CAGR of 11.9% from 2024 to 2032.
| REPORT ATTRIBUTE |
DETAILS |
| Historical Period |
2020-2023 |
| Base Year |
2024 |
| Forecast Period |
2025-2032 |
| Spear Phishing Protection Market Size 2024 |
USD 1,747.6 million |
| Spear Phishing Protection Market, CAGR |
11.9% |
| Spear Phishing Protection Market Size 2032 |
USD 4,296.18 million |
Stronger dependence on digital communication pushes enterprises to adopt faster and smarter anti-phishing controls. Attackers now craft personalized messages using breached data, which drives firms to invest in adaptive detection tools. AI models help analyze sender behavior and message tone to stop threats before reaching the inbox. Cloud adoption and remote work add new risk points, raising demand for real-time filtering engines. Security teams rely on automated forensics to trace unusual activity across accounts. The market benefits from new rules that require stricter email authentication and identity checks.
North America leads the market due to strong cybersecurity spending, rapid threat intelligence adoption, and strict compliance frameworks. The region hosts major technology vendors and faces frequent targeted attacks, which accelerates advanced protection deployment. Europe follows with rising investment driven by regulatory pressure and increased enterprise digitalization. Asia-Pacific emerges as the fastest-growing region as expanding cloud ecosystems, rising online transactions, and increasing business email compromise cases push firms to upgrade defenses. Countries like Japan, India, and Australia invest more in AI-driven security, while Latin America and the Middle East show growing interest in email threat protection.
Market Insights:
- The Spear Phishing Protection Market reached USD 1,747.6 million in 2024 and is projected to hit USD 4,296.18 million by 2032, growing at a CAGR of 11.9% due to rising targeted email attacks and stronger enterprise security needs.
- North America (38%), Europe (28%), and Asia Pacific (22%) lead the market because of high cybersecurity investment, strict compliance rules, and expanding digital ecosystems.
- Asia Pacific, holding 22%, is the fastest-growing region driven by rapid cloud adoption, digital expansion, and increasing targeted phishing attempts across major economies.
- The Cloud segment led deployment share with strong preference for scalable, AI-driven email protection across enterprises.
- Large Enterprises held the dominant organizational share due to wider attack surfaces, strict compliance needs, and higher investment capacity.
Access crucial information at unmatched prices!
Request your sample report today & start making informed decisions powered by Credence Research Inc.!
Download Sample
Market Drivers:
Growing Volume of Targeted Email Attacks
The Spear Phishing Protection Market grows due to rising targeted email intrusions that exploit user behavior. Attackers create tailored messages that mimic real communication to trick decision-makers. Security teams deploy advanced filters to block suspicious sender patterns. Companies raise budgets to prevent reputational damage linked to successful breaches. AI tools help detect unusual tone fluctuations within email content. Cloud-based filters reduce response time during active incidents. It creates pressure on firms to adopt predictive analytics. Vendors upgrade engines to stop high-precision attacks before reaching users.
- For instance, Microsoft Defender for Office 365 reports blocking more than 5 billion phishing and malicious emails in a single year, highlighting the scale of targeted email threats.
Expansion of Remote Work and Digital Collaboration
The surge in remote work opens new attack routes across distributed environments within the Spear Phishing Protection Market. Employees depend on digital communication, which raises exposure to crafted messages. Attackers focus on home networks and unmanaged devices. Firms deploy identity verification tools to secure employee access. Behavioral analytics help track sudden changes in user login patterns. Cloud platforms support rapid threat containment. It reinforces the need for multi-layered email security. Vendors launch adaptive engines to strengthen real-time monitoring across global teams.
- For instance, Google states that Gmail blocks over 100 million phishing emails every day, with a significant share targeting remote workers through personal and unmanaged devices.
Increased Enterprise Adoption of AI and ML Security Tools
AI integration accelerates demand within the Spear Phishing Protection Market as firms modernize cyber defenses. Machine learning models examine massive email datasets to detect complex threats. These engines identify new attack vectors faster than manual teams. Behavioral scoring helps classify risk levels within seconds. Companies adopt automated decision tools to cut investigation delays. Cloud ecosystems support continuous model improvement. It boosts the accuracy of detection workflows for enterprise use. Vendors focus on intuitive dashboards that simplify risk interpretation for security teams.
Regulatory Pressure Driving Email Authentication Compliance
Strict compliance rules fuel spending within the Spear Phishing Protection Market across regulated sectors. Industries adopt authentication frameworks to reduce unauthorized email activity. Mandates push firms toward domain-based message validation. Enforcement teams use reporting tools to track suspicious sender domains. Boards approve stronger budget support for compliance-heavy environments. Cloud email gateways help simplify deployment across large networks. It pushes enterprises toward continuous policy refinement. Vendors leverage compliance automation to support organizations facing strict audit cycles.
Market Trends:
Rise of Integrated Threat Intelligence Platforms
Integrated intelligence platforms shape the Spear Phishing Protection Market through stronger cross-channel monitoring. Companies merge email data with network logs for deeper analysis. Threat feeds help firms detect patterns linked to global attack groups. Automated engines correlate sender reputation with message context. Shared intelligence improves early warning capability. Real-time dashboards help teams act faster during active threats. It strengthens enterprise focus on unified security views. Vendors expand threat-sharing networks to boost proactive detection.
- For instance, Proofpoint’s threat intelligence network analyzes more than 6 billion email messages daily, enabling real-time insights into global phishing activity and attacker infrastructure.
Growth of Zero-Trust Email Architectures
Zero-trust adoption accelerates transformation within the Spear Phishing Protection Market. Security teams apply continuous verification to every incoming message. Policies require strict checks on sender identity and device trust. Engines evaluate message behavior instead of relying on static rules. Companies deploy micro-level segmentation to limit email-triggered breaches. Cloud-native zero-trust tools streamline implementation across hybrid environments. It elevates organizational focus on authentication strength. Vendors release modular features that match diverse enterprise needs.
Increasing Automation in Incident Response Workflows
Automation gains prominence across the Spear Phishing Protection Market as firms reduce manual investigation time. Response tools trigger alerts when email anomalies surface. Automated quarantine reduces user exposure to malicious content. Workflows support fast triage of flagged communication. Robots classify threats by intent, payload type, and target. Companies prefer systems that deliver precise guided actions. It improves detection consistency across security teams. Vendors adopt playbook-driven engines to streamline threat handling.
Shift Toward Cloud-Native Email Security Solutions
Cloud-native solutions expand influence within the Spear Phishing Protection Market. Organizations migrate email systems to cloud platforms for scalability. Cloud gateways handle threat analysis without hardware limits. Real-time scanning improves detection speed for large enterprises. Security teams gain remote access to monitoring dashboards. Multi-tenant models support wider threat visibility. It encourages firms to replace legacy on-premise tools. Vendors emphasize flexible subscription plans to attract growing businesses.
Market Challenges Analysis:
Evolving Threat Sophistication and Detection Limitations
Threat evolution challenges progress within the Spear Phishing Protection Market. Attackers adjust messaging style to bypass filters. New evasion tactics create gaps within detection workflows. Companies struggle with identifying highly convincing impersonation attempts. Behavioral engines face difficulty when analyzing minimal text emails. Firms need constant tuning of detection systems. It increases operational strain on security teams. Vendors invest more in adaptive tools to counter fast-changing attack models.
High Integration Complexity and Skill Gaps in Security Teams
Integration hurdles impact adoption across the Spear Phishing Protection Market. Enterprises face difficulty merging new tools with existing infrastructure. Legacy systems slow the rollout of advanced filtering engines. Security teams need stronger skills to manage complex threat models. Training gaps reduce the effectiveness of detection tools. Budget constraints delay technical upgrades across regions. It raises deployment risk within organizations. Vendors provide guided onboarding to ease integration and improve user confidence.
Market Opportunities:
Expansion Potential in AI-Augmented Threat Detection Technologies
AI-focused detection creates strong growth potential for the Spear Phishing Protection Market. Enterprises look for engines that decode message tone and sender behavior with precision. Vendors can offer adaptive threat recognition that scales with cloud workloads. Organizations seek faster intelligence processing to counter targeted attacks. It opens pathways for real-time defensive automation. Firms invest in predictive analytics to reduce user-level vulnerability. Demand grows for smarter identity validation systems that block impersonation attempts.
Rising Demand Across Emerging Economies and SMB Segments
Emerging markets create new revenue prospects in the Spear Phishing Protection Market. SMBs accelerate adoption due to increasing exposure to targeted email scams. Vendors can offer lightweight, cloud-native tools suited for smaller budgets. Countries undergoing digital expansion invest in stronger authentication frameworks. It supports wider deployment of threat prevention technology. Growth opportunities expand as firms shift communication to cloud platforms. Vendors position scalable solutions to meet rising demand across developing regions.
Market Segmentation Analysis:
By Component
Cloud deployment holds the largest share in the Spear Phishing Protection Market due to strong adoption of cloud email platforms and scalable threat detection engines. Hybrid models attract firms that need flexible control across mixed environments. On-premises systems remain relevant for regulated sectors requiring strict data control. Professional services support enterprises with integration, policy design, and training. Managed services gain demand among SMBs that prefer outsourced monitoring and rapid threat response. Vendors expand service portfolios to address growing complexity in email security workflows.
- For instance, Palo Alto Networks reports inspecting over 5 billion cloud-based threats daily through its cloud-delivered security services, supporting enterprise email protection.
By Protection Type
Data leak protection tools help companies stop unauthorized information transfer across communication channels. Email encryption strengthens message integrity and secures sensitive exchanges. Multi-layered malware protection blocks payload-driven attacks that enter through targeted emails. Social engineering protection helps detect psychological manipulation that bypasses basic filters. Zero-day prevention focuses on unknown exploits that target gaps in email gateways. Ransomware protection remains essential due to rising attacks on financial, healthcare, and public sector assets. It drives firms toward integrated threat analysis platforms.
- For instance, CrowdStrike’s Falcon platform processes more than 10 billion events a day globally, and reports indicate that over 90% of cyberattacks start with a phishing email. This high volume of activity and the prevalence of initial access methods like phishing demonstrate the need for layered phishing and ransomware protection.
By End User
Banking and financial services lead adoption due to frequent targeted attacks on executive accounts. Insurance, defense, and healthcare deploy advanced filters to secure sensitive data. Government and public sector agencies implement authentication standards to reduce impersonation attempts. Retail, telecom, and IT firms strengthen protection due to high-volume communication. Transportation and education sectors increase spending as digital interaction expands across global operations.
By Organization Size
Large enterprises dominate usage due to wide attack surfaces and strict compliance needs. Small and medium-sized enterprises adopt cloud-based tools that offer lower cost, faster deployment, and managed threat monitoring.
Segmentation:
By Component
- Cloud
- Hybrid
- On-Premises
- Professional Services
- Managed Services
By Protection Type
- Data Leak Protection
- Email Encryption
- Multi-Layered Malware Protection
- Social Engineering Protection
- Zero-Day Prevention
- Ransomware Protection
By End User
- Banking & Financial Services
- Insurance
- Defense
- Healthcare
- Government & Public Sector
- Retail & Consumer Goods
- Telecommunication
- IT
- Transportation
- Education
By Organization Size
- Large Enterprises
- Small and Medium-sized Enterprises (SMEs)
Regional Segments
- North America
- Europe
- Germany
- France
- U.K.
- Italy
- Spain
- Rest of Europe
- Asia Pacific
- China
- Japan
- India
- South Korea
- South-east Asia
- Rest of Asia Pacific
- Latin America
- Brazil
- Argentina
- Rest of Latin America
- Middle East & Africa
- GCC Countries
- South Africa
- Rest of the Middle East and Africa
Regional Analysis:
North America
North America holds the largest share of the Spear Phishing Protection Market with around 38% due to strong cybersecurity spending and rapid adoption of advanced email security frameworks. The region faces a high volume of targeted attacks against enterprises and government agencies. Firms deploy AI-driven filters to counter sophisticated impersonation attempts. Cloud email adoption increases demand for scalable defensive tools. Regulatory pressure further pushes companies toward stronger authentication models. It strengthens vendor presence across the United States and Canada. Leading technology firms support continuous innovation within this region.
Europe
Europe accounts for nearly 28% share supported by strict data protection regulations and high awareness of targeted email threats. GDPR enforcement encourages enterprises to invest in stronger communication security frameworks. Companies upgrade filters to counter attacks on financial institutions, public agencies, and industrial firms. Cloud migration across major economies increases exposure to targeted threats. Security vendors expand operations to meet demand for compliance-focused tools. It drives investment in identity-based protection systems. Regional collaboration among cybersecurity agencies helps improve detection standards.
Asia Pacific
Asia Pacific represents about 22% share and stands as the fastest-growing region due to rapid digitalization across enterprises. Expanding cloud usage increases vulnerability to precision-targeted phishing emails. Countries such as India, Japan, and Australia invest in AI-driven email threat prevention. Local firms adopt managed security services to handle rising attack volumes. Cybersecurity budgets increase as organizations prioritize secure communication channels. It supports demand for scalable protection across diverse industries. Growing digital economies strengthen long-term market potential across the region.
Shape Your Report to Specific Countries or Regions & Enjoy 30% Off!
Key Player Analysis:
- Proofpoint, Inc.
- Cisco Systems, Inc.
- Microsoft Corporation
- Mimecast Services Limited
- Trend Micro Incorporated
- Barracuda Networks, Inc.
- FireEye, Inc. (Trellix)
- Symantec Corporation (Broadcom Inc.)
- Sophos Group plc
- Fortinet, Inc.
- Palo Alto Networks
- Check Point Software Technologies Ltd.
- Cofense Inc.
- GreatHorn, Inc.
- BAE Systems
- Intel Corporation
- Forcepoint LLC
- PhishLabs
Competitive Analysis:
The Spear Phishing Protection Market features intense competition driven by rapid innovation and expanding enterprise demand. Leading companies focus on AI-powered detection, behavioral analytics, and identity threat protection to secure communication channels. Firms invest in cloud-native security tools that protect distributed workforces. Strategic acquisitions help vendors enhance their email security ecosystems and accelerate product integration. It pushes companies to strengthen threat intelligence capabilities to counter high-precision attacks. Global players compete on scalability, ease of deployment, and automation strength. New entrants target niche opportunities such as real-time impersonation monitoring and advanced payload analysis.
Recent Developments:
- In November 2025, Trend Micro announced it will launch Trend Vision One AI Security Package at AWS re:Invent in December 2025. This is the first solution package delivering proactive, centralized exposure management with unparalleled analytics for AI-driven environments, protecting the full AI application stack from model development to runtime. The AI Scanner continuously monitors models to uncover vulnerabilities and applies AI guardrails to defend against threats.
- In September 2025, Trend Micro entered into a strategic partnership with Invision Cyber, a new cyber insurance managing general agent (MGA). The partnership is designed to offer Trend Micro’s US-based customers a tailored cyber insurance solution built around real-time cyber risk insights and data-driven underwriting. Invision offers capacity limits of up to $10 million across a wide range of coverages including business interruption, cyber extortion, and incident response.
- In May 2025, Proofpoint, Inc. launched its next-generation digital communications governance offering with enhanced capture, archiving, and supervision innovations. The company announced AI-powered capabilities including intelligent search, advanced global archiving, and ML-driven supervision to support compliance requirements. Proofpoint Archive is now available on Amazon Web Services (AWS), with migrations for existing customers beginning in Q3 2025. Additionally, the new capabilities for Proofpoint Supervision and Automate are expected to be globally available through a phased rollout starting Q2 2025.
- In April 2025, Proofpoint announced the launch of the industry’s first unified data security solution combining data loss prevention (DLP), data security posture management (DSPM), and insider threat management into a single architecture. Built on Proofpoint Nexus with AI agents, this solution enables organizations to locate sensitive data, classify it correctly, and govern access across all channels. The new capabilities are expected to be globally available by the end of August 2025.
Report Coverage:
The research report offers an in-depth analysis based on Component, Protection Type, End User, and Organization Size. It details leading market players, providing an overview of their business, product offerings, investments, revenue streams, and key applications. Additionally, the report includes insights into the competitive environment, SWOT analysis, current market trends, as well as the primary drivers and constraints. Furthermore, it discusses various factors that have driven market expansion in recent years. The report also explores market dynamics, regulatory scenarios, and technological advancements that are shaping the industry. It assesses the impact of external factors and global economic changes on market growth. Lastly, it provides strategic recommendations for new entrants and established companies to navigate the complexities of the market. [replace all segments in report coverage]
Future Outlook:
- AI-enhanced detection will expand as firms seek stronger analysis of targeted email threats.
- Cloud-native email security adoption will grow across enterprises migrating from legacy systems.
- Demand for identity-based protection will rise with increasing impersonation attempts.
- Integration of threat intelligence feeds will become a standard requirement.
- Small and medium businesses will adopt managed services to offset skill shortages.
- Zero-trust email frameworks will gain wider acceptance across regulated sectors.
- Vendors will increase automation within incident response workflows.
- Hybrid work trends will push companies to strengthen remote communication security.
- Regulatory compliance needs will drive investment in advanced authentication tools.
- Partnerships between cybersecurity vendors will increase product interoperability.


