
Market Overview
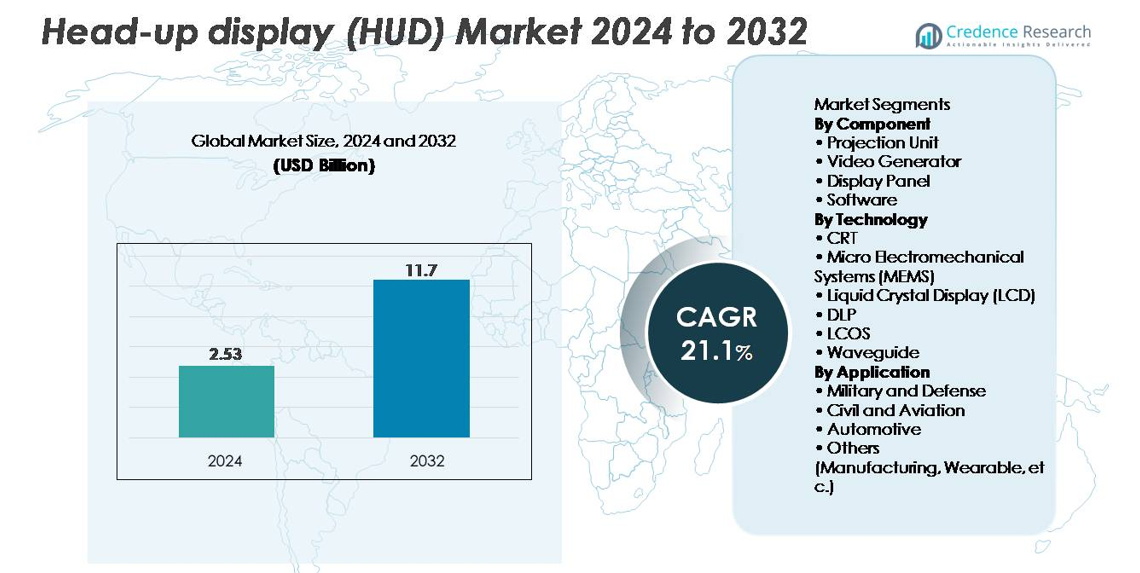
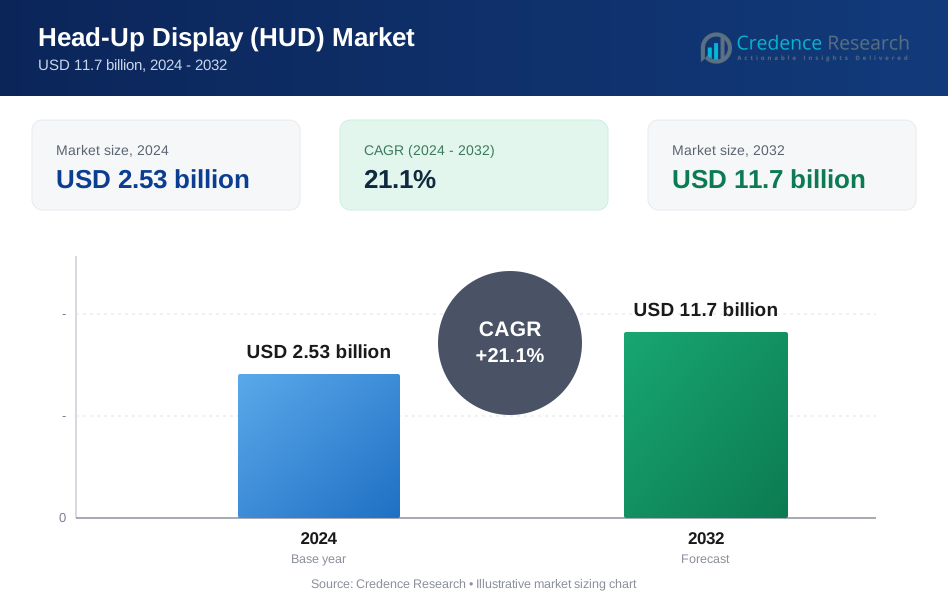
The head-up display (HUD) market was valued at USD 2.53 billion in 2024 and is projected to reach USD 11.7 billion by 2032, registering a CAGR of 21.1% during the forecast period (2025–2032).
| REPORT ATTRIBUTE | DETAILS |
|---|---|
| Historical Period | 2020-2023 |
| Base Year | 2024 |
| Forecast Period | 2025-2032 |
| Head-Up Display (HUD) Market Size 2024 | USD 2.53 billion |
| Head-Up Display (HUD) Market, CAGR | 21.1% |
| Head-Up Display (HUD) Market Size 2032 | USD 11.7 billion |
The head-up display (HUD) market is shaped by strong competition among leading automotive and avionics suppliers, with Continental AG, Denso Corporation, Panasonic Automotive Systems, Robert Bosch, Nippon Seiki, Honeywell Aerospace, Rockwell Collins, BAE Systems, Pioneer Corporation, and MicroVision driving innovation in projection engines, AR-HUD platforms, and waveguide optics. These companies strengthen their positions through advancements in sensor fusion, high-brightness optical modules, and wide–field-of-view AR displays. North America leads the market with about 34% share, supported by high ADAS adoption and strong aviation demand, while Asia-Pacific (≈30%) and Europe (≈28%) remain critical regions due to their strong automotive manufacturing bases and rapid integration of AR-enabled smart cockpits.
Market Insights
- The head-up display (HUD) market reached USD 2.53 billion in 2024 and is projected to hit USD 11.7 billion by 2032, expanding at a 1% CAGR during the forecast period.
- Market growth is driven by rising ADAS adoption, increasing demand for distraction-free driving interfaces, and rapid integration of AR-HUD systems across mid-range and premium vehicles.
- Trends include expanding use of waveguide optics, MEMS-based scanning displays, and holographic windshield projections, alongside growing applications in aviation, defense, and emerging wearable HUD platforms.
- Competition intensifies as major players such as Continental, Denso, Panasonic Automotive, Nippon Seiki, Bosch, and Honeywell Aerospace accelerate innovation in optical engines, software, and sensor-fusion capabilities.
- Regionally, North America leads with ~34% share, followed by Asia-Pacific at ~30% and Europe at ~28%, while segment-wise, projection units dominate the component category and waveguide technology holds the largest share among display technologies, supported by strong automotive and aviation adoption
Market Segmentation Analysis:
By Component
The projection unit represents the dominant component segment, accounting for the largest market share due to its critical role in rendering high-brightness, distortion-free visual overlays essential for automotive and aviation applications. Advancements in compact optical engines, LED/laser illumination modules, and real-time calibration systems further strengthen its adoption across next-generation HUD platforms. Display panels and video generators continue to gain traction with the rise of AR-based HUDs, while software emerges as a fast-growing sub-segment driven by the need for sensor fusion, predictive alerts, lane guidance, and advanced visualization algorithms.
- For instance, Panasonic Automotive has demonstrated an AR-HUD platform that uses a laser-based holographic optical engine to project navigation cues and driver alerts into the forward road view. The company highlights long-range virtual image projection suitable for automotive safety standards and supports bright, high-contrast overlays designed for visibility in daylight conditions.
By Technology
Waveguide technology leads the market with the highest share, supported by its ability to deliver wide-field-of-view, high-transparency, and lightweight display architectures suited for both automotive AR-HUDs and aviation head-mounted solutions. Waveguide systems also enable deeper integration with ADAS sensors and eye-tracking modules, accelerating OEM adoption. MEMS-based scanning displays and LCOS technologies are expanding rapidly due to their superior resolution and power efficiency, while DLP remains favored for premium vehicles requiring vivid color performance. Traditional CRT solutions continue to decline as industries shift to compact, solid-state, and holographic display technologies. For instance, Envisics’ second-generation holographic waveguide AR-HUD, used in the Cadillac LYRIQ, delivers long-range virtual image projection at roughly 20 meters and provides wide AR overlays for navigation and hazard cues. General Motors confirmed this deployment as part of its move toward advanced immersive display systems.
By Application
The automotive segment holds the dominant market share, driven by the surge in AR-HUD integration across mid-range and premium vehicles to support ADAS visualization, navigation overlays, and driver-safety alerts. Increasing penetration of connected cars and regulatory emphasis on minimizing driver distraction further accelerate adoption. Military and defense applications remain significant due to long-standing use in fighter jets and armored vehicles, while civil aviation continues adopting HUDs to enhance situational awareness and reduce pilot workload. Emerging uses in manufacturing and wearable systems add incremental growth, particularly in training, logistics, and hands-free operational environments
Key Growth Drivers:
Rising Adoption of Advanced Driver Assistance Systems (ADAS) and Safety Regulations
The rapid expansion of ADAS-equipped vehicles significantly accelerates HUD adoption as OEMs integrate visual overlays to enhance driver awareness and reduce distraction. HUDs present real-time speed, navigation, collision warnings, and lane-keeping data directly within the driver’s line of sight, aligning with global safety mandates that emphasize human-machine interface optimization. Governments in North America, Europe, and Asia increasingly recommend or mandate features such as lane departure warnings and forward-collision alerts, pushing automakers to incorporate HUDs as part of larger safety suites. Automakers like BMW, Mercedes-Benz, and Toyota are embedding AR-HUDs to meet consumer expectations for intuitive, distraction-free interfaces. The surge in premium and mid-range vehicles adopting AR visualization, combined with growing consumer preference for safer and more intelligent driving experiences, positions ADAS-driven HUD integration as a core market accelerator.
- For instance, Mercedes-Benz’s MBUX AR-HUD in the S-Class presents a virtual image that appears about 10 meters ahead and is comparable in size to a 77-inch display. The system overlays AR navigation arrows and hazard cues directly onto the road view, supporting clearer guidance at highway speeds.
Technological Advancements in AR-HUDs, Waveguide Optics, and Sensor Fusion
Next-generation AR-HUDs are transforming the cockpit experience by combining real-world views with dynamic, context-aware overlays. Advancements in waveguide optics, holographic combiners, and MEMS-based scanning engines enable wider fields of view, deeper depth perception, and improved brightness under varying lighting conditions. Integration of radar, LiDAR, inertial sensors, and computer vision allows HUDs to project lane boundaries, pedestrian highlights, vehicle trajectories, and hazard alerts with greater accuracy. Automakers are rapidly shifting toward AR-HUDs as these systems enhance situational awareness while supporting semi-autonomous driving functions. Continuous innovation from technology suppliers—including improvements in projection engines, eye-tracking, and spatial mapping—fuels adoption in both automotive and aviation sectors. As AR technologies mature, HUD systems transition from basic display units to advanced perception platforms, establishing a critical growth driver.
- For instance, BMW’s iX uses the BMW Operating System 8 to deliver an Augmented View feature that overlays directional graphics on a live front-camera video feed. The system provides lane-accurate navigation on the central control display during complex turns and junctions.
Increasing Penetration of Connected and Smart Vehicles
The expansion of connected vehicle ecosystems—powered by telematics, V2X communication, cloud analytics, and real-time navigation—creates strong demand for HUDs capable of visualizing increasingly complex data. Consumers expect seamless digital integration, where HUDs serve as the primary interface for alerts, infotainment, navigation, route optimization, and real-time traffic intelligence. As software-defined vehicles (SDVs) gain momentum, HUDs evolve into flexible platforms supporting OTA updates, personalized display settings, and integration with digital assistants. Automakers are using HUDs to differentiate cockpit experiences and strengthen brand identity. The rising global appetite for intelligent, digitally connected vehicles pushes manufacturers to embed HUDs across wider price ranges. This digital shift positions HUDs as essential components of future in-car UX architectures, accelerating market expansion.
Key Trends and Opportunities
Rapid Expansion of AR-HUDs and Holographic Windshield Displays
AR-based HUDs represent one of the most significant emerging opportunities, offering enhanced depth perception, real-time spatial positioning, and immersive data overlays. These systems transform windshields into augmented navigation and safety hubs, enabling features such as projected lane arrows, blind-spot visualization, obstacle tracking, and crosswalk recognition. Holographic and waveguide-based windshield displays further open opportunities for lighter, more transparent, and more flexible HUD integration. OEMs increasingly invest in AR visualization as a core differentiator in electric and autonomous vehicles. Vendors specializing in holographic optics, nano-imprinting, and large-area waveguides are experiencing heightened demand as automakers seek scalable AR-HUD architectures. The shift toward immersive infotainment and next-generation human-machine interfaces amplifies the commercial opportunity for AR-HUD suppliers across both premium and mass-market vehicle segments.
- For instance, Envisics’ holographic waveguide AR-HUD, deployed in the Cadillac LYRIQ, projects long-range AR graphics at a virtual distance of about 20 meters and uses dynamic holography to overlay lane guidance, hazard cues, and navigation data onto the windshield.
Growing Opportunities in Aviation, Defense, and Wearable HUD Applications
Beyond automotive, aviation and defense sectors create robust opportunities as pilots, ground crews, and soldiers rely on HUDs for high-precision situational awareness. Commercial aircraft increasingly adopt HUDs to support landing assistance, low-visibility operations, and flight-path stabilization. Defense applications expand toward helmet-mounted displays, night-vision-integrated projection systems, and tactical battlefield visualization. Wearable HUDs are also gaining traction in manufacturing, logistics, and maintenance, enabling hands-free access to instructions, diagnostics, and safety alerts. The convergence of lightweight optics, high-brightness microdisplays, and ruggedized designs unlocks new application pathways. As industries prioritize real-time decision-making and operational efficiency, cross-sector HUD demand grows significantly, creating long-term opportunities for suppliers specializing in compact, durable, and high-performance display technologies.
- For instance, Collins Aerospace’s HGS-6000 delivers a 30° × 24° field of view and is certified for low-visibility operations with decision heights down to 50 feet on equipped commercial aircraft. The system supports precise guidance during Category III approaches used in fog and other low-visibility conditions.
Increasing Demand for Smart Cockpits and Immersive In-Vehicle User Experiences
The transition toward software-defined, user-centric smart cockpits fuels adoption of HUDs as central display interfaces. Modern consumers expect seamless integration of navigation, infotainment, sensor alerts, and personalized content—delivered through intuitive, distraction-free layouts. HUDs complement digital clusters and central displays by projecting essential data in a natural viewing plane. Automakers are enhancing cockpit UX with voice assistants, AI-driven contextual alerts, biometric profiling, and adaptive lighting—all of which integrate efficiently through HUD systems. As immersive and multi-layered cockpit environments become standard, HUDs gain strategic relevance. This push toward premium in-vehicle experiences presents a compelling opportunity for innovation in optics, software, and embedded electronics.
Key Challenges
High Production Costs and Integration Complexity
HUD manufacturing remains cost-intensive due to advanced projection engines, precision optics, waveguides, illumination modules, and ruggedized components required for reliability under varying conditions. AR-HUDs, in particular, demand complex optical combiners, wide FOV projections, and multi-sensor fusion systems—all of which elevate engineering and calibration costs. Integration is challenging for automakers because windshields, dashboard geometries, and cabin layouts differ across models, requiring custom optical alignment and mechanical interfacing. Additionally, sourcing high-precision components increases dependency on specialized suppliers. These cost and integration hurdles slow adoption in budget vehicle segments, limiting mass-market penetration.
Technical Limitations: Image Distortion, Heat Management, and Eye Box Constraints
Despite rapid advances, HUDs face persistent technical challenges involving image clarity, field-of-view limitations, brightness uniformity, and distortion management. Windshield curvature variations can introduce reflection artifacts or ghosting, requiring complex compensation algorithms. Heat dissipation remains a concern in compact projection systems, impacting long-term reliability. Eye box limitations—particularly in AR-HUDs—can cause visibility issues for drivers of different heights or seating positions. Ambient lighting, especially direct sunlight, also affects display readability. These constraints demand ongoing innovation in optics, thermal management, and adaptive calibration technologies to ensure consistent performance across driving environments.
Regional Analysis
North America
North America leads the global HUD market with around 34% share, driven by early adoption of ADAS-equipped vehicles, strong regulatory emphasis on driver-safety technologies, and the presence of major automotive innovators. U.S. OEMs integrate AR-HUDs into premium and mid-segment vehicles to enhance situational awareness and reduce distraction. The region’s robust aviation and defense sectors further strengthen demand, particularly for advanced projection systems and head-mounted displays. Increasing consumer preference for connected, software-defined vehicles and rising deployment of EV platforms accelerate HUD integration, establishing North America as the dominant and technologically progressive market.
Europe
Europe accounts for approximately 28% of the global HUD market, supported by stringent safety mandates, strong luxury vehicle production, and rapid deployment of AR-enabled cockpit systems. German OEMs such as BMW, Audi, and Mercedes-Benz drive innovation through high-precision projection technologies and waveguide-based HUD architectures. The region’s aviation and defense modernization programs also contribute to incremental demand. Regulatory frameworks encouraging reduced driver distraction and enhanced situational awareness continue to shape adoption trends. Growing investments in electric and autonomous vehicle platforms further expand the market, positioning Europe as a major hub for HUD technology advancement and premium segment penetration.
Asia-Pacific
Asia-Pacific holds nearly 30% market share, making it one of the fastest-growing HUD regions globally. Strong automotive manufacturing bases in China, Japan, and South Korea drive large-scale integration of HUD systems across both premium and mid-range vehicle categories. Rapid urbanization, increasing adoption of ADAS features, and rising consumer demand for advanced in-vehicle experiences support market growth. Chinese OEMs are accelerating AR-HUD deployment in EV models, while Japanese manufacturers continue advancing compact projection technologies. Expanding civil aviation and defense procurement also strengthen regional demand. Favorable economic growth and rising technology adoption solidify Asia-Pacific as a high-potential HUD market.
Latin America
Latin America represents about 5% of the global HUD market, with growth primarily concentrated in Brazil and Mexico due to expanding automotive production and rising adoption of premium vehicle segments. Increasing focus on road safety, along with gradual integration of ADAS features across imported models, supports early HUD penetration. Economic recovery and evolving consumer expectations for connected, feature-rich vehicles create incremental opportunities. Although adoption remains slower compared to major global markets, increasing availability of mid-tier vehicles with basic HUD functionalities and rising interest in AR-based user interfaces contribute to steady regional expansion.
Middle East & Africa
The Middle East & Africa region accounts for around 3% market share, driven by demand for premium vehicles, military modernization programs, and expanding civil aviation fleets. Gulf countries, particularly the UAE and Saudi Arabia, show growing interest in AR-enabled HUDs as part of luxury automotive imports and aviation upgrades. Defense procurement involving advanced helmet-mounted and windshield-based displays contributes to additional market traction. Despite limited mass-market penetration, the region benefits from rising investment in smart mobility and connected vehicle technologies, gradually increasing adoption of HUD systems across selective high-value applications.
Market Segmentations:
By Component
- Projection Unit
- Video Generator
- Display Panel
- Software
By Technology
- CRT
- Micro Electromechanical Systems (MEMS)
- Liquid Crystal Display (LCD)
- DLP
- LCOS
- Waveguide
By Application
- Military and Defense
- Civil and Aviation
- Automotive
- Others (Manufacturing, Wearable, etc.)
By Geography
- North America
- U.S.
- Canada
- Mexico
- Europe
- Germany
- France
- U.K.
- Italy
- Spain
- Rest of Europe
- Asia Pacific
- China
- Japan
- India
- South Korea
- South-east Asia
- Rest of Asia Pacific
- Latin America
- Brazil
- Argentina
- Rest of Latin America
- Middle East & Africa
- GCC Countries
- South Africa
- Rest of the Middle East and Africa
Competitive Landscape
The head-up display (HUD) market is characterized by strong competition among automotive OEMs, avionics suppliers, and advanced display technology developers, each seeking to differentiate through optical innovation, AR integration, and software-driven enhancements. Leading companies such as Continental, Denso, Nippon Seiki, Panasonic Automotive, and Bosch dominate automotive HUD adoption through mature supply chains and large-scale production capabilities. Technology specialists including BAE Systems, Collins Aerospace, and Elbit Systems maintain leadership in aviation and defense-grade HUDs with high-precision projection engines and ruggedized optical combiners. Emerging players and startups focusing on waveguide optics, holographic displays, and MEMS-based scanning solutions intensify competitive dynamics by pushing the shift toward compact, wide–field-of-view AR-HUDs. Strategic collaborations between OEMs and technology vendors, coupled with investments in software platforms enabling sensor fusion, spatial mapping, and predictive visualization, further shape market evolution. As HUD technology becomes a central element of smart cockpits, competition increasingly centers on performance, brightness, depth accuracy, and seamless ADAS integration.
Key Player Analysis
- Panasonic Automotive Systems
- Microvision, Inc.
- Denso Corporation
- Rockwell Collins
- Continental AG
- Pioneer Corporation
- Honeywell Aerospace
- Robert Bosch
- BAE Systems
- Nippon Seiki Co., Ltd.
Recent Developments
- In July 2025, Valeo was selected by a leading Chinese automaker to supply an advanced pillar‑to‑pillar head‑up display that effectively turns the windshield into a wide interactive information surface by projecting key driving data across a large section of glass, with series production targeted for 2026 models.
- In June 2025, Chinese electric vehicle maker XPeng announced a collaboration with Huawei to integrate an augmented reality head‑up display system, branded “Chasing Light Panorama,” into XPeng’s upcoming G7 mid‑size electric SUV, combining Huawei’s hardware with XPeng’s software to enhance navigation and driver‑assistance visualization in the windshield.
- In April 2025, Nippon Seiki Co., Ltd. entered into a joint‑venture agreement in India with Emerging Display Technologies Corporation of Taiwan to establish EDT‑India Private Limited, a new entity focused on manufacturing automotive TFT LCD modules domestically by around 2027, supporting future HUD and cluster display programs for regional OEMs.
- In February 2024, Skoda introduced the Kushaq Explorer, a sportier SUV in India, featuring new cosmetics, a head-up display, 360-degree cameras, and an upgraded reverse camera with guidelines, offering an off-road-ready look.
Report Coverage
The research report offers an in-depth analysis based on Component, Technology, Application and Geography. It details leading market players, providing an overview of their business, product offerings, investments, revenue streams, and key applications. Additionally, the report includes insights into the competitive environment, SWOT analysis, current market trends, as well as the primary drivers and constraints. Furthermore, it discusses various factors that have driven market expansion in recent years. The report also explores market dynamics, regulatory scenarios, and technological advancements that are shaping the industry. It assesses the impact of external factors and global economic changes on market growth. Lastly, it provides strategic recommendations for new entrants and established companies to navigate the complexities of the market
Future Outlook
- AR-HUD adoption will accelerate as automakers integrate spatial overlays and real-time navigation cues to enhance driver awareness.
- Waveguide and holographic optics will gain prominence due to their lightweight design and wide-field-of-view capabilities.
- HUD systems will increasingly merge with ADAS and autonomous driving algorithms for predictive, context-aware alerts.
- Software-defined vehicles will drive demand for customizable HUD interfaces and frequent over-the-air updates.
- Aviation and defense sectors will expand HUD usage through next-generation helmet-mounted and high-precision projection systems.
- Electric and connected vehicles will integrate advanced HUDs as core elements of premium cockpit experiences.
- Miniaturization of projection engines will support broader deployment in mid-segment vehicles.
- Wearable and industrial HUDs will rise in manufacturing, logistics, and field-service operations.
- Partnerships between OEMs and optical technology companies will intensify to scale AR-HUD production.
- Improvements in heat management, eye-box optimization, and sunlight readability will boost long-term reliability and adoption.
Request a Free Sample
Fill in your details and we'll send you a free sample report.
- Sample data tables & charts
- Research methodology
Need a Custom Version of This Report?
Tailor the scope, geography, or segments to your exact requirements.
- Custom geography or segment scope
- Direct access to our analyst team
Frequently Asked Questions
What is the current size of the head-up display market?
At what Compound Annual Growth Rate is the Head-up Display (HUD) market projected to grow between 2024 and 2032?
What factors are driving the growth of the head-up display market?
What are the key segments within the head-up display market?
What are some challenges faced by the head-up display market?
Who are the major players in the head-up display market?
Table of Content
Chapter 1. Report Introduction
- 1.1 Report Description & Purpose
- 1.1.1 Report Title & Market Definition
- 1.1.2 Unique Selling Propositions (USP) & Key Differentiators
- 1.1.3 Value Proposition for Stakeholders
- 1.2 Research Objectives
- 1.2.1 Market Sizing Objectives (Volume & Revenue)
- 1.2.2 Segmentation Objectives
- 1.2.3 Competitive Intelligence Objectives
- 1.2.4 Forecast & Scenario Objectives
- 1.3 Report Scope
- 1.3.1 Head-Up Display (HUD) Scope – Types & Subtypes Covered
- 1.3.2 Geographic Scope – Regions & Countries Covered
- 1.3.3 Historical Period, Base Year & Forecast Period (2024; forecast to 2032)
- 1.3.4 Inclusions & Exclusions
- 1.4 HS Code & Classification Framework
- 1.5 Currency, Units & Pricing Basis
- 1.6 Target Stakeholders
- 1.7 Limitations & Assumptions
Chapter 2. Executive Summary
- 2.1 Global Head-Up Display (HUD) Market Snapshot
- 2.1.1 Market Size – Historical (2024) & Forecast (2024-2032) (2024: USD 2.53 billion → 2032: USD 11.7 billion)
- 2.1.2 Volume & Revenue – Global Totals
- 2.1.3 Key Market Highlights – Top Five Facts
- 2.2 Head-Up Display (HUD) Market Segmentation Snapshot
- 2.2.1 Market Split by Region – 2024 vs. 2032
- 2.3 Competitive Snapshot
- 2.3.1 Top 10 Players by Revenue Share – 2024
- 2.3.2 Top 10 Players by Volume Share – 2024
- 2.3.3 Recent Strategic Developments (18-Month Summary)
- 2.4 Key Investment Highlights & Strategic Conclusions
Chapter 3. Head-Up Display (HUD) Market Dynamics & Industry Analysis
- 3.1 Market Overview & Context
- 3.1.1 Head-Up Display (HUD) Market Position in the Broader Automotive Value Chain
- 3.1.2 OEM vs. Replacement Market Dynamics
- 3.1.3 Market Maturity & Development Stage by Region
- 3.2 Head-Up Display (HUD) Market Drivers
- 3.3 Head-Up Display (HUD) Market Restraints & Challenges
- 3.4 Head-Up Display (HUD) Market Opportunities
- 3.5 Porter's Five Forces Analysis
- 3.5.1 Threat of New Entrants
- 3.5.2 Bargaining Power of Suppliers
- 3.5.3 Bargaining Power of Buyers
- 3.5.4 Threat of Substitutes
- 3.5.5 Competitive Rivalry – Intensity Assessment
- 3.6 Head-Up Display (HUD) Value Chain Analysis
- 3.6.1 Upstream – Raw Material/Input Suppliers
- 3.6.1.1 Raw Material/Input 1
- 3.6.1.2 Raw Material/Input 2
- 3.6.1.3 Raw Material/Input 3
- 3.6.2 Midstream – Production/Manufacturing/Service Delivery
- 3.6.2.1 Production/Process Overview
- 3.6.2.2 Key Facility Locations & Capacity by Manufacturer
- 3.6.3 Downstream – Distribution & End Consumer
- 3.6.3.1 Primary Channel – B2B/OEM
- 3.6.3.2 Secondary Channels – Dealer, Retail, Online, Direct
- 3.6.4 Value Chain Profitability Analysis
- 3.6.1 Upstream – Raw Material/Input Suppliers
- 3.7 PESTEL Analysis
- 3.7.1 Political Factors
- 3.7.2 Economic Factors
- 3.7.3 Social Factors
- 3.7.4 Technological Factors
- 3.7.5 Environmental Factors
- 3.7.6 Legal Factors
- 3.8 Head-Up Display (HUD) Supply Chain Analysis
- 3.8.1 Raw Material/Input Supply Risk Assessment
- 3.8.2 Manufacturing Concentration Risk (Geographic Exposure)
- 3.8.3 Trade Disruption Impact Analysis
- 3.9 Regulatory & Policy Landscape
Note: The regulatory and policy landscape section covers regulations based on their applicability to the market, Head-Up Display (HUD) category, geography, and scope of the study. Only regulatory frameworks with a material impact on operations, compliance, trade, sustainability, or market access are analyzed in detail.
Chapter 4. Key Investment Pockets & Opportunity Analysis
- 4.1 Head-Up Display (HUD) Market Attractiveness Analysis
- 4.1.1 By Region – Investment Attractiveness Matrix (Volume × CAGR)
- 4.2 Absolute Revenue Growth Opportunity
- 4.2.1 By Region – Absolute USD Growth Through 2032
- 4.3 Incremental Volume Opportunity
- 4.3.1 By Region – Incremental Volume Through 2032
- 4.3.2 Segment – Incremental Volume
- 4.4 Emerging Submarket Opportunity Deep Dive (Subject to Applicability)
- 4.5 Emerging Market Opportunity Scorecards
- 4.5.1 United States
- 4.5.2 Europe
- 4.5.3 Asia
- 4.5.4 Middle East & Africa
Note: Emerging Market Opportunity Scorecards will be included based on relevance and strategic importance. Regions listed are indicative and may vary depending on data availability and market dynamics.
Chapter 5. Head-Up Display (HUD) Import-Export Analysis & Trade Flows
- 5.1 Global Trade Overview
- 5.1.1 Global Export Value by Country (2024)
- 5.1.2 Global Export Volume by Country (2024)
- 5.1.3 Global Import Value by Country (2024)
- 5.1.4 Global Import Volume by Country (2024)
- 5.1.5 Net Trade Balance by Country (2024)
- 5.2 Export Analysis – Segment
- 5.2.1 Type 1 (HS Code)
- 5.2.2 Type 2 (HS Code)
- 5.2.3 Type 3 (HS Code)
- 5.2.4 Type 4 (HS Code)
- 5.2.5 Type 5 (HS Code)
- 5.3 Import Analysis – Segment
- 5.3.1 Type 1 (HS Code)
- 5.3.2 Type 2 (HS Code)
- 5.3.3 Type 3 (HS Code)
- 5.3.4 Type 4 (HS Code)
- 5.3.5 Type 5 (HS Code)
- 5.4 Average Unit Trade Prices
- 5.4.1 Average Export Price – Segment & Country
- 5.4.2 Average Import Price – Segment & Source Country
- 5.4.3 Price Trends (2024)
- 5.5 Key Trade Route Analysis
- 5.5.1 Trade Route 1
- 5.5.2 Trade Route 2
- 5.5.3 Trade Route 3
- 5.5.4 Trade Route 4
- 5.5.5 Trade Route 5
- 5.6 Trade Policy Impact Assessment
- 5.6.1 US Anti-Dumping & Section 301 Tariffs
- 5.6.2 EU Customs Union Impact
- 5.6.3 Major Free Trade Agreements
- 5.6.4 USMCA Rules of Origin
Note: Trade policy analysis will be included only where relevant to the Head-Up Display (HUD) market.
Chapter 6. Competitive Landscape & Company Benchmarking
- 6.1 Head-Up Display (HUD) Market Concentration & Structure
- 6.1.1 Herfindahl-Hirschman Index (HHI) – vs. 2024
- 6.1.2 Tier 1, Tier 2 & Tier 3 Market Structure
- 6.1.3 Global, Regional & Local Player Dynamics
- 6.2 Head-Up Display (HUD) Market Share Analysis – 2024
- 6.2.1 Global Revenue Share by Company
- 6.2.2 Global Volume Share by Company
- 6.2.3 Regional Revenue Share
- 6.2.4 Market Share Evolution ( vs. 2024)
- 6.2.5 OEM Segment Share by Company
- 6.2.6 Replacement Segment Share by Company
- 6.3 Production/Delivery Capacity & Facility Analysis
- 6.3.1 Global Installed Capacity
- 6.3.2 Capacity Utilization Rates
- 6.3.3 Production/Output Volume
- 6.3.4 Facility Locations & Capacity Map
- 6.3.5 Planned Capacity Additions
- 6.4 Head-Up Display (HUD) Competitive Benchmarking Matrix
- 6.4.1 Revenue, Volume, CAGR & Profitability Comparison
- 6.4.2 Channel Revenue Mix
- 6.4.3 Geographic Revenue Exposure
- 6.4.4 R&D Intensity
- 6.4.5 Sustainability Maturity
- 6.5 Strategic Developments in Head-Up Display (HUD) (Last 24 Months)
- 6.5.1 Mergers, Acquisitions & Divestments
- 6.5.2 New Head-Up Display (HUD) Launches
- 6.5.3 Facility Expansions
- 6.5.4 Strategic Alliances, Joint Ventures & Partnerships
- 6.5.5 Distribution Expansion & Market Entry
- 6.5.6 Sustainability & ESG Initiatives
- 6.6 Competitive Strategy Mapping
- 6.6.1 Leader, Challenger, Follower & Niche Classification
- 6.6.2 Pricing Strategy Comparison
- 6.6.3 Channel Strategy Matrix
Note: Strategic developments are included based on their materiality and the availability of reliable information.
Chapter 7. Global Head-Up Display (HUD) Market – By Distribution Channel
- 7.1 Segment Overview
- 7.1.1 Volume & Revenue Split by Channel (2024 & 2032)
- 7.1.2 Channel Mix Evolution (2024-2032)
Chapter 8. Regional Market Analysis – Global Overview
- 8.1 Global Regional Overview
- 8.1.1 Regional Volume Share
- 8.1.2 Regional Revenue Share
- 8.1.3 Regional Volume by Region
- 8.1.4 Regional Revenue by Region
- 8.1.5 Regional Forecast Through 2032
- 8.2 Cross-Regional Segment Analysis
- 8.2.1 By Distribution Channel
- 8.2.2 By Brand/Price Tier
Chapter 9. North America Head-Up Display (HUD) Market
- 9.1 United States
- 9.2 Canada
- 9.3 Mexico
Chapter 10. Europe Head-Up Display (HUD) Market
- 10.1 Germany
- 10.2 France
- 10.3 Italy
- 10.4 United Kingdom
- 10.5 Spain
- 10.6 Poland
- 10.7 Russia
- 10.8 Netherlands
- 10.9 Belgium
- 10.10 Sweden
- 10.11 Denmark
- 10.12 Norway
- 10.13 Rest of Europe
Chapter 11. Asia Pacific Head-Up Display (HUD) Market
- 11.1 China
- 11.2 India
- 11.3 Japan
- 11.4 South Korea
- 11.5 Thailand
- 11.6 Indonesia
- 11.7 Vietnam
- 11.8 Malaysia
- 11.9 Australia
- 11.10 Rest of Asia Pacific
Chapter 12. Latin America Head-Up Display (HUD) Market
- 12.1 Brazil
- 12.2 Argentina
- 12.3 Colombia
- 12.4 Chile
- 12.5 Rest of Latin America
Chapter 13. Middle East Head-Up Display (HUD) Market
- 13.1 Saudi Arabia
- 13.2 United Arab Emirates
- 13.3 Turkey
- 13.4 Israel
- 13.5 Iran
- 13.6 Rest of the Middle East
Chapter 14. Africa Head-Up Display (HUD) Market
- 14.1 South Africa
- 14.2 Egypt
- 14.3 Nigeria
- 14.4 Morocco
- 14.5 Rest of Africa
Chapter 15. Head-Up Display (HUD) Company Profiles
- 15.1 [Company 01]
- 15.1.1 Company Overview
- 15.1.2 Key Management Personnel
- 15.1.3 Products & Services Portfolio
- 15.1.4 Financial Performance
- 15.1.5 Key Market Focus & Geographic Presence
- 15.1.6 Recent Developments & Strategic Initiatives
Note: The company profile list is preliminary and may change based on research findings, market developments, data availability, and client requirements.
Chapter 16. Appendices
- Appendix A – List of Abbreviations & Acronyms
- Appendix B – Industry Classification Code Reference – Full Series
- Appendix C – Production & Capacity Data Tables
- Appendix D – End-Use & Demand Base Tables
- Appendix E – Consumption & Replacement Rate Assumptions
- Appendix F – ASP Reference Tables
- Appendix G – Manufacturing & Facility Database
- Appendix H – Import-Export Data Tables
- Appendix I – Regulatory Summary Tables
- Appendix J – Primary Research Participant List (Anonymized)
- Appendix K – Primary Research Questionnaire Framework
- Appendix L – Data Sources & Bibliography
- Appendix M – Market Size Divergence & Source Comparison
Chapter 17. Research Methodology
- 17.1 Research Framework & Philosophy
- 17.2 Secondary Research – Sources, Hierarchy & Data Extraction
- 17.3 Data Modeling – Bottom-Up & Top-Down Market Sizing
- 17.4 Primary Research – Stakeholder Framework, LOI & Sample Sizes
- 17.5 Forecast Methodology – Regression, Scenario & Sensitivity Analysis
- 17.6 Quality Control – Four-Layer Validation Framework
- 17.7 Limitations & Standard Assumptions
- 17.8 Disclaimer
