Market Overview:
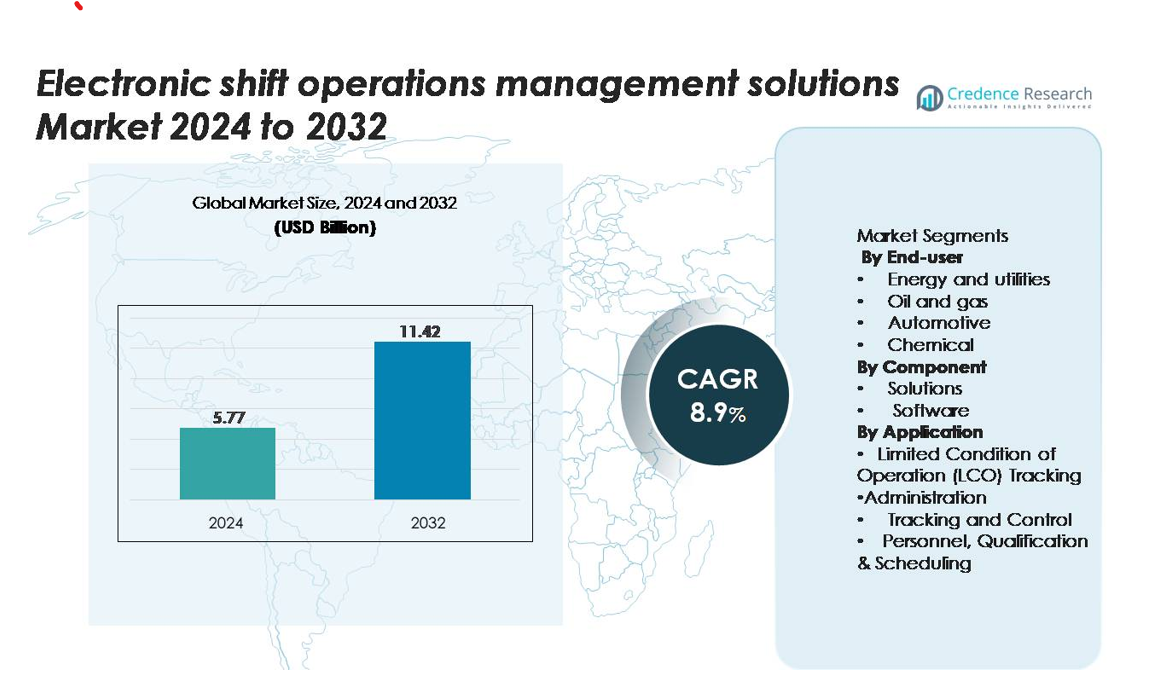
Electronic shift operations management solutions were valued at USD 5.77 billion in 2024 and are projected to reach USD 11.42 billion by 2032, growing at a CAGR of 8.9% during the forecast period.
| REPORT ATTRIBUTE |
DETAILS |
| Historical Period |
2020-2023 |
| Base Year |
2024 |
| Forecast Period |
2025-2032 |
| Electronic shift operations management solutions market Size 2024 |
USD 5.77 billion |
| Electronic shift operations management solutions market , CAGR |
8.9% |
| Electronic shift operations management solutions market Size 2032 |
USD 11.42 billion |
Leading players in the electronic shift operations management solutions market include Honeywell, Siemens, ABB, AVEVA, IBM, and Hexagon, along with niche software providers that deliver cloud-based shift scheduling, digital logbooks, and real-time monitoring tools. These companies focus on advanced analytics, mobile access, and cybersecurity to support high-risk industries such as oil and gas, power generation, and chemicals. North America holds the largest share of the global market at 35%, driven by strict compliance standards, strong digital adoption, and investments in remote operations. Europe follows with a steady share supported by renewable energy expansion and asset-intensive manufacturing, while Asia-Pacific remains the fastest-growing region due to rapid industrialization and modernization of utility networks.
Market Insights
- The market was valued at USD 5.77 billion in 2024 and will reach USD 11.42 billion by 2032, registering a CAGR of 8.9%.
- Rising automation in utilities, oil and gas, and chemicals fuels adoption as industries shift from paper logs to digital workflows that improve safety, compliance, and workforce productivity.
- Mobile applications, cloud platforms, and predictive analytics gain traction, while vendors integrate IoT sensors and digital logbooks for real-time monitoring and faster decision-making.
- Honeywell, Siemens, ABB, and AVEVA lead the competitive landscape with scalable solutions, while smaller providers offer modular software for mid-sized facilities; lack of skilled digital operators remains a restraint.
- North America leads with 35% share, Europe follows due to strict industrial regulations, and Asia-Pacific grows fastest with large-scale modernization; Energy and utilities remain the dominant end-user segment, and personnel scheduling holds the largest application share.
Access crucial information at unmatched prices!
Request your sample report today & start making informed decisions powered by Credence Research Inc.!
Download Sample
Market Segmentation Analysis:
By End-user:
Energy and utilities represent the dominant end-user segment and account for the largest market share due to high safety standards, asset reliability needs, and regulatory compliance requirements. Power plants and grid operators use ESOMS for shift handovers, fault logging, and remote monitoring of field crews. Oil and gas firms adopt digital shift logs and mobile reporting tools to improve workforce safety and reduce downtime in upstream and downstream operations. Automotive and chemical industries focus on production line visibility, quality checks, and equipment maintenance. Other sectors, including mining and manufacturing, deploy ESOMS to streamline workforce coordination and documentation.
- For instance, Hexagon AB’s j5 Shift Operations Management software has documented deployments at over 50 refining and petrochemical facilities, enabling standardised logbooks and incident reporting with a single enterprise database.
By Component:
Solutions hold the largest share in the component segment, driven by demand for centralized dashboards, workflow automation, digital shift logs, and alarm management systems. Industrial companies prefer scalable cloud or hybrid deployments to support remote access, reporting, and compliance records. Software platforms integrate analytics, personnel tracking, and maintenance scheduling to enhance productivity. Vendor-managed upgrades and cybersecurity features support long-term adoption. Service providers add training, customization, and 24×7 support, enabling industries to replace paper-based procedures with digital workflows.
- For instance, Hitachi Energy’s eSOMS suite includes electronic logbooks, controlled operating rounds, and shift-handover tools deployed across more than 430 industrial sites, delivering unified reporting and audit-ready records.
By Application:
Personnel, Qualification & Scheduling is the leading application segment, supported by workforce optimization needs and strict authorization requirements in critical industries. ESOMS platforms validate operator qualifications, automate scheduling, and reduce human error during shift transfers. LCO tracking supports real-time visibility into equipment limits and safety conditions, especially in power and petrochemical sites. Administration modules handle audit trails, documentation, and regulatory records. Tracking and control remain important for alarm logs, asset status, and operational instructions, helping companies reduce downtime and improve decision-making speed.
Key Growth Drivers
Rising Demand for Automation and Workforce Optimization
Industries adopt ESOMS to reduce manual workload and increase operational accuracy. Companies replace spreadsheets and paper logs with digital shift systems that support instant reporting and structured workflows. Automated shift scheduling, digital checklists, and audit-ready records help supervisors control workforce tasks. Real-time dashboards show open work orders, safety alerts, and equipment status, improving resource planning. Automation reduces shift delays and communication gaps between field and control room teams. Large plants benefit from coordinated handovers and fewer manual errors. These advantages push energy, utilities, and manufacturing firms to invest in advanced ESOMS platforms. Vendors expand product portfolios with cloud-native features and mobile access, making deployment faster. The push toward smart factories and digital control rooms further accelerates the adoption curve, creating long-term revenue potential for software suppliers.
- For instance, Hitachi Energy’s eSOMS platform manages electronic shift logs, operator rounds, and controlled procedures across more than 430 operational sites, providing timestamped entries and central audit trails for safety-critical plants.
Strong Focus on Regulatory Compliance and Safety Standards
Critical industries rely on strict safety rules, mandatory reporting, and audit trails. ESOMS platforms store operating logs, alarms, permits, and escalation steps in secure digital archives. Automated workflows ensure operators follow written instructions and qualification rules. Safety officers use dashboards to track incidents, protective measures, and maintenance alerts. Companies reduce non-compliance risk because activities remain documented and time-stamped. In power plants and refineries, authorized personnel handle specific machinery based on certifications stored in ESOMS. Government agencies also demand transparent traceability, which favors digital systems over manual documentation. Real-time monitoring and alerts help teams respond faster to failures and abnormal conditions. These features drive adoption in oil and gas, chemical plants, and energy utilities. The focus on accident prevention and compliance continues to push companies toward digital shift systems.
- For instance, IBM’s hybrid-cloud security framework offers the capability to encrypt operational data across Red Hat OpenShift clusters deployed in more than 60 global data centers, while supporting user-level authentication, access control, and digital certification records for machinery operators in regulated environments.
Growth in IoT, Cloud, and Mobile Deployments
Digital transformation plays a major role in market expansion. Cloud-based ESOMS allows remote access, mobile logging, and centralized control rooms. Operators use handheld devices to scan assets, update task status, and upload photos from the field. IoT sensors feed real-time performance and safety data into the platform, improving decision accuracy. Predictive analytics monitor equipment behavior and prevent downtime. Cloud deployment also lowers upfront investment and supports multi-site operations. Software updates, cybersecurity patches, and data backups remain managed by vendors. Mobility increases workforce speed and prevents communication gaps. These advantages attract industries with large distributed assets, such as pipelines, grids, and offshore platforms. Technology integration continues to create long-term market opportunities.
Key Trends & Opportunities
Expansion of AI, Predictive Analytics, and Digital Twins
AI-enabled ESOMS can analyze shift logs, alarms, and equipment health data to predict failure patterns. Digital twins simulate plant conditions, helping teams test operating steps before execution. Predictive alerts reduce downtime and unsafe conditions, which benefits energy, chemicals, and oil refineries. Supervisors gain better visibility into maintenance workloads and skill requirements. Historical data drives continuous improvement and supports training. Vendors embed machine learning modules inside dashboards to improve recommendations. These advanced capabilities create opportunities for premium software sales and subscription revenue. Companies look for smarter systems that improve output without hiring more staff.
- For instance, the IBM watsonx platform is designed to process operational data across diverse hybrid-cloud environments (rather than a specific number of data centers) and leverages a comprehensive Agent Catalog with over 150 pre-built AI agents and tools.
Growing Use of Mobile and Remote Operations
Mobile ESOMS supports field technicians and reduces manual paperwork. Workers update logs, attach images, scan equipment tags, and submit incident reports directly from mobile apps. Remote supervisors monitor task progress and confirm safety stages without physical presence. This trend supports unmanned plants, offshore assets, and large utility networks. Companies reduce travel time and accelerate work completion. Integration with wearables and augmented reality also gains interest for high-risk zones. Vendors explore partnerships with device manufacturers to add voice commands and hands-free entry. Mobile-focused deployments open new opportunities in small and mid-sized factories seeking affordable digital tools.
Key Challenges
Shortage of Skilled Professionals for Deployment and Maintenance
Many industries lack experienced staff who can manage advanced digital systems. ESOMS involves configuration, workflow mapping, cybersecurity controls, and network connectivity. Companies depend on trained operators, yet many workers come from non-digital backgrounds. The shift from paper logs to software requires change management and training. Smaller plants hesitate because they fear disruption during transition. System errors or incomplete adoption can lead to poor outcomes. Vendors respond with advisory services, training modules, and simplified interfaces. However, the skill gap remains a barrier for mass adoption in developing regions.
Cybersecurity and Data Protection Risks
ESOMS stores shift data, equipment logs, incident reports, and control instructions. Cyberattacks can expose operational records or interrupt plant activities. Cloud and mobile networks require encryption, access control, and continuous monitoring. Companies in critical sectors remain cautious when connecting plant systems to online platforms. Compliance rules demand strict data integrity and audit trails. Vendors invest in secure authentication, role-based access, and encrypted communication. Despite improvements, concerns about data breaches and operational disruption limit adoption in highly sensitive facilities. Firms require strong security assurances before approving digital transformation.
Regional Analysis
North America
North America holds the largest market share due to strong digital transformation programs in the energy, utilities, and oil and gas sectors. Power plants, refineries, and industrial facilities invest in ESOMS for compliance, workforce management, and predictive maintenance. Cloud adoption remains high, and companies use mobile-enabled shift logs and remote monitoring systems to optimize field operations. The presence of established software developers and automation vendors supports fast deployment. Strict safety regulations and audit requirements also drive the use of digital shift recording and real-time reporting tools across operations.
Europe
Europe accounts for a significant market share, supported by renewable energy expansion, environmental regulations, and industrial automation policies. Utilities adopt ESOMS to monitor distributed assets like wind parks, solar stations, and smart grids. Chemical manufacturers and automotive plants rely on shift automation to reduce downtime and meet worker safety standards. Strong emphasis on sustainability and digital reporting encourages paperless operations. EU regulatory rules demand traceable documentation, qualification checks, and audit trails, increasing ESOMS adoption across Germany, the United Kingdom, France, and Nordic countries, where industries prefer secure and scalable cloud platforms.
Asia-Pacific
Asia-Pacific shows strong growth momentum and captures a rising market share driven by rapid industrialization, expanding refinery capacity, and power sector modernization. Large utilities and oil companies deploy ESOMS to manage operational risks and enhance workforce productivity. China, India, Japan, and South Korea invest in cloud platforms, IoT integration, and mobile operation control. Manufacturing plants shift from manual logs to digital dashboards to reduce human error. Growing investment in smart factories and stricter safety rules influence adoption. Foreign and regional vendors collaborate with industrial users to offer cost-effective digital solutions and localized support services.
Middle East & Africa
The Middle East & Africa market continues to grow, supported by the oil, gas, and petrochemical sectors that require real-time reporting and strict compliance. ESOMS adoption helps refineries manage shift handovers, alarm logs, and safety procedures. Utilities adopt digital systems to maintain power reliability in large networks. Countries in the Gulf region invest in smart plant modernization and remote operations, driving higher market share. Africa shows gradual adoption as companies focus on reducing downtime and improving safety. Vendors offer cloud-based and mobile tools suited for distributed assets and field-intensive operations.
Latin America
Latin America holds a growing market share, led by modernization efforts in energy, mining, and chemical sectors. Utilities use ESOMS to streamline workforce scheduling and reduce operational disruptions. Oil-producing countries deploy digital shift logs to improve compliance and prevent safety incidents. Mobile adoption grows as field teams operate across remote sites. Industrial automation projects in Brazil, Mexico, Argentina, and Chile support market expansion. Companies adopt cloud platforms to lower infrastructure costs and gain centralized visibility into operations. Increasing focus on digital maintenance and qualification tracking further drives demand across regional industries.
Market Segmentations:
By End-user
- Energy and utilities
- Oil and gas
- Automotive
- Chemical
- Others
By Component
By Application
- Limited Condition of Operation (LCO) Tracking
- Administration
- Tracking and Control
- Personnel, Qualification & Scheduling
By Geography
- North America
- Europe
- Germany
- France
- U.K.
- Italy
- Spain
- Rest of Europe
- Asia Pacific
- China
- Japan
- India
- South Korea
- South-east Asia
- Rest of Asia Pacific
- Latin America
- Brazil
- Argentina
- Rest of Latin America
- Middle East & Africa
- GCC Countries
- South Africa
- Rest of the Middle East and Africa
Competitive Landscape
The competitive landscape features software developers, cloud platform providers, and industrial automation companies that offer integrated ESOMS solutions for centralized shift management and real-time operational control. Leading vendors focus on enhancing mobile accessibility, security, and predictive analytics to support critical industries such as oil and gas, energy, chemicals, and manufacturing. Cloud deployment, subscription pricing, and modular feature offerings help attract small and mid-sized plants transitioning from paper-based workflows. Partnerships with control system suppliers and IoT device manufacturers strengthen product portfolios and enable integration with alarms, maintenance systems, and digital twins. Companies also invest in cybersecurity controls, user training, and compliance features to secure sensitive operational data. As industries pursue broader digital transformation, vendors compete on scalability, ease of deployment, and automation depth, driving steady innovation across the market.
Shape Your Report to Specific Countries or Regions & Enjoy 30% Off!
Key Player Analysis
- Hitachi Ltd.
- Hexagon AB
- International Business Machines Corp.
- Honeywell International Inc.
- BMC Software Inc.
- Freshworks Inc.
- INTECH Process Automation Inc.
- Broadcom Inc.
- Issuu Inc.
- ABB Ltd.
Recent Developments
- In Jan 2025, Hitachi Ltd. Announced business-structure change effective April to become “digital-centric.
- In 2025, International Business Machines Corporation (IBM) launched enhanced hybrid-cloud and AI-agent capabilities to operationalise enterprise processes
Report Coverage
The research report offers an in-depth analysis based on End-User, Component, Application and Geography. It details leading market players, providing an overview of their business, product offerings, investments, revenue streams, and key applications. Additionally, the report includes insights into the competitive environment, SWOT analysis, current market trends, as well as the primary drivers and constraints. Furthermore, it discusses various factors that have driven market expansion in recent years. The report also explores market dynamics, regulatory scenarios, and technological advancements that are shaping the industry. It assesses the impact of external factors and global economic changes on market growth. Lastly, it provides strategic recommendations for new entrants and established companies to navigate the complexities of the market.
Future Outlook
- Adoption will rise as industries replace manual logs with fully digital shift systems.
- Cloud-based deployments will expand, supporting remote supervision and multi-site operations.
- AI will improve predictions for maintenance, alarms, and staffing requirements.
- Mobile and tablet interfaces will become standard for field reporting and shift handovers.
- Integration with IoT devices will enhance real-time tracking of equipment and safety conditions.
- Cybersecurity investments will increase to protect operational data and access controls.
- Training and user-friendly interfaces will help address the skill gap in industrial plants.
- Vendors will offer modular pricing to attract small and mid-sized facilities.
- Digital twins will support simulation, testing, and improved process planning.
- Regulatory compliance and traceable documentation will continue to drive market growth.


