Market Overview:
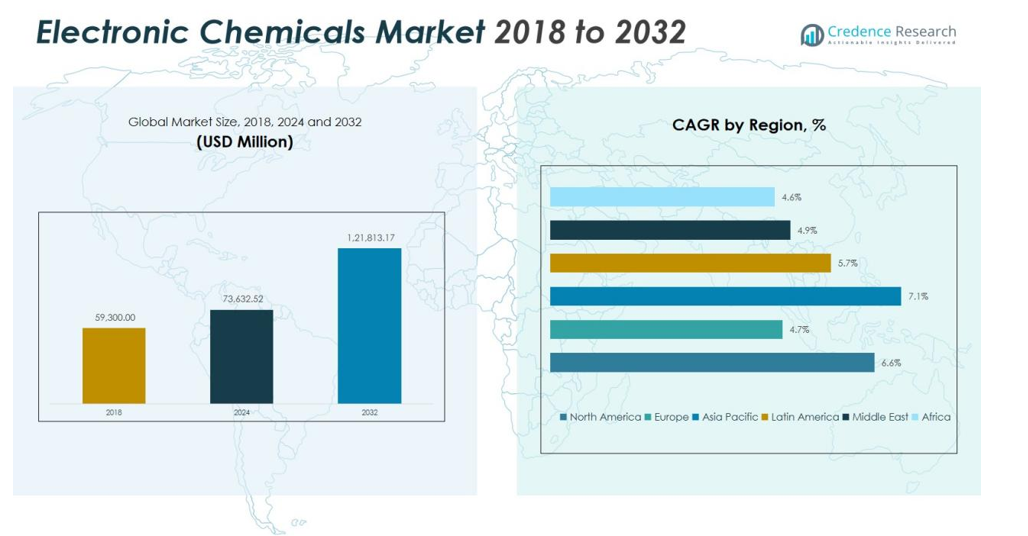
The Global Electronic Chemicals Market size was valued at USD 59,300.00 million in 2018 to USD 73,632.52 million in 2024 and is anticipated to reach USD 1,21,813.17 million by 2032, at a CAGR of 6.58% during the forecast period.
| REPORT ATTRIBUTE |
DETAILS |
| Historical Period |
2020-2023 |
| Base Year |
2024 |
| Forecast Period |
2025-2032 |
| Electronic Chemicals Market Size 2024 |
USD 73,632.52 million |
| Electronic Chemicals Market, CAGR |
6.58% |
| Electronic Chemicals Market Size 2032 |
USD 1,21,813.17 million |
Key market drivers include rising semiconductor production, miniaturization of electronic components, and growing investment in fabrication plants (fabs). The shift toward electric vehicles and renewable energy devices also fuels demand for specialty chemicals used in battery and photovoltaic applications. Continuous innovation in chemical formulations to enhance performance and purity standards supports industry advancement and helps meet stringent manufacturing requirements.
Regionally, Asia Pacific dominates the Global Electronic Chemicals Market due to its strong semiconductor manufacturing base in China, Japan, South Korea, and Taiwan. North America holds a significant share, supported by technological innovation and government funding in chip manufacturing. Europe shows steady growth, driven by industrial automation and rising investments in microelectronics and clean energy technologies.
Market Insights:
- The Global Electronic Chemicals Market was valued at USD 59,300.00 million in 2018, increased to USD 73,632.52 million in 2024, and is projected to reach USD 121,813.17 million by 2032, registering a CAGR of 6.58% during the forecast period.
- Asia Pacific holds 55% share of the market, driven by strong semiconductor manufacturing bases in China, Japan, South Korea, and Taiwan. North America accounts for 18% share, supported by government funding for chip production. Europe holds 15% share, led by industrial automation and expanding renewable energy applications.
- Asia Pacific remains the fastest-growing region with a CAGR of 7.1%, fueled by 5G, AI, and electric vehicle production. Its large-scale electronics manufacturing and ongoing fab expansions reinforce market leadership.
- By product, liquid chemicals dominate with over 45% share due to widespread use in wafer cleaning and photolithography.
- By end use, semiconductors and integrated circuits account for more than 60% share, reflecting strong demand from consumer electronics, data centers, and automotive electronics industries.
Access crucial information at unmatched prices!
Request your sample report today & start making informed decisions powered by Credence Research Inc.!
Download Sample
Market Drivers:
Rising Demand for Semiconductors and Integrated Circuits
The Global Electronic Chemicals Market benefits greatly from the surge in semiconductor and IC production. Expanding applications in smartphones, data centers, and connected devices increase the need for high-purity chemicals. It supports processes such as etching, cleaning, and doping used in chip fabrication. Growing adoption of advanced technologies like 5G, AI, and IoT continues to strengthen semiconductor manufacturing activities worldwide.
- For instance, to support the fabrication of chips with nodes below 10nm, chemical suppliers must now provide solutions that have metal contamination levels below 1 part per trillion.
Growth of Electric Vehicles and Renewable Energy Applications
The increasing transition toward electric mobility and renewable energy systems drives significant demand for specialty chemicals. These materials play a key role in producing batteries, sensors, and photovoltaic cells. It enhances conductivity, reliability, and energy efficiency in electric and solar components. Expanding EV infrastructure and solar power installations are fueling long-term market expansion.
Technological Advancements in Fabrication and Material Purity
Continuous innovation in manufacturing techniques improves chemical performance and purity levels. Advanced formulations are now designed to meet tighter specifications for microfabrication and miniaturization. It ensures improved yield and reduced contamination in wafer processing. Strong R&D investments by major producers support the evolution of eco-friendly and high-precision electronic materials.
- For instance, Merck KGaA announced an investment of over $72.8 million to build a new Advanced Materials Development Center in Japan, focusing on pioneering solutions for next-generation chip technologies.
Government Initiatives and Expanding Manufacturing Investments
Government programs promoting domestic semiconductor production are reshaping the supply chain landscape. Countries like the U.S., China, and India are offering incentives and infrastructure support for new fabs. It encourages regional production of high-quality chemicals and reduces reliance on imports. Increasing capital investments from both private and public sectors further accelerate market growth potential.
Market Trends:
Shift Toward Advanced Semiconductor Manufacturing and Miniaturization
The Global Electronic Chemicals Market is witnessing a strong transition toward advanced semiconductor node production. Rising demand for smaller, faster, and more energy-efficient chips drives the adoption of high-purity wet chemicals, photoresists, and gases. It supports extreme ultraviolet (EUV) lithography and advanced wafer etching techniques essential for sub-5nm process nodes. Manufacturers are focusing on cleaner production systems and precision chemical formulations to meet tighter process tolerances. The growing influence of artificial intelligence, IoT, and autonomous systems strengthens the need for complex microelectronic structures. Strategic collaborations between chemical producers and semiconductor fabricators are becoming more frequent to ensure material compatibility and reliability. This trend continues to shape investments in high-end process technologies across major manufacturing hubs.
- For instance, in September 2025, ASML and SK hynix installed the industry’s first commercial High-NA EUV lithography system at SK hynix’s M16 fab in South Korea.
Sustainability, Localization, and Supply Chain Optimization in Production
Global environmental policies and supply chain challenges are reshaping how electronic chemicals are produced and distributed. Increasing focus on sustainability is pushing producers to adopt low-emission, recyclable, and energy-efficient chemical processes. It aligns with the global movement toward green manufacturing and carbon-neutral semiconductor fabs. Companies are diversifying production bases to reduce dependency on single-source suppliers and minimize geopolitical disruptions. Localized manufacturing in regions like North America, Europe, and Southeast Asia is gaining momentum to ensure supply stability. Strategic partnerships are emerging to enhance recycling systems for solvents and gases used in fabrication. These sustainability-driven and regionally focused initiatives are redefining the long-term competitiveness of the market.
- For instance, TSMC is making significant strides in green manufacturing by implementing projects like converting residual hydrogen from its EUV process back into electricity.
Market Challenges Analysis:
High Production Costs and Stringent Quality Requirements
The Global Electronic Chemicals Market faces significant challenges from high manufacturing costs and strict purity standards. Producing chemicals for advanced semiconductor applications demands expensive equipment, cleanroom facilities, and complex purification systems. It requires continuous process optimization to maintain consistency and meet evolving technical specifications. Any deviation in chemical quality can disrupt wafer yields and increase operational losses for chip manufacturers. The need for ultra-high-purity materials also limits the number of qualified suppliers. This creates supply constraints and pricing volatility across the value chain. Maintaining competitiveness under such demanding conditions remains a core challenge for industry participants.
Supply Chain Vulnerability and Environmental Compliance Pressure
Geopolitical tensions and limited raw material availability have disrupted the global supply network for electronic chemicals. It exposes manufacturers to risks of delayed deliveries, cost fluctuations, and regional dependency. Stringent environmental regulations further increase compliance costs for chemical producers. Companies must invest in cleaner production technologies and safe waste management systems to meet sustainability goals. This transition often impacts short-term profitability while improving long-term resilience. Balancing regulatory obligations, environmental targets, and economic efficiency is a growing challenge for global market stakeholders.
Market Opportunities:
Expansion of Semiconductor Manufacturing and Emerging Technologies
The Global Electronic Chemicals Market holds strong opportunities from the expansion of global semiconductor fabrication capacity. Major economies are investing heavily in chip production to strengthen supply chain independence. It creates demand for advanced wet chemicals, gases, and photoresists tailored for next-generation nodes. Growth in artificial intelligence, quantum computing, and autonomous systems drives the need for high-performance microelectronics. Rising consumer electronics and data center investments further enhance market potential. Chemical producers that align with these technology trends can secure long-term supply contracts with major fabs. The increasing number of greenfield projects in Asia and North America supports sustained revenue growth.
Rising Focus on Sustainable and High-Purity Formulations
Growing emphasis on environmental responsibility and resource efficiency is opening new opportunities for innovation. It pushes manufacturers to develop eco-friendly chemical formulations that reduce waste and energy consumption. The shift toward closed-loop recycling and solvent recovery technologies is strengthening market differentiation. Demand for ultrapure materials in solar energy, batteries, and flexible electronics presents untapped growth avenues. Companies that offer safe, high-purity, and sustainable solutions are likely to gain a competitive edge. Strategic collaboration with semiconductor and photovoltaic manufacturers can further expand product reach. These sustainability-driven initiatives will define the future direction of the electronic chemicals industry.
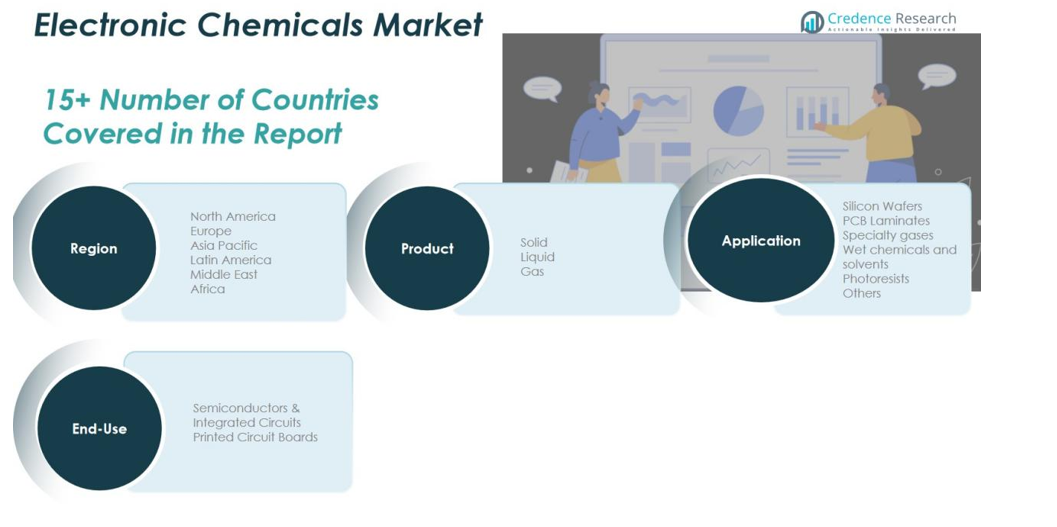
Market Segmentation Analysis:
By Product
The Global Electronic Chemicals Market includes solid, liquid, and gas segments that serve different functions in semiconductor and circuit manufacturing. Solid chemicals such as wafers and polishing materials are critical for substrate formation and precision finishing. Liquid chemicals, including etchants and cleaning agents, dominate the market due to their extensive use in wafer processing and photolithography. It also relies heavily on specialty gases used in etching, deposition, and doping processes that ensure high-performance chip output. The shift toward miniaturized electronic devices continues to drive growth across all product forms.
- For instance, leading manufacturers now produce ultra-thin silicon wafers with a thickness of just 100 micrometers, a key specification for fabricating the compact chips required in advanced electronics.
By Application
Key applications include silicon wafers, PCB laminates, specialty gases, wet chemicals and solvents, and photoresists. The silicon wafer segment accounts for a major share, driven by rising semiconductor fabrication globally. PCB laminates and wet chemicals support mass production in consumer electronics and automotive electronics. It benefits from ongoing expansion in high-end microprocessor and memory chip manufacturing. Specialty gases and photoresists are gaining traction with the adoption of advanced lithography techniques and smaller node sizes.
- For instance, in a significant advancement for next-generation manufacturing, researchers at the Cornell NanoScale Science and Technology Facility (CNF) used new photopatterning materials to achieve a feature size as small as 13 nanometers.
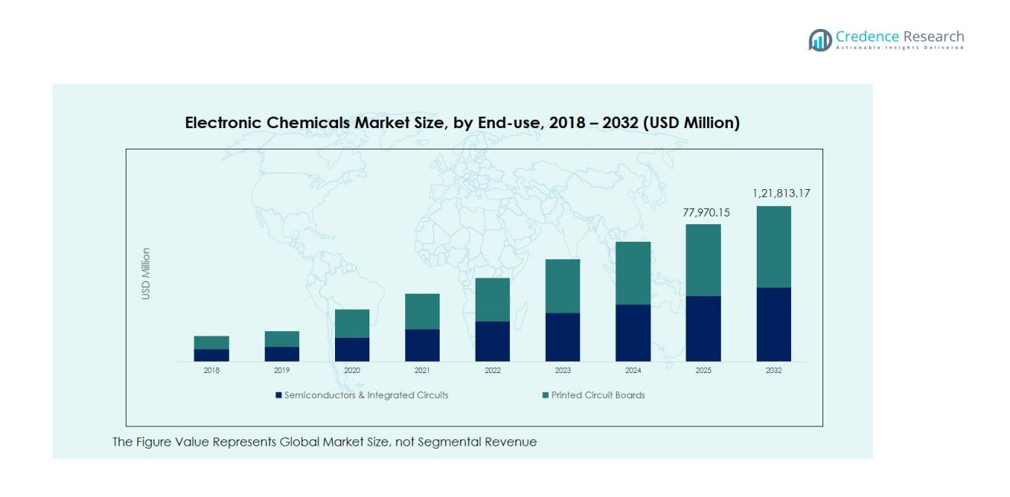
By End-Use
End-Use industries primarily include semiconductors & integrated circuits and printed circuit boards. The semiconductor segment leads due to the continuous demand for advanced chips in computing, telecom, and automotive systems. It drives the need for ultra-pure chemicals ensuring minimal contamination and superior circuit performance. The printed circuit board segment follows, supported by widespread applications in smart devices and industrial automation.
Segmentations:
By Product:
By Application:
- Silicon Wafers
- PCB Laminates
- Specialty Gases
- Wet Chemicals and Solvents
- Photoresists
- Others
By End-Use:
- Semiconductors & Integrated Circuits
- Printed Circuit Boards
By Region:
- North America
- Europe
- Germany
- France
- U.K.
- Italy
- Spain
- Rest of Europe
- Asia Pacific
- China
- Japan
- India
- South Korea
- South-east Asia
- Rest of Asia Pacific
- Latin America
- Brazil
- Argentina
- Rest of Latin America
- Middle East & Africa
- GCC Countries
- South Africa
- Rest of the Middle East and Africa
Regional Analysis:
North America
The North America Electronic Chemicals Market size was valued at USD 9,132.20 million in 2018 to USD 11,014.98 million in 2024 and is anticipated to reach USD 18,162.56 million by 2032, at a CAGR of 6.6% during the forecast period. North America holds 18% share of the Global Electronic Chemicals Market, driven by advanced semiconductor manufacturing and strong technological innovation. The U.S. leads due to its expanding investments in chip fabrication and R&D for next-generation electronics. It benefits from supportive government initiatives such as the CHIPS and Science Act, boosting domestic production. The region’s focus on high-purity materials and automation in fabs sustains long-term market growth. Canada and Mexico also contribute through growing electronics and automotive sectors.
Europe
The Europe Electronic Chemicals Market size was valued at USD 6,878.80 million in 2018 to USD 7,788.31 million in 2024 and is anticipated to reach USD 11,176.68 million by 2032, at a CAGR of 4.7% during the forecast period. Europe holds 15% share of the Global Electronic Chemicals Market, supported by strong industrial automation and renewable energy applications. Germany, France, and the UK are key contributors, with established semiconductor research hubs. It shows steady growth due to the adoption of electric vehicles and advanced PCB manufacturing. Government efforts to localize chip production are creating new opportunities for regional suppliers. The shift toward sustainable chemical production further strengthens Europe’s position.
Asia Pacific
The Asia Pacific Electronic Chemicals Market size was valued at USD 35,716.39 million in 2018 to USD 45,147.47 million in 2024 and is anticipated to reach USD 77,911.80 million by 2032, at a CAGR of 7.1% during the forecast period. Asia Pacific holds over 55% share of the Global Electronic Chemicals Market, led by China, Japan, South Korea, and Taiwan. The region’s strong semiconductor fabrication capacity and large-scale electronics manufacturing drive growth. It benefits from increasing investments in 5G, AI, and automotive electronics. Expanding consumer demand for smart devices and the rise of local chemical producers enhance competitiveness. India and Southeast Asia are emerging markets showing rapid expansion in production capabilities.
Latin America
The Latin America Electronic Chemicals Market size was valued at USD 4,151.00 million in 2018 to USD 5,109.36 million in 2024 and is anticipated to reach USD 7,902.02 million by 2032, at a CAGR of 5.7% during the forecast period. Latin America holds 6% share of the Global Electronic Chemicals Market, driven by increasing electronics manufacturing and renewable energy investments. Brazil and Mexico lead regional demand due to growth in consumer electronics and automotive production. It is gradually adopting advanced chemical processes and localized material sourcing. Rising government focus on industrial modernization supports market expansion. The region shows strong potential for specialty gases and wet chemical applications.
Middle East
The Middle East Electronic Chemicals Market size was valued at USD 1,838.30 million in 2018 to USD 2,105.41 million in 2024 and is anticipated to reach USD 3,058.18 million by 2032, at a CAGR of 4.9% during the forecast period. The Middle East holds 3% share of the Global Electronic Chemicals Market, supported by growing adoption of automation and renewable technologies. GCC countries are investing in industrial diversification and clean manufacturing. It is witnessing increasing collaboration with global semiconductor firms to build local processing facilities. Expansion in smart infrastructure and digital transformation strengthens demand for high-purity chemicals. Israel’s innovation ecosystem also contributes to niche electronics research and development.
Africa
The Africa Electronic Chemicals Market size was valued at USD 1,583.31 million in 2018 to USD 2,466.99 million in 2024 and is anticipated to reach USD 3,601.92 million by 2032, at a CAGR of 4.6% during the forecast period. Africa holds 3% share of the Global Electronic Chemicals Market, with gradual progress in electronics assembly and renewable energy projects. South Africa and Egypt are major contributors, focusing on consumer electronics and solar power systems. It faces challenges related to limited semiconductor infrastructure but benefits from improving trade access and industrial policies. Expanding manufacturing zones and rising investment in clean energy drive regional opportunities. The growing focus on technology transfer and training is expected to strengthen future market development.
Shape Your Report to Specific Countries or Regions & Enjoy 30% Off!
Key Player Analysis:
- Bayer AG
- Albemarle Corporation
- Ashland
- BASF SE
- Air Liquide Electronics
- Merck KGaA
- Honeywell International Inc.
- Cabot Corporation
- Linde PLC
- Dow
- Hitachi, Ltd.
- Sumitomo Chemical Co., Ltd.
- Monsanto Electronic Materials Co.
Competitive Analysis:
The Global Electronic Chemicals Market is characterized by strong competition among major multinational players focusing on innovation, capacity expansion, and strategic collaboration. Bayer AG and BASF SE emphasize developing sustainable chemical formulations and process efficiency to support semiconductor and electronic component manufacturing. Air Liquide Electronics and Merck KGaA lead in specialty gases and high-purity materials used in wafer cleaning and photolithography. It benefits from Albemarle Corporation’s expertise in advanced chemical production and Ashland’s focus on performance materials for microelectronics. Honeywell International Inc. invests in process automation and chemical purity improvement to enhance reliability in chip fabrication. Strategic partnerships, product differentiation, and regional expansions remain key competitive priorities across the industry.
Recent Developments:
- In October 2025, Bayer received approval from the U.S. Food and Drug Administration (FDA) for Lynkuet, its non-hormonal drug designed to treat moderate-to-severe hot flashes related to menopause.
- In July 2025, Ashland provided an update on its $60 million manufacturing network optimization plan, which involves closing facilities in Parlin and Chatham, New Jersey, and relocating production.
Report Coverage:
The research report offers an in-depth analysis based on Product, Application, End-Use and Region. It details leading market players, providing an overview of their business, product offerings, investments, revenue streams, and key applications. Additionally, the report includes insights into the competitive environment, SWOT analysis, current market trends, as well as the primary drivers and constraints. Furthermore, it discusses various factors that have driven market expansion in recent years. The report also explores market dynamics, regulatory scenarios, and technological advancements that are shaping the industry. It assesses the impact of external factors and global economic changes on market growth. Lastly, it provides strategic recommendations for new entrants and established companies to navigate the complexities of the market.
Future Outlook:
- The Global Electronic Chemicals Market will continue to grow due to expanding semiconductor manufacturing and advanced fabrication technologies.
- Rising adoption of AI, IoT, and 5G applications will boost demand for high-purity electronic materials.
- Sustainable and eco-friendly chemical formulations will gain importance amid stricter environmental regulations.
- Increased government incentives for domestic chip production will reshape global supply networks.
- It will witness more investments in high-end lithography and advanced node production below 5nm.
- Automation and digital monitoring in fabs will enhance process control and chemical efficiency.
- Mergers and partnerships among chemical producers and semiconductor firms will strengthen product innovation.
- Growing electric vehicle and renewable energy sectors will drive the use of specialty gases and solvents.
- Emerging economies in Asia and Latin America will become major hubs for chemical production expansion.
- It will focus on circular economy initiatives such as solvent recovery and waste reduction to improve sustainability.


