
Market Overview
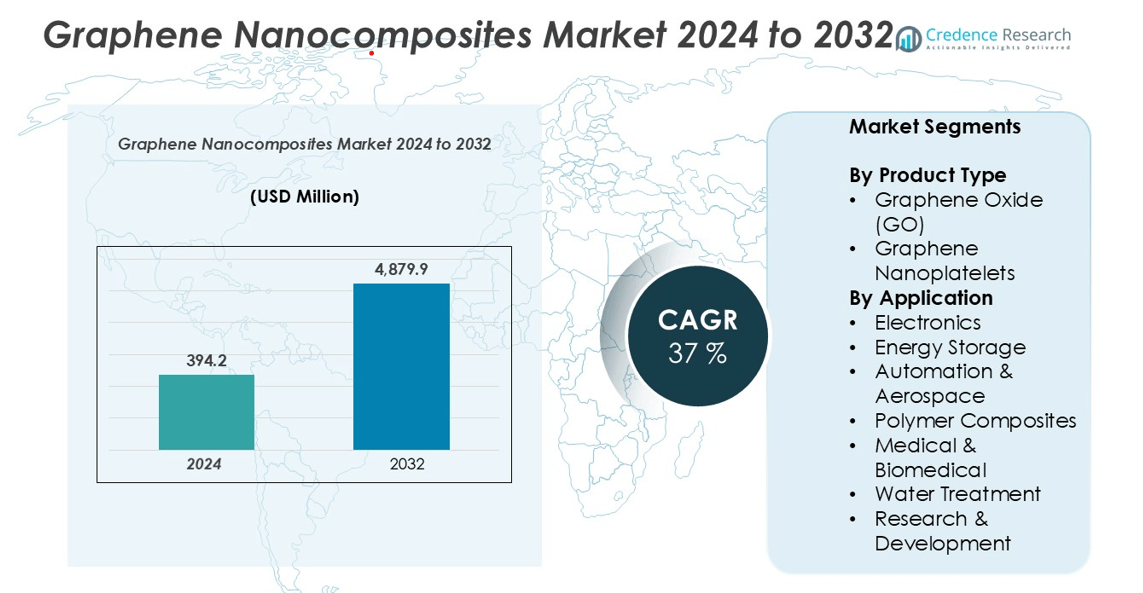
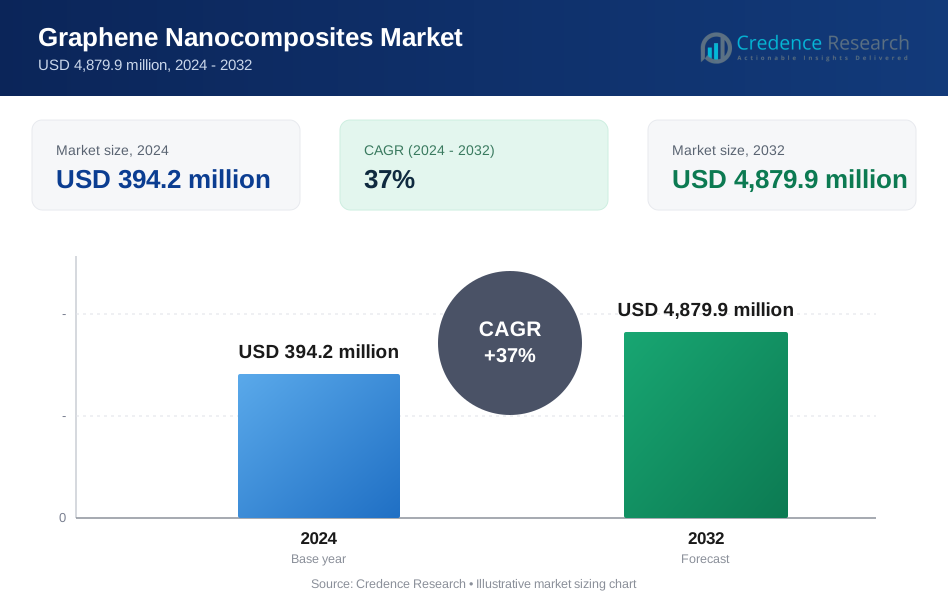
The graphene nanocomposites market size was valued at USD 394.2 million in 2024 and is anticipated to reach USD 4,879.9 million by 2032, growing at a CAGR of 37% during the forecast period (2025–2032).
| REPORT ATTRIBUTE | DETAILS |
|---|---|
| Historical Period | 2020-2023 |
| Base Year | 2024 |
| Forecast Period | 2025-2032 |
| Graphene Nanocomposites Market Size 2024 | USD 394.2 million |
| Graphene Nanocomposites Market, CAGR | 37% |
| Graphene Nanocomposites Market Size 2032 | USD 4,879.9 million |
The global graphene nanocomposites market is led by key players such as NanoXplore Inc., XG Sciences Inc., Haydale Graphene Industries Plc, Versarien Plc, Graphenea S.A., and Applied Graphene Materials Plc, along with emerging competitors like Talga Resources Ltd., Taiwan Graphene Co., Ltd., Ningbo Moxi Technology Co., Ltd., and GrapheneTech, S.L. These companies focus on technological innovation, large-scale production, and strategic collaborations to enhance product performance and market penetration. Asia-Pacific dominates the global market with a 35% share in 2024, followed by North America (30%) and Europe (25%), driven by strong industrial infrastructure, government support for nanotechnology research, and rising adoption in energy storage, automotive, and electronics sectors.
Market Insights
- The global graphene nanocomposites market was valued at USD 394.2 million in 2024 and is projected to reach USD 4,879.9 million by 2032, growing at a CAGR of 37% during the forecast period.
- Market growth is driven by rising demand for lightweight, high-strength materials across automotive, aerospace, and electronics industries, coupled with increasing adoption in energy storage and polymer composites.
- Key trends include advancements in graphene production technologies, expansion in biomedical and water treatment applications, and growing investments in sustainable and smart manufacturing solutions.
- The market is moderately fragmented, with major players such as NanoXplore Inc., XG Sciences Inc., Haydale Graphene Industries Plc, and Graphenea S.A. focusing on innovation, partnerships, and cost-effective production to gain a competitive edge.
- Asia-Pacific leads the market with 35% share, followed by North America (30%) and Europe (25%), while polymer composites dominate the application segment with the largest revenue share.
Market Segmentation Analysis:
By Product Type:
The graphene nanocomposites market is segmented into graphene oxide (GO) and graphene nanoplatelets. Among these, graphene nanoplatelets held the dominant market share in 2024, attributed to their superior electrical and thermal conductivity, mechanical strength, and ease of integration into polymer matrices. Their widespread use in conductive coatings, structural composites, and energy storage applications drives segment growth. In contrast, graphene oxide is gaining traction for its excellent dispersibility and functionalization potential, particularly in biomedical and water treatment applications, further broadening the market scope.
- For instance, XG Sciences, a former manufacturer of graphene nanoplatelets, ceased operations in July 2022. Its assets, including a patent portfolio and manufacturing equipment, were acquired by NanoXplore in August 2022. NanoXplore commissioned a large-scale facility with a capacity of 4,000 metric tons per year in 2020, making it one of the world's leading graphene manufacturers.
By Application:
The market is segmented into electronics, energy storage, automation & aerospace, polymer composites, medical & biomedical, water treatment, and research & development. The polymer composites segment dominated the market in 2024, accounting for the largest revenue share. This dominance is driven by the increasing demand for lightweight, high-strength materials in automotive, aerospace, and construction industries. Graphene nanocomposites enhance the mechanical, electrical, and barrier properties of polymers, enabling improved durability and performance. The electronics and energy storage segments are also expanding rapidly, supported by advancements in conductive and high-capacity materials.
- For instance, Directa Plus supplied its G+ graphene to Iterchimica for polymer-modified asphalt composites used in over 250 kilometers of European road networks, demonstrating improved elasticity and crack resistance under extreme temperatures.
Key Growth Drivers
Rising Demand for High-Performance Materials in Automotive and Aerospace Sectors
The increasing adoption of lightweight and durable materials in automotive and aerospace industries is a major growth driver for the graphene nanocomposites market. Graphene’s exceptional mechanical strength, thermal conductivity, and electrical properties make it ideal for enhancing polymer composites used in structural components, coatings, and electronic systems. Automakers and aircraft manufacturers are integrating graphene nanocomposites to reduce weight, improve fuel efficiency, and enhance overall performance. The growing focus on sustainability and emission reduction further amplifies demand for graphene-based materials as a viable alternative to conventional metals and composites.
- For instance, Ford Motor Company announced in 2018 that it would use graphene-infused foams in select vehicle models, such as the F-150 and Mustang, to help reduce noise, improve durability, and decrease vehicle weight.
Expanding Applications in Energy Storage and Electronics
The rapid development of advanced batteries, supercapacitors, and electronic devices is propelling the use of graphene nanocomposites. Their superior electrical conductivity and large surface area enhance charge transport and storage capacity, making them ideal for next-generation lithium-ion batteries and flexible electronics. As the global push for renewable energy and electric mobility accelerates, manufacturers are increasingly incorporating graphene-based materials to achieve higher energy densities and faster charging capabilities. Continuous innovations in conductive inks, sensors, and transparent electrodes further expand the commercial potential of graphene nanocomposites in electronics.
- For instance, Researchers at Nagaland University, in collaboration with other institutions, developed a cost-effective method for producing aminated graphene from reduced graphene oxide under moderate conditions, which demonstrated favorable electrochemical properties for supercapacitor applications.
Increasing Investment in Research and Development Activities
Rising global investments in R&D initiatives are fostering innovation and commercialization in the graphene nanocomposites market. Governments, research institutions, and private companies are collaborating to improve production efficiency, material uniformity, and cost-effectiveness. These efforts are enabling scalable manufacturing techniques such as chemical vapor deposition and solution-based synthesis, reducing the overall production cost of graphene materials. Moreover, ongoing research into hybrid graphene composites is unlocking new applications in biomedicine, water purification, and construction. The growing emphasis on performance optimization and environmental sustainability continues to drive R&D spending, strengthening the long-term market outlook.
Key Trends & Opportunities
Growing Adoption in Sustainable and Smart Manufacturing
A significant trend shaping the graphene nanocomposites market is their integration into sustainable and smart manufacturing processes. Industries are increasingly focusing on developing eco-friendly materials that offer superior performance without compromising recyclability. Graphene nanocomposites enable reduced energy consumption and improved material efficiency, aligning with global sustainability goals. Furthermore, the adoption of Industry 4.0 technologies, including additive manufacturing and nanotechnology, is expanding opportunities for customized graphene-based materials. These innovations support the creation of high-precision components used in electronics, medical devices, and transportation, fostering growth across emerging industrial applications.
- For instance, Log9 Materials, an Indian nanotechnology company, has developed aluminum–air batteries and supercapacitors utilizing graphene-based materials, contributing to sustainable energy solutions.
Expansion in Biomedical and Water Treatment Applications
The versatility of graphene nanocomposites is opening new opportunities in biomedical and water purification sectors. Their biocompatibility, antimicrobial activity, and high surface area make them suitable for drug delivery systems, biosensors, and tissue engineering applications. In water treatment, graphene oxide-based nanocomposites exhibit exceptional adsorption and filtration capabilities, addressing global challenges of clean water accessibility. Increasing environmental concerns and healthcare advancements are driving investments in these areas. As research progresses, the commercial viability of graphene-enhanced membranes and medical devices is expected to strengthen, broadening the market’s application base and profitability.
- For instance, Lockheed Martin patented its Perforene graphene membrane technology in 2013, with a theoretical potential to reduce energy consumption in desalination by 10% to 20%. The technology never became a commercial product.
Key Challenges
High Production Costs and Scalability Issues
their promising properties, the widespread adoption of graphene nanocomposites is hindered by high production costs and scalability limitations. Manufacturing processes such as chemical vapor deposition and exfoliation require significant capital investment and complex equipment, restricting mass production. Achieving uniform dispersion of graphene within composite matrices also poses technical challenges that affect product quality and performance consistency. These factors make graphene nanocomposites expensive compared to traditional materials, limiting their penetration into cost-sensitive industries. Overcoming these challenges through process optimization and cost-efficient synthesis methods remains a critical focus for market players.
Lack of Standardization and Regulatory Frameworks
The absence of standardized production protocols and regulatory guidelines poses a major challenge to the graphene nanocomposites market. Variations in material quality, purity, and structural characteristics across manufacturers lead to inconsistent performance outcomes. Additionally, limited clarity regarding environmental and health impacts of graphene-based materials restricts their approval for widespread industrial and biomedical use. The development of global standards for testing, labeling, and safety compliance is essential to ensure reliability and consumer confidence. Establishing comprehensive regulations and certifications will be crucial in facilitating broader commercialization and fostering sustainable market growth.
Regional Analysis
North America:
North America held a significant market share of over 30% in 2024, driven by strong demand for advanced materials in aerospace, automotive, and electronics industries. The United States leads the regional market, supported by robust R&D investments, presence of major graphene manufacturers, and increasing adoption of lightweight composite materials. Favorable government initiatives promoting nanotechnology research and sustainable manufacturing further strengthen regional growth. Additionally, the growing use of graphene nanocomposites in energy storage systems and flexible electronics positions North America as a key innovation hub in the global market.
Europe:
Europe accounted for approximately 25% of the global graphene nanocomposites market in 2024, propelled by technological advancements and sustainability-driven industrial policies. The United Kingdom, Germany, and France are major contributors due to their strong automotive and aerospace manufacturing bases. European research institutions are actively collaborating with private companies to develop cost-effective, scalable graphene production methods. The region’s focus on reducing carbon emissions and promoting green materials fuels demand in polymer composites and energy applications, positioning Europe as a leading center for graphene innovation and commercialization.
Asia-Pacific:
Asia-Pacific dominated the global graphene nanocomposites market with a market share exceeding 35% in 2024, owing to rapid industrialization, expanding electronics production, and supportive government policies. China, Japan, and South Korea are key players, leveraging large-scale manufacturing capabilities and growing investments in nanotechnology. The increasing adoption of graphene nanocomposites in electric vehicles, batteries, and consumer electronics drives regional growth. Additionally, favorable research funding and collaborations between academia and industry enhance innovation potential, making Asia-Pacific the fastest-growing region in the global market during the forecast period.
Latin America:
Latin America captured around 5% of the global graphene nanocomposites market in 2024, with growth primarily driven by emerging industrial sectors in Brazil and Mexico. Rising investments in renewable energy, automotive, and construction industries are stimulating demand for graphene-reinforced materials. Although the market is still in its nascent stage, expanding partnerships with international technology providers are fostering knowledge transfer and infrastructure development. Governments across the region are increasingly supporting nanotechnology research, which is expected to create future opportunities for graphene nanocomposite applications in energy storage and sustainable materials.
Middle East & Africa:
The Middle East & Africa region accounted for nearly 5% of the global graphene nanocomposites market in 2024, supported by growing investments in advanced materials, energy, and water treatment applications. Countries such as the United Arab Emirates and South Africa are investing in research programs to diversify their economies and enhance technological capabilities. The adoption of graphene nanocomposites in desalination, construction, and renewable energy projects is gaining traction. Although limited by infrastructural and cost challenges, the region holds promising potential for future growth, particularly as sustainability and innovation initiatives expand.
Market Segmentations:
By Product Type
- Graphene Oxide (GO)
- Graphene Nanoplatelets
By Application
- Electronics
- Energy Storage
- Automation & Aerospace
- Polymer Composites
- Medical & Biomedical
- Water Treatment
- Research & Development
By Geography
- North America
- U.S.
- Canada
- Europe
- Germany
- France
- Italy
- U.K.
- Russia
- Rest of Europe
- Asia-Pacific
- India
- China
- Japan
- Rest of Asia-Pacific
- Latin America
- Brazil
- Mexico
- Rest of Latin America
- Middle East and Africa
- GCC Countries
- South Africa
- Rest of Middle East and Africa
Competitive Landscape
The graphene nanocomposites market is highly competitive and moderately fragmented, with several key players focusing on innovation, strategic collaborations, and capacity expansion to strengthen their market positions. Leading companies such as NanoXplore Inc., XG Sciences Inc., Haydale Graphene Industries Plc, Versarien Plc, and Graphenea S.A. are actively investing in research and development to enhance product quality and scalability. These firms are leveraging partnerships with automotive, aerospace, and electronics manufacturers to expand application scope and commercial reach. Emerging players like Talga Resources Ltd. and Applied Graphene Materials Plc are emphasizing sustainable and cost-efficient production technologies. Additionally, regional companies in Asia-Pacific, such as Taiwan Graphene Co., Ltd. and Ningbo Moxi Technology Co., Ltd., are strengthening their presence through innovation and government-supported initiatives. Intense competition, continuous technological advancement, and growing demand for high-performance composites are driving consolidation and product differentiation across the global graphene nanocomposites industry.
Key Player Analysis
- Applied Graphene Materials Plc
- Graphenea S.A.
- GrapheneTech, S.L.
- Haydale Graphene Industries Plc
- NanoXplore, Inc
- Ningbo Moxi Technology Co., Ltd
- Taiwan Graphene Co., Ltd
- Talga Resources Ltd.
- Versarien Plc
- XG Sciences Inc
Recent Developments
- In December 2023, NanoXplore Inc. announced the successful commissioning of two anode material pilot lines, which will help the company achieve sustainable energy storage solutions.
- In November 2023, Versarien PLC introduced Polygrene, an innovative collection of thermoplastic polymer compositions based on graphene and related nanomaterials.
- In June 2022, Graphenea and Grapheal joined forces to quicken the study on biosensors with GraphLAB, a graphene-based product. GraphLAB is a next-gen assessment method for protein disease and screening detection
Report Coverage
The research report offers an in-depth analysis based on Product Type, Application, and Geography. It details leading market players, providing an overview of their business, product offerings, investments, revenue streams, and key applications. Additionally, the report includes insights into the competitive environment, SWOT analysis, current market trends, as well as the primary drivers and constraints. Furthermore, it discusses various factors that have driven market expansion in recent years. The report also explores market dynamics, regulatory scenarios, and technological advancements that are shaping the industry. It assesses the impact of external factors and global economic changes on market growth. Lastly, it provides strategic recommendations for new entrants and established companies to navigate the complexities of the market.
Future Outlook
- The graphene nanocomposites market is expected to experience strong growth driven by rising demand for advanced materials across major industries.
- Increasing adoption in automotive and aerospace sectors will enhance the use of lightweight and durable composites.
- Expanding applications in energy storage and electronics will support the development of high-performance devices.
- Ongoing research in biomedical and water treatment fields will create new commercial opportunities.
- Technological advancements will improve large-scale production efficiency and material consistency.
- Growing investments in sustainable manufacturing will boost demand for eco-friendly graphene-based solutions.
- Strategic partnerships between manufacturers and research institutions will accelerate innovation and product commercialization.
- Asia-Pacific will remain the dominant regional market, supported by rapid industrialization and government initiatives.
- North America and Europe will continue to drive innovation through strong R&D and regulatory support.
- Increased standardization and cost reduction efforts will make graphene nanocomposites more accessible globally.
Request a Free Sample
Fill in your details and we'll send you a free sample report.
- Sample data tables & charts
- Research methodology
Need a Custom Version of This Report?
Tailor the scope, geography, or segments to your exact requirements.
- Custom geography or segment scope
- Direct access to our analyst team
Frequently Asked Questions
What is the current market size for Graphene nanocomposites market, and what is its projected size in 2032?
At what Compound Annual Growth Rate is the Graphene nanocomposites market projected to grow between 2025 and 2032?
Which Graphene nanocomposites market segment held the largest share in 2024?
What are the primary factors fueling the growth of the Graphene nanocomposites market?
Who are the leading companies in the Graphene nanocomposites market?
Which region commanded the largest share of the Graphene nanocomposites market in 2024?
Table of Content
Chapter 1. Report Introduction
- 1.1 Report Description & Purpose
- 1.1.1 Report Title & Market Definition
- 1.1.2 Unique Selling Propositions (USP) & Key Differentiators
- 1.1.3 Value Proposition for Stakeholders
- 1.2 Research Objectives
- 1.2.1 Market Sizing Objectives (Volume & Revenue)
- 1.2.2 Segmentation Objectives
- 1.2.3 Competitive Intelligence Objectives
- 1.2.4 Forecast & Scenario Objectives
- 1.3 Report Scope
- 1.3.1 Graphene Nanocomposites Scope – Types & Subtypes Covered
- 1.3.2 Geographic Scope – Regions & Countries Covered
- 1.3.3 Historical Period, Base Year & Forecast Period (2024; forecast to 2032)
- 1.3.4 Inclusions & Exclusions
- 1.4 HS Code & Classification Framework
- 1.5 Currency, Units & Pricing Basis
- 1.6 Target Stakeholders
- 1.7 Limitations & Assumptions
Chapter 2. Executive Summary
- 2.1 Global Graphene Nanocomposites Market Snapshot
- 2.1.1 Market Size – Historical (2024) & Forecast (2024-2032) (2024: USD 394.2 million → 2032: USD 4,879.9 million)
- 2.1.2 Volume & Revenue – Global Totals
- 2.1.3 Key Market Highlights – Top Five Facts
- 2.2 Graphene Nanocomposites Market Segmentation Snapshot
- 2.2.1 Market Split by Region – 2024 vs. 2032
- 2.3 Competitive Snapshot
- 2.3.1 Top 10 Players by Revenue Share – 2024
- 2.3.2 Top 10 Players by Volume Share – 2024
- 2.3.3 Recent Strategic Developments (18-Month Summary)
- 2.4 Key Investment Highlights & Strategic Conclusions
Chapter 3. Graphene Nanocomposites Market Dynamics & Industry Analysis
- 3.1 Market Overview & Context
- 3.1.1 Graphene Nanocomposites Market Position in the Broader Automotive Value Chain
- 3.1.2 OEM vs. Replacement Market Dynamics
- 3.1.3 Market Maturity & Development Stage by Region
- 3.2 Graphene Nanocomposites Market Drivers
- 3.3 Graphene Nanocomposites Market Restraints & Challenges
- 3.4 Graphene Nanocomposites Market Opportunities
- 3.5 Porter's Five Forces Analysis
- 3.5.1 Threat of New Entrants
- 3.5.2 Bargaining Power of Suppliers
- 3.5.3 Bargaining Power of Buyers
- 3.5.4 Threat of Substitutes
- 3.5.5 Competitive Rivalry – Intensity Assessment
- 3.6 Graphene Nanocomposites Value Chain Analysis
- 3.6.1 Upstream – Raw Material/Input Suppliers
- 3.6.1.1 Raw Material/Input 1
- 3.6.1.2 Raw Material/Input 2
- 3.6.1.3 Raw Material/Input 3
- 3.6.2 Midstream – Production/Manufacturing/Service Delivery
- 3.6.2.1 Production/Process Overview
- 3.6.2.2 Key Facility Locations & Capacity by Manufacturer
- 3.6.3 Downstream – Distribution & End Consumer
- 3.6.3.1 Primary Channel – B2B/OEM
- 3.6.3.2 Secondary Channels – Dealer, Retail, Online, Direct
- 3.6.4 Value Chain Profitability Analysis
- 3.6.1 Upstream – Raw Material/Input Suppliers
- 3.7 PESTEL Analysis
- 3.7.1 Political Factors
- 3.7.2 Economic Factors
- 3.7.3 Social Factors
- 3.7.4 Technological Factors
- 3.7.5 Environmental Factors
- 3.7.6 Legal Factors
- 3.8 Graphene Nanocomposites Supply Chain Analysis
- 3.8.1 Raw Material/Input Supply Risk Assessment
- 3.8.2 Manufacturing Concentration Risk (Geographic Exposure)
- 3.8.3 Trade Disruption Impact Analysis
- 3.9 Regulatory & Policy Landscape
Note: The regulatory and policy landscape section covers regulations based on their applicability to the market, Graphene Nanocomposites category, geography, and scope of the study. Only regulatory frameworks with a material impact on operations, compliance, trade, sustainability, or market access are analyzed in detail.
Chapter 4. Key Investment Pockets & Opportunity Analysis
- 4.1 Graphene Nanocomposites Market Attractiveness Analysis
- 4.1.1 By Region – Investment Attractiveness Matrix (Volume × CAGR)
- 4.2 Absolute Revenue Growth Opportunity
- 4.2.1 By Region – Absolute USD Growth Through 2032
- 4.3 Incremental Volume Opportunity
- 4.3.1 By Region – Incremental Volume Through 2032
- 4.3.2 Segment – Incremental Volume
- 4.4 Emerging Submarket Opportunity Deep Dive (Subject to Applicability)
- 4.5 Emerging Market Opportunity Scorecards
- 4.5.1 United States
- 4.5.2 Europe
- 4.5.3 Asia
- 4.5.4 Middle East & Africa
Note: Emerging Market Opportunity Scorecards will be included based on relevance and strategic importance. Regions listed are indicative and may vary depending on data availability and market dynamics.
Chapter 5. Graphene Nanocomposites Import-Export Analysis & Trade Flows
- 5.1 Global Trade Overview
- 5.1.1 Global Export Value by Country (2024)
- 5.1.2 Global Export Volume by Country (2024)
- 5.1.3 Global Import Value by Country (2024)
- 5.1.4 Global Import Volume by Country (2024)
- 5.1.5 Net Trade Balance by Country (2024)
- 5.2 Export Analysis – Segment
- 5.2.1 Type 1 (HS Code)
- 5.2.2 Type 2 (HS Code)
- 5.2.3 Type 3 (HS Code)
- 5.2.4 Type 4 (HS Code)
- 5.2.5 Type 5 (HS Code)
- 5.3 Import Analysis – Segment
- 5.3.1 Type 1 (HS Code)
- 5.3.2 Type 2 (HS Code)
- 5.3.3 Type 3 (HS Code)
- 5.3.4 Type 4 (HS Code)
- 5.3.5 Type 5 (HS Code)
- 5.4 Average Unit Trade Prices
- 5.4.1 Average Export Price – Segment & Country
- 5.4.2 Average Import Price – Segment & Source Country
- 5.4.3 Price Trends (2024)
- 5.5 Key Trade Route Analysis
- 5.5.1 Trade Route 1
- 5.5.2 Trade Route 2
- 5.5.3 Trade Route 3
- 5.5.4 Trade Route 4
- 5.5.5 Trade Route 5
- 5.6 Trade Policy Impact Assessment
- 5.6.1 US Anti-Dumping & Section 301 Tariffs
- 5.6.2 EU Customs Union Impact
- 5.6.3 Major Free Trade Agreements
- 5.6.4 USMCA Rules of Origin
Note: Trade policy analysis will be included only where relevant to the Graphene Nanocomposites market.
Chapter 6. Competitive Landscape & Company Benchmarking
- 6.1 Graphene Nanocomposites Market Concentration & Structure
- 6.1.1 Herfindahl-Hirschman Index (HHI) – vs. 2024
- 6.1.2 Tier 1, Tier 2 & Tier 3 Market Structure
- 6.1.3 Global, Regional & Local Player Dynamics
- 6.2 Graphene Nanocomposites Market Share Analysis – 2024
- 6.2.1 Global Revenue Share by Company
- 6.2.2 Global Volume Share by Company
- 6.2.3 Regional Revenue Share
- 6.2.4 Market Share Evolution ( vs. 2024)
- 6.2.5 OEM Segment Share by Company
- 6.2.6 Replacement Segment Share by Company
- 6.3 Production/Delivery Capacity & Facility Analysis
- 6.3.1 Global Installed Capacity
- 6.3.2 Capacity Utilization Rates
- 6.3.3 Production/Output Volume
- 6.3.4 Facility Locations & Capacity Map
- 6.3.5 Planned Capacity Additions
- 6.4 Graphene Nanocomposites Competitive Benchmarking Matrix
- 6.4.1 Revenue, Volume, CAGR & Profitability Comparison
- 6.4.2 Channel Revenue Mix
- 6.4.3 Geographic Revenue Exposure
- 6.4.4 R&D Intensity
- 6.4.5 Sustainability Maturity
- 6.5 Strategic Developments in Graphene Nanocomposites (Last 24 Months)
- 6.5.1 Mergers, Acquisitions & Divestments
- 6.5.2 New Graphene Nanocomposites Launches
- 6.5.3 Facility Expansions
- 6.5.4 Strategic Alliances, Joint Ventures & Partnerships
- 6.5.5 Distribution Expansion & Market Entry
- 6.5.6 Sustainability & ESG Initiatives
- 6.6 Competitive Strategy Mapping
- 6.6.1 Leader, Challenger, Follower & Niche Classification
- 6.6.2 Pricing Strategy Comparison
- 6.6.3 Channel Strategy Matrix
Note: Strategic developments are included based on their materiality and the availability of reliable information.
Chapter 7. Global Graphene Nanocomposites Market – By Distribution Channel
- 7.1 Segment Overview
- 7.1.1 Volume & Revenue Split by Channel (2024 & 2032)
- 7.1.2 Channel Mix Evolution (2024-2032)
Chapter 8. Regional Market Analysis – Global Overview
- 8.1 Global Regional Overview
- 8.1.1 Regional Volume Share
- 8.1.2 Regional Revenue Share
- 8.1.3 Regional Volume by Region
- 8.1.4 Regional Revenue by Region
- 8.1.5 Regional Forecast Through 2032
- 8.2 Cross-Regional Segment Analysis
- 8.2.1 By Distribution Channel
- 8.2.2 By Brand/Price Tier
Chapter 9. North America Graphene Nanocomposites Market
- 9.1 United States
- 9.2 Canada
- 9.3 Mexico
Chapter 10. Europe Graphene Nanocomposites Market
- 10.1 Germany
- 10.2 France
- 10.3 Italy
- 10.4 United Kingdom
- 10.5 Spain
- 10.6 Poland
- 10.7 Russia
- 10.8 Netherlands
- 10.9 Belgium
- 10.10 Sweden
- 10.11 Denmark
- 10.12 Norway
- 10.13 Rest of Europe
Chapter 11. Asia Pacific Graphene Nanocomposites Market
- 11.1 China
- 11.2 India
- 11.3 Japan
- 11.4 South Korea
- 11.5 Thailand
- 11.6 Indonesia
- 11.7 Vietnam
- 11.8 Malaysia
- 11.9 Australia
- 11.10 Rest of Asia Pacific
Chapter 12. Latin America Graphene Nanocomposites Market
- 12.1 Brazil
- 12.2 Argentina
- 12.3 Colombia
- 12.4 Chile
- 12.5 Rest of Latin America
Chapter 13. Middle East Graphene Nanocomposites Market
- 13.1 Saudi Arabia
- 13.2 United Arab Emirates
- 13.3 Turkey
- 13.4 Israel
- 13.5 Iran
- 13.6 Rest of the Middle East
Chapter 14. Africa Graphene Nanocomposites Market
- 14.1 South Africa
- 14.2 Egypt
- 14.3 Nigeria
- 14.4 Morocco
- 14.5 Rest of Africa
Chapter 15. Graphene Nanocomposites Company Profiles
- 15.1 [Company 01]
- 15.1.1 Company Overview
- 15.1.2 Key Management Personnel
- 15.1.3 Products & Services Portfolio
- 15.1.4 Financial Performance
- 15.1.5 Key Market Focus & Geographic Presence
- 15.1.6 Recent Developments & Strategic Initiatives
Note: The company profile list is preliminary and may change based on research findings, market developments, data availability, and client requirements.
Chapter 16. Appendices
- Appendix A – List of Abbreviations & Acronyms
- Appendix B – Industry Classification Code Reference – Full Series
- Appendix C – Production & Capacity Data Tables
- Appendix D – End-Use & Demand Base Tables
- Appendix E – Consumption & Replacement Rate Assumptions
- Appendix F – ASP Reference Tables
- Appendix G – Manufacturing & Facility Database
- Appendix H – Import-Export Data Tables
- Appendix I – Regulatory Summary Tables
- Appendix J – Primary Research Participant List (Anonymized)
- Appendix K – Primary Research Questionnaire Framework
- Appendix L – Data Sources & Bibliography
- Appendix M – Market Size Divergence & Source Comparison
Chapter 17. Research Methodology
- 17.1 Research Framework & Philosophy
- 17.2 Secondary Research – Sources, Hierarchy & Data Extraction
- 17.3 Data Modeling – Bottom-Up & Top-Down Market Sizing
- 17.4 Primary Research – Stakeholder Framework, LOI & Sample Sizes
- 17.5 Forecast Methodology – Regression, Scenario & Sensitivity Analysis
- 17.6 Quality Control – Four-Layer Validation Framework
- 17.7 Limitations & Standard Assumptions
- 17.8 Disclaimer
