
Market Overview:
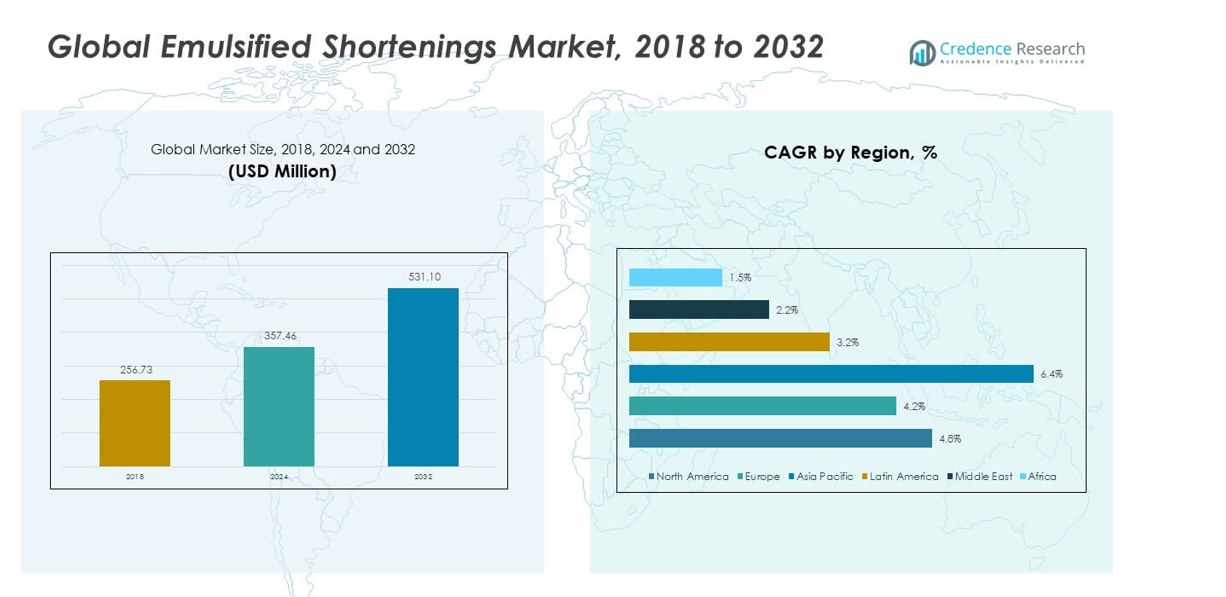
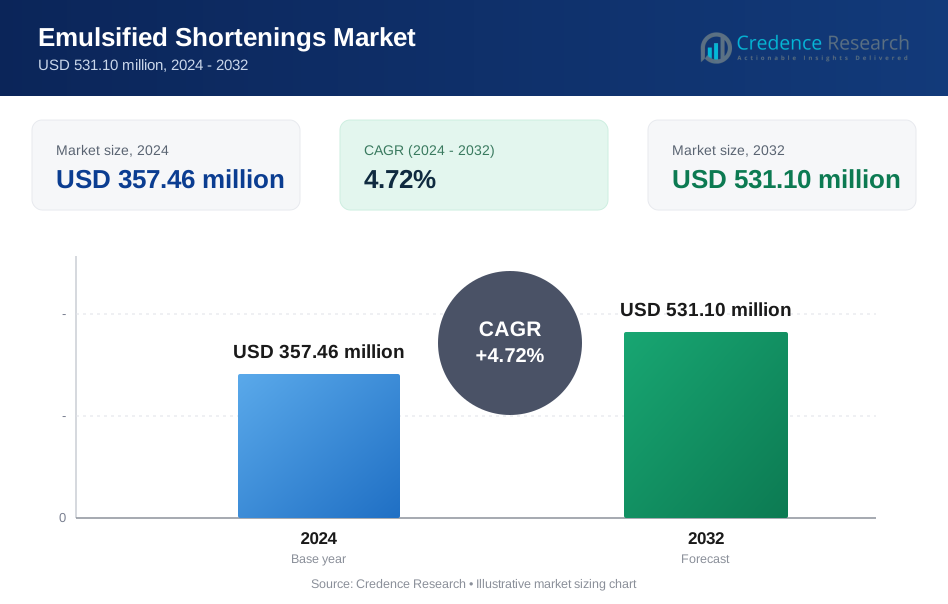
The Global Emulsified Shortenings Market size was valued at USD 256.73 million in 2018 to USD 357.46 million in 2024 and is anticipated to reach USD 531.10 million by 2032, at a CAGR of 4.72% during the forecast period.
| REPORT ATTRIBUTE | DETAILS |
|---|---|
| Historical Period | 2020-2023 |
| Base Year | 2024 |
| Forecast Period | 2025-2032 |
| Emulsified Shortenings Market Size 2024 | USD 357.46 million |
| Emulsified Shortenings Market, CAGR | 4.72% |
| Emulsified Shortenings Market Size 2032 | USD 531.10 million |
Rising demand for processed and convenience bakery products drives the Global Emulsified Shortenings Market. It benefits from increasing urbanization, changing lifestyles, and growing preference for ready-to-eat foods. Manufacturers focus on low-trans-fat and clean-label formulations to meet health-conscious consumer needs. Industrial bakeries and foodservice providers adopt emulsified shortenings for consistent texture and quality. Product innovation in dry, pellet, and liquid forms strengthens adoption. It enables tailored solutions across applications, enhancing market growth. Retail and foodservice channels expand accessibility. Rising bakery consumption further supports market expansion.
Europe and North America lead the Global Emulsified Shortenings Market due to mature bakery sectors and strong industrial infrastructure. Asia Pacific emerges as a high-growth region driven by urbanization, rising disposable income, and expanding foodservice industries. Latin America shows moderate growth supported by retail and foodservice demand. The Middle East and Africa represent smaller but steadily growing markets due to urban population increases and gradual bakery adoption. It benefits from regional production and distribution strategies tailored to consumer preferences. Market penetration strengthens through industrial and retail expansion.
Market Insights:
- The Global Emulsified Shortenings Market was valued at USD 256.73 million in 2018, USD 357.46 million in 2024, and is projected to reach USD 531.10 million by 2032, growing at a CAGR of 4.72% during the forecast period.
- Europe leads the market with a 29% share due to mature bakery industries, followed by North America at 28% with strong industrial infrastructure, and Asia Pacific at 21% driven by growing urbanization and convenience food demand.
- Asia Pacific is the fastest-growing region with a 21% share, fueled by rising disposable incomes, expanding foodservice sectors, and increasing bakery consumption.
- In product type segments, dry/powder forms lead the market due to longer shelf life and ease of transport, while pellet forms gain traction for consistent performance in industrial applications.
- Application-wise, food processing dominates the market through large-scale bakery and confectionery use, and foodservice grows steadily driven by restaurant and commercial kitchen demand.
Market Drivers
Rising Demand for Bakery and Confectionery Products Enhances Market Growth
The Global Emulsified Shortenings Market experiences strong growth due to high demand for bakery and confectionery products. It improves texture, volume, and moisture retention in bread, cakes, and pastries. Consumers increasingly prefer products with longer shelf life, supporting consistent adoption. Manufacturers focus on innovative formulations that meet health-conscious standards. Urban populations drive demand for ready-to-eat baked goods in developed and emerging markets. Retail expansion and convenience stores accelerate product accessibility. Food service sectors also contribute to higher usage. It strengthens market presence through widespread distribution channels.
- For instance, in September 2025, Puratos unveiled "Cubease" at iba 2025, a highly concentrated bakery improver cube precisely dosed to treat 10kg of flour, allowing bakeries to reduce ingredient handling time and to decrease storage needs by 75% while cutting packaging environmental impact tenfold through optimized logistics.
Health-Conscious Product Development Drives Adoption Across Regions
It encourages manufacturers to develop low-trans-fat and clean-label emulsified shortenings. Consumers seek healthier alternatives without compromising taste or functionality. Product differentiation attracts premium segments willing to pay more. It supports bakery industries in meeting regulatory standards and labeling requirements. Companies invest in research to produce sustainable ingredients. Health-driven formulations strengthen brand loyalty and repeat purchases. Regional regulations promote safe, quality-assured products. It positions the market for consistent expansion.
Increasing Consumption of Processed and Packaged Foods Boosts Market Demand
Processed and packaged foods rely on emulsified shortenings to maintain quality and consistency. It ensures stability during transportation and storage. Rising fast-food consumption influences higher incorporation in baked items. Retail and food service channels drive wide distribution and exposure. Consumers adopt convenience foods due to busy lifestyles. Manufacturers leverage technology to optimize production efficiency. It supports global supply chains with consistent performance. This trend stimulates investments across multiple product categories.
Expansion of Bakery and Food Service Industries Accelerates Market Growth
It benefits from the rapid expansion of bakery chains and food service outlets worldwide. New product launches increase demand for emulsified shortenings. It ensures consistent quality and texture across multiple locations. Urbanization supports higher per capita consumption. Industrial-scale bakeries adopt advanced shortenings to enhance operational efficiency. Market players focus on regional production and supply strategies. It drives strategic collaborations to strengthen market presence. Continuous innovation aligns with evolving consumer preferences.
- For instance, at IBIE 2025, Puratos rolled out multiple bakery innovations, including new cake and pastry ingredient concepts that had just won industry awards, and demonstrated these solutions to more than 400 commercial bakery and foodservice clients in North America, accelerating regional product accessibility and operational consistency across multiple bakery chains.
Market Trends
Shift Toward Clean-Label and Health-Focused Emulsified Shortenings in Global Markets
The Global Emulsified Shortenings Market observes increasing preference for clean-label and natural formulations. It encourages manufacturers to replace hydrogenated fats with plant-based alternatives. Consumers demand transparency and minimal additives in processed foods. It aligns with health-conscious trends and regulatory guidelines. Brands promote functional benefits like cholesterol reduction. It supports product differentiation and premium pricing. Retailers highlight clean-label products for consumer trust. Market leaders innovate to maintain competitive advantage.
- For instance, Ingredion Incorporated launched EVANESSETM CB6194 clean-label emulsifier, a vegan chickpea broth ingredient for the U.S. and Canada in March 2020, which is gluten-free, non-GMO, and does not require allergen labeling. It provides emulsification for applications including mayonnaise, dressings, and white sauces, supporting front-of-package “natural” claims as documented in Ingredion's press releases and technical fact sheets.
Integration of Advanced Production Technologies Enhances Product Consistency and Efficiency
It drives adoption of automated mixing, emulsification, and quality control technologies. Modern equipment improves batch consistency and reduces waste. It allows scalable production to meet rising demand efficiently. Companies implement digital monitoring to ensure product standards. It strengthens compliance with food safety regulations. Market players optimize energy and material usage to reduce costs. It supports faster product development cycles and innovation. Technology adoption boosts competitiveness across regions.
- For instance, Microfluidics International’s Microfluidizer® technology enables the creation of nanoemulsions with droplet sizes consistently below 200 nm. The platform scales from 2 mL in development to hundreds of liters per hour in commercial production, supporting food processors with proven metrics for emulsion stability and enabling repeatable, GMP-compliant solutions for bakery shortenings as certified by industry case studies and manufacturer technical documentation.
Rising Customization of Emulsified Shortenings for Specific Bakery Applications
The Global Emulsified Shortenings Market trends toward tailored formulations for cakes, bread, and pastry segments. It allows precise control over texture, volume, and softness. Manufacturers collaborate with clients for application-specific solutions. It encourages innovation in flavor, color, and functional properties. Consumer demand for premium baked goods supports customization. It enhances brand value and differentiation in competitive markets. Market participants invest in R&D to optimize recipes. Tailored products attract specialty and industrial bakery segments.
Expansion of Retail and E-Commerce Channels Drives Market Penetration
It benefits from growing retail and online sales channels for bakery ingredients. Consumers increasingly purchase packaged shortenings online. Retail networks expand access in emerging and rural markets. It ensures wider brand visibility and availability. Promotional strategies through digital platforms increase consumer awareness. Market leaders invest in logistics for timely distribution. It encourages bulk purchases by industrial bakeries and food service providers. E-commerce penetration accelerates overall market growth.
Market Challenges Analysis
Stringent Regulatory Standards and Health Concerns Pose Challenges to Market Growth
The Global Emulsified Shortenings Market faces strict regulations on trans-fat and saturated fat content. It requires compliance with multiple national and international standards. Manufacturers must adapt formulations without affecting product functionality. High production costs arise from sourcing healthier oils and specialty ingredients. It increases pressure on small and mid-sized producers. Consumer awareness of health risks can reduce demand for traditional shortenings. It compels companies to innovate while balancing cost and quality. Labeling and certification processes add complexity to market operations.
Price Volatility of Raw Materials and Supply Chain Constraints Limit Expansion
It depends on oils and fats whose prices fluctuate due to seasonal and geopolitical factors. Raw material shortages impact production schedules and profit margins. Supply chain disruptions increase lead times for industrial clients. It challenges manufacturers to maintain consistent product quality. Competitive pressure forces companies to absorb cost increases without raising prices. It limits entry opportunities for smaller players in emerging markets. Manufacturers invest in strategic sourcing to mitigate risk. Uncertainty in supply and cost affects long-term market planning.
Market Opportunities
Innovation in Healthier and Functional Emulsified Shortenings Supports Market Expansion
The Global Emulsified Shortenings Market can capitalize on demand for low-trans-fat and functional variants. It enables manufacturers to create products that meet health-conscious consumer needs. R&D investments can yield plant-based or fortified formulations. It allows differentiation in highly competitive bakery and confectionery segments. Collaboration with bakery chains and food service providers drives adoption. It encourages regional customization for local taste preferences. Health-oriented marketing strengthens brand reputation. Expansion of these products opens untapped consumer segments.
Emerging Markets Provide Growth Potential Through Rising Urbanization and Consumer Demand
It benefits from increasing bakery consumption in Asia-Pacific and Latin America. Urbanization and disposable income growth drive demand for convenience and processed foods. It encourages manufacturers to expand production facilities and distribution networks. Market players target new retail and food service channels. It allows adaptation to regional dietary trends and preferences. Collaboration with local suppliers enhances supply chain efficiency. It stimulates investments in product innovation and marketing campaigns. Emerging markets offer long-term growth opportunities for global players.
Market Segmentation Analysis:
By Product Type
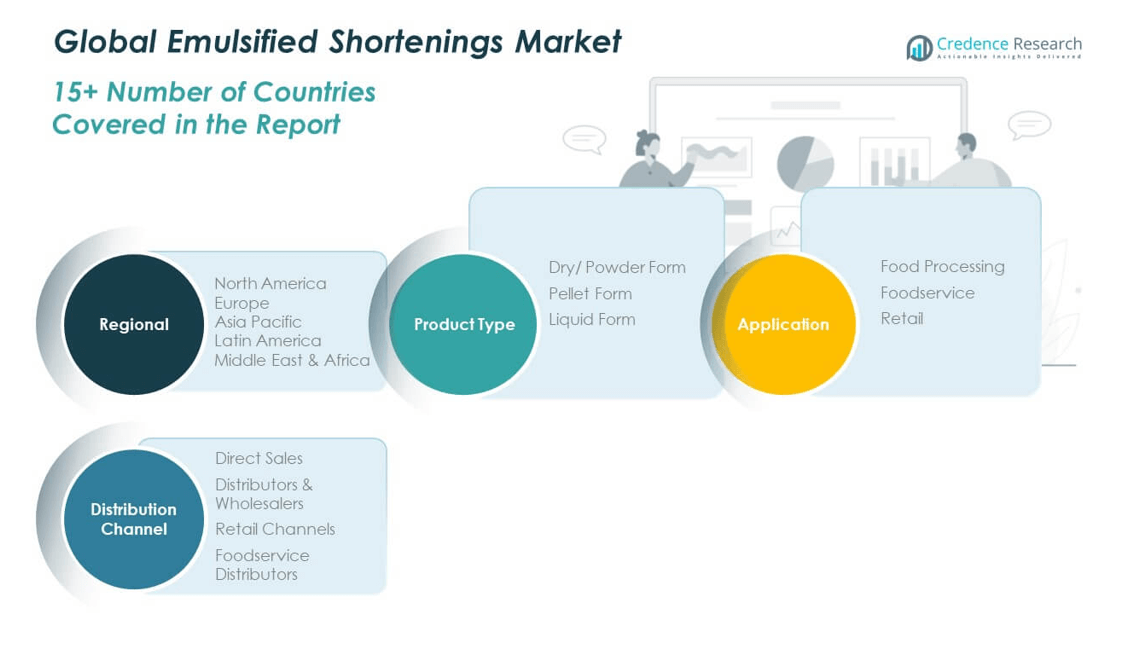
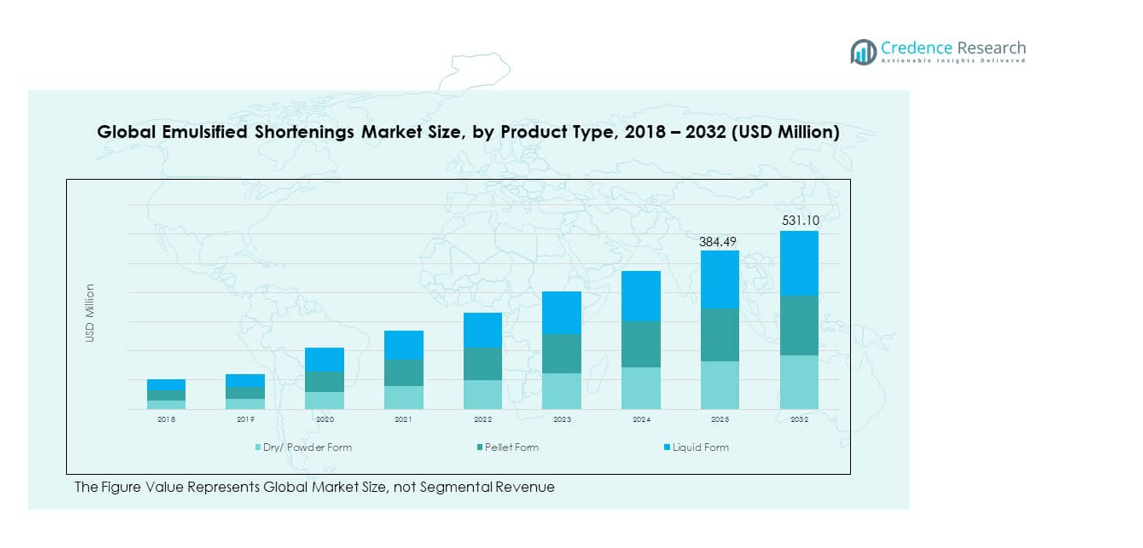
The Global Emulsified Shortenings Market includes dry/powder, pellet, and liquid forms. Dry/powder variants dominate due to longer shelf life and ease of transport. Pellet forms offer consistent functionality for industrial bakeries, ensuring uniform texture. Liquid emulsified shortenings support rapid mixing and automation in large-scale production. Manufacturers optimize formulations in each type to meet diverse bakery and confectionery requirements. It enables tailored solutions for specific applications, enhancing performance. Product innovation in functionality and storage stability drives adoption. Each type supports growth in both retail and industrial sectors.
- For instance, FLUID FLEX liquid cake shortening delivers superior emulsification and crumb structure, with product specifications and third-party bakery supply documentation confirming its performance for cakes and frostings in commercial baking environments during 2025.
By Application
It serves food processing, foodservice, and retail applications. Food processing uses emulsified shortenings to improve texture, volume, and shelf life of baked goods. Foodservice relies on them for consistency in restaurants, cafes, and commercial kitchens. Retail consumption grows with packaged bakery items and convenience foods. Manufacturers develop formulations suited to end-use requirements in each segment. It strengthens market penetration by addressing both industrial and consumer demands. Application-focused strategies support brand differentiation. Emulsified shortenings play a critical role in product quality and operational efficiency.
- For instance, Vivo’s product listings detail emulsifier oils and shortenings with excellent mouthfeel and batter whippability, explicitly referenced for improving the consistency and quality of cakes and breads in foodservice bakery settings.
By Distribution Channel
Direct sales, distributors & wholesalers, retail channels, and foodservice distributors drive market reach. Direct sales offer customized bulk supply to industrial clients. Distributors and wholesalers expand availability across regions and product types. Retail channels target end consumers through supermarkets and specialty stores. Foodservice distributors ensure timely delivery to commercial kitchens. It enhances accessibility and supports consistent product demand. Companies leverage distribution strategies to strengthen regional presence. Efficient channel management drives revenue growth and market share.
Segmentation:
By Product Type
- Dry/Powder Form
- Pellet Form
- Liquid Form
By Application
- Food Processing
- Foodservice
- Retail
By Distribution Channel
- Direct Sales
- Distributors & Wholesalers
- Retail Channels
- Foodservice Distributors
By Region
- North America
- U.S.
- Canada
- Europe
- Germany
- France
- Italy
- U.K.
- Russia
- Rest of Europe
- Asia-Pacific
- India
- China
- Japan
- Rest of Asia-Pacific
- Latin America
- Brazil
- Mexico
- Rest of Latin America
- Middle East and Africa
- GCC Countries
- South Africa
- Rest of Middle East and Africa
Regional Analysis:
North America
The North America Global Emulsified Shortenings Market size was valued at USD 76.36 million in 2018 to USD 104.71 million in 2024 and is anticipated to reach USD 156.21 million by 2032, at a CAGR of 4.8% during the forecast period. North America accounts for a significant share of the global market due to strong bakery and food processing industries. It benefits from high consumer demand for convenience foods and processed baked goods. Manufacturers focus on low-trans-fat and clean-label formulations to meet health standards. Urban populations and retail expansion drive adoption in the U.S., Canada, and Mexico. Industrial bakeries leverage advanced technologies to enhance efficiency. It supports consistent quality and supply across food service and retail segments. Regional regulations ensure safety and quality compliance. Market leaders implement strategic partnerships to strengthen distribution networks.
Europe
The Europe Global Emulsified Shortenings Market size was valued at USD 109.45 million in 2018 to USD 148.74 million in 2024 and is anticipated to reach USD 212.50 million by 2032, at a CAGR of 4.2% during the forecast period. Europe holds a substantial market share driven by mature bakery sectors in Germany, France, and the UK. It focuses on clean-label and healthier formulations due to stringent regulatory standards. Urban lifestyles and convenience food consumption support retail growth. Industrial-scale bakeries and foodservice providers adopt emulsified shortenings for consistent product quality. Manufacturers invest in R&D to innovate functional and specialty products. It enables product differentiation across competitive markets. Distribution channels are well-developed, supporting timely delivery and market reach.
Asia Pacific
The Asia Pacific Global Emulsified Shortenings Market size was valued at USD 48.38 million in 2018 to USD 73.13 million in 2024 and is anticipated to reach USD 123.34 million by 2032, at a CAGR of 6.4% during the forecast period. Asia Pacific shows the highest growth rate due to increasing urbanization and rising disposable income in China, India, and Japan. It benefits from expanding bakery and confectionery sectors in emerging markets. Manufacturers develop formulations tailored to local tastes and dietary preferences. Retail chains and e-commerce platforms enhance product availability. Industrial bakeries adopt liquid and pellet forms for large-scale production. It strengthens market penetration through regional production facilities. Consumers increasingly prefer ready-to-eat and convenience baked goods. Market investments focus on innovation and supply chain efficiency.
Latin America
The Latin America Global Emulsified Shortenings Market size was valued at USD 12.41 million in 2018 to USD 17.07 million in 2024 and is anticipated to reach USD 22.52 million by 2032, at a CAGR of 3.2% during the forecast period. Latin America contributes moderately to the global market with growing bakery consumption in Brazil and Argentina. It supports rising demand from retail and foodservice channels. Manufacturers target urban populations and convenience-oriented consumers. Product innovation focuses on functional and clean-label variants. It benefits from expanding distribution networks to reach both industrial and retail segments. Adoption of emulsified shortenings ensures consistent quality in processed baked goods. Market players invest in regional production to optimize logistics.
Middle East
The Middle East Global Emulsified Shortenings Market size was valued at USD 6.48 million in 2018 to USD 8.16 million in 2024 and is anticipated to reach USD 10.00 million by 2032, at a CAGR of 2.2% during the forecast period. Middle East represents a smaller share but shows steady growth driven by foodservice and industrial bakeries. It benefits from increasing urban population and rising disposable income in GCC countries. Manufacturers provide formulations suited to regional culinary preferences. Retail expansion enhances availability of packaged bakery products. It strengthens supply through partnerships with local distributors. Industrial and commercial kitchens rely on emulsified shortenings for consistent performance. Market players explore opportunities in emerging Middle East markets.
Africa
The Africa Global Emulsified Shortenings Market size was valued at USD 3.64 million in 2018 to USD 5.64 million in 2024 and is anticipated to reach USD 6.53 million by 2032, at a CAGR of 1.5% during the forecast period. Africa accounts for a small portion of the global market with modest growth. It relies on South Africa and Egypt for primary consumption and industrial bakery operations. Manufacturers focus on supplying cost-effective emulsified shortenings for processed foods. Retail and foodservice channels support moderate market expansion. It benefits from gradual urbanization and growing bakery adoption in key countries. Limited infrastructure and lower consumer awareness restrict rapid growth. Market strategies focus on targeted regional investments and distribution optimization.
Key Player Analysis:
- Cargill, Incorporated
- Archer Daniels Midland Company (ADM)
- Bunge Limited
- BASF SE
- IOI Corporation Berhad
- ConAgra Foods, Inc.
- Agropur Ingredients
- Wilmar International Limited
- Loders Croklaan
- AAK AB
Competitive Analysis:
The Global Emulsified Shortenings Market features intense competition among leading multinational and regional players. It is driven by product innovation, strategic acquisitions, and regional expansions. Key companies focus on clean-label and low-trans-fat formulations to meet evolving consumer preferences. It emphasizes optimizing supply chains and distribution networks for faster market reach. Competitors invest in research to develop tailored solutions for industrial bakeries, foodservice, and retail segments. Strategic partnerships and collaborations strengthen brand presence in emerging markets. It experiences continuous pressure to balance cost, quality, and compliance with regulatory standards. Companies with diversified portfolios and strong R&D capabilities maintain competitive advantage. Market dynamics favor players capable of introducing functional, sustainable, and value-added emulsified shortenings. Strategic growth initiatives, including new product launches and regional production facilities, drive revenue and market share expansion across global regions.
Recent Developments:
- In July 2025, Bunge and Viterra completed their merger, forming a premier global agribusiness solutions company. This merger, valued at $8.2 billion, combines Bunge's extensive experience in agricultural products with Viterra's global reach, positioning the new entity to better serve the emulsified shortenings market with enhanced resources and capabilities.
Report Coverage:
The research report offers an in-depth analysis based on Product Type, Application and Distribution Channel. It details leading market players, providing an overview of their business, product offerings, investments, revenue streams, and key applications. Additionally, the report includes insights into the competitive environment, SWOT analysis, current market trends, as well as the primary drivers and constraints. Furthermore, it discusses various factors that have driven market expansion in recent years. The report also explores market dynamics, regulatory scenarios, and technological advancements that are shaping the industry. It assesses the impact of external factors and global economic changes on market growth. Lastly, it provides strategic recommendations for new entrants and established companies to navigate the complexities of the market.
Future Outlook:
- The market will expand through rising demand in industrial and retail bakery sectors.
- Manufacturers will focus on low-trans-fat and clean-label formulations to capture health-conscious consumers.
- Asia Pacific will emerge as a high-growth region due to urbanization and disposable income increase.
- Product innovation will drive adoption across liquid, pellet, and dry/powder forms.
- Foodservice and convenience food segments will increasingly rely on emulsified shortenings for consistent quality.
- E-commerce and retail distribution channels will enhance product availability and market reach.
- Companies will invest in advanced production technologies to improve efficiency and reduce waste.
- Strategic partnerships, mergers, and regional expansions will strengthen competitive positioning.
- Sustainability initiatives will guide ingredient sourcing and environmentally responsible production practices.
- The market will witness diversification in applications, including new bakery and confectionery product launches.
Request a Free Sample
Fill in your details and we'll send you a free sample report.
- Sample data tables & charts
- Research methodology
Need a Custom Version of This Report?
Tailor the scope, geography, or segments to your exact requirements.
- Custom geography or segment scope
- Direct access to our analyst team
Frequently Asked Questions
What is the current market size for Global Emulsified Shortenings Market, and what is its projected size in 2032?
At what Compound Annual Growth Rate is the Global Emulsified Shortenings Market projected to grow between 2024 and 2032?
Which Global Emulsified Shortenings Market segment held the largest share in 2024?
What are the primary factors fueling the growth of the Global Emulsified Shortenings Market?
Who are the leading companies in the Global Emulsified Shortenings Market?
Which region commanded the largest share of the Global Emulsified Shortenings Market in 2024?
Table of Content
Chapter 1. Report Introduction
- 1.1 Report Description & Purpose
- 1.1.1 Report Title & Market Definition
- 1.1.2 Unique Selling Propositions (USP) & Key Differentiators
- 1.1.3 Value Proposition for Stakeholders
- 1.2 Research Objectives
- 1.2.1 Market Sizing Objectives (Volume & Revenue)
- 1.2.2 Segmentation Objectives
- 1.2.3 Competitive Intelligence Objectives
- 1.2.4 Forecast & Scenario Objectives
- 1.3 Report Scope
- 1.3.1 Emulsified Shortenings Scope – Types & Subtypes Covered
- 1.3.2 Geographic Scope – Regions & Countries Covered
- 1.3.3 Historical Period, Base Year & Forecast Period (2024; forecast to 2032)
- 1.3.4 Inclusions & Exclusions
- 1.4 HS Code & Classification Framework
- 1.5 Currency, Units & Pricing Basis
- 1.6 Target Stakeholders
- 1.7 Limitations & Assumptions
Chapter 2. Executive Summary
- 2.1 Global Emulsified Shortenings Market Snapshot
- 2.1.1 Market Size – Historical (2024) & Forecast (2024-2032) (2024: USD 357.46 million → 2032: USD 531.10 million)
- 2.1.2 Volume & Revenue – Global Totals
- 2.1.3 Key Market Highlights – Top Five Facts
- 2.2 Emulsified Shortenings Market Segmentation Snapshot
- 2.2.1 Market Split by Region – 2024 vs. 2032
- 2.3 Competitive Snapshot
- 2.3.1 Top 10 Players by Revenue Share – 2024
- 2.3.2 Top 10 Players by Volume Share – 2024
- 2.3.3 Recent Strategic Developments (18-Month Summary)
- 2.4 Key Investment Highlights & Strategic Conclusions
Chapter 3. Emulsified Shortenings Market Dynamics & Industry Analysis
- 3.1 Market Overview & Context
- 3.1.1 Emulsified Shortenings Market Position in the Broader Automotive Value Chain
- 3.1.2 OEM vs. Replacement Market Dynamics
- 3.1.3 Market Maturity & Development Stage by Region
- 3.2 Emulsified Shortenings Market Drivers
- 3.3 Emulsified Shortenings Market Restraints & Challenges
- 3.4 Emulsified Shortenings Market Opportunities
- 3.5 Porter's Five Forces Analysis
- 3.5.1 Threat of New Entrants
- 3.5.2 Bargaining Power of Suppliers
- 3.5.3 Bargaining Power of Buyers
- 3.5.4 Threat of Substitutes
- 3.5.5 Competitive Rivalry – Intensity Assessment
- 3.6 Emulsified Shortenings Value Chain Analysis
- 3.6.1 Upstream – Raw Material/Input Suppliers
- 3.6.1.1 Raw Material/Input 1
- 3.6.1.2 Raw Material/Input 2
- 3.6.1.3 Raw Material/Input 3
- 3.6.2 Midstream – Production/Manufacturing/Service Delivery
- 3.6.2.1 Production/Process Overview
- 3.6.2.2 Key Facility Locations & Capacity by Manufacturer
- 3.6.3 Downstream – Distribution & End Consumer
- 3.6.3.1 Primary Channel – B2B/OEM
- 3.6.3.2 Secondary Channels – Dealer, Retail, Online, Direct
- 3.6.4 Value Chain Profitability Analysis
- 3.6.1 Upstream – Raw Material/Input Suppliers
- 3.7 PESTEL Analysis
- 3.7.1 Political Factors
- 3.7.2 Economic Factors
- 3.7.3 Social Factors
- 3.7.4 Technological Factors
- 3.7.5 Environmental Factors
- 3.7.6 Legal Factors
- 3.8 Emulsified Shortenings Supply Chain Analysis
- 3.8.1 Raw Material/Input Supply Risk Assessment
- 3.8.2 Manufacturing Concentration Risk (Geographic Exposure)
- 3.8.3 Trade Disruption Impact Analysis
- 3.9 Regulatory & Policy Landscape
Note: The regulatory and policy landscape section covers regulations based on their applicability to the market, Emulsified Shortenings category, geography, and scope of the study. Only regulatory frameworks with a material impact on operations, compliance, trade, sustainability, or market access are analyzed in detail.
Chapter 4. Key Investment Pockets & Opportunity Analysis
- 4.1 Emulsified Shortenings Market Attractiveness Analysis
- 4.1.1 By Region – Investment Attractiveness Matrix (Volume × CAGR)
- 4.2 Absolute Revenue Growth Opportunity
- 4.2.1 By Region – Absolute USD Growth Through 2032
- 4.3 Incremental Volume Opportunity
- 4.3.1 By Region – Incremental Volume Through 2032
- 4.3.2 Segment – Incremental Volume
- 4.4 Emerging Submarket Opportunity Deep Dive (Subject to Applicability)
- 4.5 Emerging Market Opportunity Scorecards
- 4.5.1 United States
- 4.5.2 Europe
- 4.5.3 Asia
- 4.5.4 Middle East & Africa
Note: Emerging Market Opportunity Scorecards will be included based on relevance and strategic importance. Regions listed are indicative and may vary depending on data availability and market dynamics.
Chapter 5. Emulsified Shortenings Import-Export Analysis & Trade Flows
- 5.1 Global Trade Overview
- 5.1.1 Global Export Value by Country (2024)
- 5.1.2 Global Export Volume by Country (2024)
- 5.1.3 Global Import Value by Country (2024)
- 5.1.4 Global Import Volume by Country (2024)
- 5.1.5 Net Trade Balance by Country (2024)
- 5.2 Export Analysis – Segment
- 5.2.1 Type 1 (HS Code)
- 5.2.2 Type 2 (HS Code)
- 5.2.3 Type 3 (HS Code)
- 5.2.4 Type 4 (HS Code)
- 5.2.5 Type 5 (HS Code)
- 5.3 Import Analysis – Segment
- 5.3.1 Type 1 (HS Code)
- 5.3.2 Type 2 (HS Code)
- 5.3.3 Type 3 (HS Code)
- 5.3.4 Type 4 (HS Code)
- 5.3.5 Type 5 (HS Code)
- 5.4 Average Unit Trade Prices
- 5.4.1 Average Export Price – Segment & Country
- 5.4.2 Average Import Price – Segment & Source Country
- 5.4.3 Price Trends (2024)
- 5.5 Key Trade Route Analysis
- 5.5.1 Trade Route 1
- 5.5.2 Trade Route 2
- 5.5.3 Trade Route 3
- 5.5.4 Trade Route 4
- 5.5.5 Trade Route 5
- 5.6 Trade Policy Impact Assessment
- 5.6.1 US Anti-Dumping & Section 301 Tariffs
- 5.6.2 EU Customs Union Impact
- 5.6.3 Major Free Trade Agreements
- 5.6.4 USMCA Rules of Origin
Note: Trade policy analysis will be included only where relevant to the Emulsified Shortenings market.
Chapter 6. Competitive Landscape & Company Benchmarking
- 6.1 Emulsified Shortenings Market Concentration & Structure
- 6.1.1 Herfindahl-Hirschman Index (HHI) – vs. 2024
- 6.1.2 Tier 1, Tier 2 & Tier 3 Market Structure
- 6.1.3 Global, Regional & Local Player Dynamics
- 6.2 Emulsified Shortenings Market Share Analysis – 2024
- 6.2.1 Global Revenue Share by Company
- 6.2.2 Global Volume Share by Company
- 6.2.3 Regional Revenue Share
- 6.2.4 Market Share Evolution ( vs. 2024)
- 6.2.5 OEM Segment Share by Company
- 6.2.6 Replacement Segment Share by Company
- 6.3 Production/Delivery Capacity & Facility Analysis
- 6.3.1 Global Installed Capacity
- 6.3.2 Capacity Utilization Rates
- 6.3.3 Production/Output Volume
- 6.3.4 Facility Locations & Capacity Map
- 6.3.5 Planned Capacity Additions
- 6.4 Emulsified Shortenings Competitive Benchmarking Matrix
- 6.4.1 Revenue, Volume, CAGR & Profitability Comparison
- 6.4.2 Channel Revenue Mix
- 6.4.3 Geographic Revenue Exposure
- 6.4.4 R&D Intensity
- 6.4.5 Sustainability Maturity
- 6.5 Strategic Developments in Emulsified Shortenings (Last 24 Months)
- 6.5.1 Mergers, Acquisitions & Divestments
- 6.5.2 New Emulsified Shortenings Launches
- 6.5.3 Facility Expansions
- 6.5.4 Strategic Alliances, Joint Ventures & Partnerships
- 6.5.5 Distribution Expansion & Market Entry
- 6.5.6 Sustainability & ESG Initiatives
- 6.6 Competitive Strategy Mapping
- 6.6.1 Leader, Challenger, Follower & Niche Classification
- 6.6.2 Pricing Strategy Comparison
- 6.6.3 Channel Strategy Matrix
Note: Strategic developments are included based on their materiality and the availability of reliable information.
Chapter 7. Global Emulsified Shortenings Market – By Distribution Channel
- 7.1 Segment Overview
- 7.1.1 Volume & Revenue Split by Channel (2024 & 2032)
- 7.1.2 Channel Mix Evolution (2024-2032)
Chapter 8. Regional Market Analysis – Global Overview
- 8.1 Global Regional Overview
- 8.1.1 Regional Volume Share
- 8.1.2 Regional Revenue Share
- 8.1.3 Regional Volume by Region
- 8.1.4 Regional Revenue by Region
- 8.1.5 Regional Forecast Through 2032
- 8.2 Cross-Regional Segment Analysis
- 8.2.1 By Distribution Channel
- 8.2.2 By Brand/Price Tier
Chapter 9. North America Emulsified Shortenings Market
- 9.1 United States
- 9.2 Canada
- 9.3 Mexico
Chapter 10. Europe Emulsified Shortenings Market
- 10.1 Germany
- 10.2 France
- 10.3 Italy
- 10.4 United Kingdom
- 10.5 Spain
- 10.6 Poland
- 10.7 Russia
- 10.8 Netherlands
- 10.9 Belgium
- 10.10 Sweden
- 10.11 Denmark
- 10.12 Norway
- 10.13 Rest of Europe
Chapter 11. Asia Pacific Emulsified Shortenings Market
- 11.1 China
- 11.2 India
- 11.3 Japan
- 11.4 South Korea
- 11.5 Thailand
- 11.6 Indonesia
- 11.7 Vietnam
- 11.8 Malaysia
- 11.9 Australia
- 11.10 Rest of Asia Pacific
Chapter 12. Latin America Emulsified Shortenings Market
- 12.1 Brazil
- 12.2 Argentina
- 12.3 Colombia
- 12.4 Chile
- 12.5 Rest of Latin America
Chapter 13. Middle East Emulsified Shortenings Market
- 13.1 Saudi Arabia
- 13.2 United Arab Emirates
- 13.3 Turkey
- 13.4 Israel
- 13.5 Iran
- 13.6 Rest of the Middle East
Chapter 14. Africa Emulsified Shortenings Market
- 14.1 South Africa
- 14.2 Egypt
- 14.3 Nigeria
- 14.4 Morocco
- 14.5 Rest of Africa
Chapter 15. Emulsified Shortenings Company Profiles
- 15.1 [Company 01]
- 15.1.1 Company Overview
- 15.1.2 Key Management Personnel
- 15.1.3 Products & Services Portfolio
- 15.1.4 Financial Performance
- 15.1.5 Key Market Focus & Geographic Presence
- 15.1.6 Recent Developments & Strategic Initiatives
Note: The company profile list is preliminary and may change based on research findings, market developments, data availability, and client requirements.
Chapter 16. Appendices
- Appendix A – List of Abbreviations & Acronyms
- Appendix B – Industry Classification Code Reference – Full Series
- Appendix C – Production & Capacity Data Tables
- Appendix D – End-Use & Demand Base Tables
- Appendix E – Consumption & Replacement Rate Assumptions
- Appendix F – ASP Reference Tables
- Appendix G – Manufacturing & Facility Database
- Appendix H – Import-Export Data Tables
- Appendix I – Regulatory Summary Tables
- Appendix J – Primary Research Participant List (Anonymized)
- Appendix K – Primary Research Questionnaire Framework
- Appendix L – Data Sources & Bibliography
- Appendix M – Market Size Divergence & Source Comparison
Chapter 17. Research Methodology
- 17.1 Research Framework & Philosophy
- 17.2 Secondary Research – Sources, Hierarchy & Data Extraction
- 17.3 Data Modeling – Bottom-Up & Top-Down Market Sizing
- 17.4 Primary Research – Stakeholder Framework, LOI & Sample Sizes
- 17.5 Forecast Methodology – Regression, Scenario & Sensitivity Analysis
- 17.6 Quality Control – Four-Layer Validation Framework
- 17.7 Limitations & Standard Assumptions
- 17.8 Disclaimer
