Market Overview
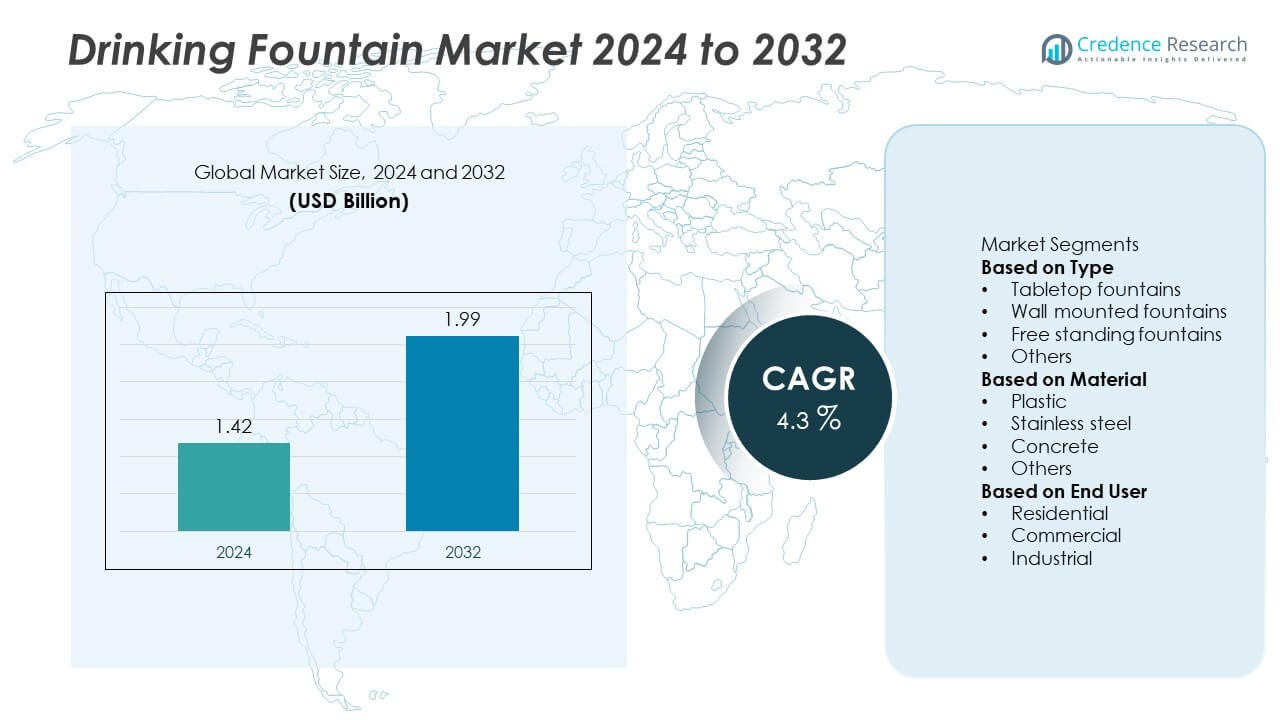
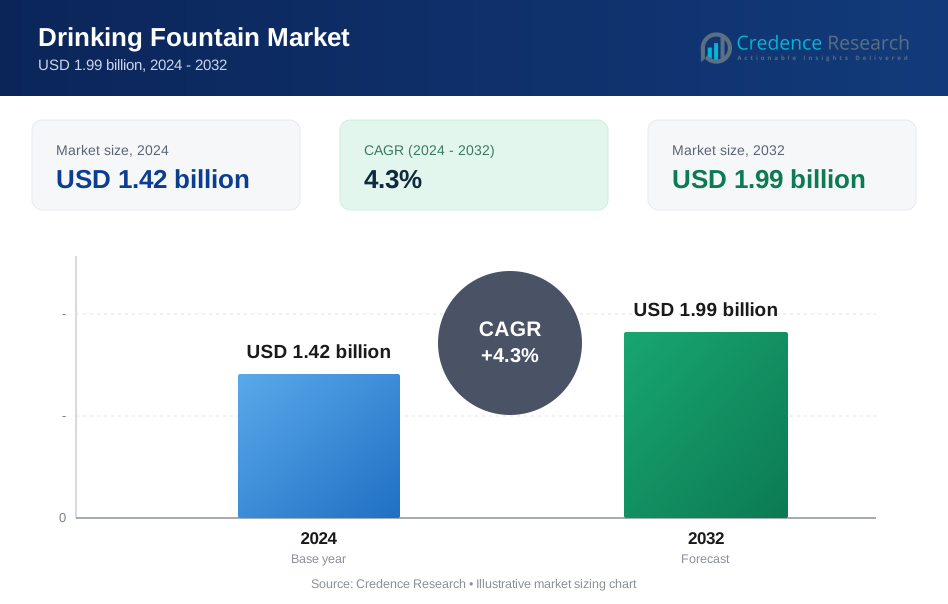
The Drinking Fountain market was valued at USD 1.42 billion in 2024 and is projected to reach USD 1.99 billion by 2032, growing at a CAGR of 4.3% during the forecast period.
| REPORT ATTRIBUTE | DETAILS |
|---|---|
| Historical Period | 2020-2023 |
| Base Year | 2024 |
| Forecast Period | 2025-2032 |
| Drinking Fountain market Size 2024 | USD 1.42 Billion |
| Drinking Fountain market, CAGR | 4.3% |
| Drinking Fountain market Size 2032 | USD 1.99 Billion |
The drinking fountain market is dominated by major companies such as Elkay Manufacturing Company, Cuno Incorporated, Bobrick Washroom Equipment, Inc., EVO Water Systems, Beverage Air, Coolers LLC, AmeriWater, Inc., Aqua Bubblers, Inc., Fountains of Youth, Inc., and Bubblers Direct, Inc. These players lead the market through continuous advancements in filtration systems, touchless technology, and eco-friendly designs. They focus on developing durable and hygienic fountains that meet sustainability and health standards across commercial, educational, and public facilities. North America led the market with a 35% share in 2024, supported by extensive installations in schools, offices, and airports. Asia-Pacific followed with a 30% share, driven by rapid urbanization, infrastructure development, and growing public health initiatives promoting clean water access.
Market Insights
- The drinking fountain market was valued at USD 1.42 billion in 2024 and is projected to reach USD 1.99 billion by 2032, growing at a CAGR of 4.3%.
- Growth is driven by rising demand for clean and filtered drinking water in schools, offices, and public spaces, supported by hygiene and sustainability initiatives.
- Smart and touchless drinking fountains with integrated filtration and IoT monitoring are key trends improving water quality and user safety.
- The market is moderately competitive, with major players like Elkay, Bobrick, and Cuno focusing on energy-efficient, eco-friendly, and low-maintenance models.
- North America led the market with a 35% share in 2024, followed by Asia-Pacific with 30%, while wall-mounted fountains dominated by type with a 46% share due to wide adoption in public infrastructure.
Market Segmentation Analysis:
By Type
The wall-mounted fountains segment dominated the drinking fountain market with a 46% share in 2024. This segment leads due to its space-efficient design, ease of installation, and widespread use in schools, offices, airports, and public facilities. Wall-mounted models are favored for their low maintenance, accessibility, and integration with water filtration systems. Tabletop fountains follow, driven by adoption in small offices and residential settings for compact hydration solutions. Free-standing units also see rising demand in outdoor public spaces and parks, supported by their durability and larger water capacity.
- For instance, Elkay Manufacturing Company offers the EZH2O Liv Pro line, an in-wall filtered water dispenser for commercial spaces. In general, a non-refrigerated version of an EZH2O bottle filling station can deliver water at a rate of up to 1.5 gallons per minute (GPM), which is significantly faster than a traditional drinking fountain.
By Material
The stainless-steel segment held the largest 49% share of the drinking fountain market in 2024. Stainless steel’s corrosion resistance, hygiene, and long service life make it the preferred material in commercial and institutional applications. Its non-toxic and recyclable nature aligns with global sustainability goals and strict drinking water regulations. Plastic fountains remain popular for residential and temporary installations due to their lightweight and cost-effective design, while concrete units are commonly used in outdoor environments where vandal resistance and durability are key.
- For instance, Bobrick Washroom Equipment, Inc. launched its B-819298 stainless-steel accessible drinking fountain grab bar, constructed from 18-gauge (1.2mm) thick 304-grade steel, which is tested to support loads in excess of 113 kilograms when properly installed.
By End User
The commercial segment accounted for a 57% share of the drinking fountain market in 2024. High installation rates in educational institutions, corporate buildings, transportation hubs, and healthcare facilities drive this segment’s dominance. The rise in public infrastructure development and hygiene awareness further supports demand for contactless and filtered units. Residential adoption is increasing with home-based hydration solutions and kitchen-integrated designs, while the industrial segment shows steady growth driven by the need for safe drinking water in large-scale manufacturing and warehouse environments.
Key Growth Drivers
Increasing Demand for Clean and Filtered Drinking Water
Rising awareness of waterborne diseases and the need for safe drinking water are major growth drivers in the drinking fountain market. Public infrastructure, schools, and corporate facilities increasingly install fountains equipped with advanced filtration systems to ensure water quality. The shift toward cleaner hydration options is driven by consumer health consciousness and regulatory mandates. This demand encourages manufacturers to integrate UV purification, carbon filters, and antimicrobial materials to enhance safety and hygiene in public and commercial environments.
- For instance, the Aqua-Pure™ AP Easy C-Complete filtration system from 3M is a point-of-use unit for residential applications that is NSF certified to remove particles down to 0.5 microns, reduce chlorine taste and odor, lead, cysts, and other volatile organic compounds.
Expansion of Public Infrastructure and Smart Cities
The growth of smart cities and modernization of public infrastructure significantly fuel the demand for drinking fountains. Governments are investing in installing energy-efficient and sensor-based fountains across parks, airports, and transit stations to promote public health and sustainability. These systems help reduce plastic bottle use while offering convenient access to clean water. The integration of touchless and self-cleaning technologies in public installations further enhances user convenience and hygiene compliance.
- For instance, Siemens offers smart water management solutions that use AI-powered apps like SIWA Leak Finder and SIWA Blockage Predictor. These applications analyze real-time data from sensors and smart meters to identify leaks, predict blockages, and optimize water distribution networks.
Sustainability and Eco-Friendly Design Initiatives
Sustainability-focused initiatives across industries are boosting the adoption of eco-friendly drinking fountains. Organizations and municipalities prioritize refillable, low-energy fountains to reduce plastic waste and water consumption. Manufacturers are developing units made from recyclable materials like stainless steel and BPA-free plastics. Energy-efficient refrigeration systems and automatic shut-off features are gaining popularity. This trend aligns with corporate sustainability goals and environmental policies encouraging green infrastructure development in commercial and public spaces.
Key Trends & Opportunities
Adoption of Touchless and Smart Fountain Technology
Touchless operation and smart monitoring features are transforming the drinking fountain market. Infrared sensors and automatic dispensers improve hygiene, especially in public places and corporate environments. Smart fountains equipped with IoT systems allow real-time monitoring of water quality, usage, and maintenance needs. These advancements support sustainability by optimizing water consumption and operational efficiency. Growing demand for contact-free hydration systems, accelerated by post-pandemic health standards, positions smart technology as a key market opportunity.
- For instance, AmeriWater is expanding its Sterile Processing water solutions portfolio with remote monitoring analytics, which includes a cloud-based dashboard for real-time data capture and customizable reports. This supports compliance with the AAMI ST108 standard.
Rising Integration with Bottle Filling Stations
A growing trend is the integration of bottle-filling functions with traditional drinking fountains. This hybrid design reduces plastic waste and encourages refill culture in schools, gyms, airports, and offices. The convenience of dual-purpose fountains drives installation in both new and renovated facilities. Manufacturers are introducing energy-efficient, quick-fill models with real-time usage displays. The trend supports environmental goals and meets increasing consumer preference for sustainable hydration solutions.
- For instance, some modern commercial beverage dispensing systems offer advanced features like interactive touchscreens, smart taps with RFID technology, and remote monitoring for inventory management. These systems are designed for increased efficiency, customization, and to reduce waste and energy consumption compared to conventional dispensers.
Key Challenges
High Maintenance and Installation Costs
The cost of installation, maintenance, and regular filtration system replacement remains a major challenge for the drinking fountain market. Touchless and smart models, though hygienic and efficient, require higher upfront investment and periodic servicing. Commercial facilities face budget constraints in adopting advanced fountains across large premises. To address this, manufacturers focus on developing cost-effective, low-maintenance models with durable filtration systems that extend service life and reduce operational costs.
Limited Awareness and Accessibility in Developing Regions
In developing regions, lack of awareness about clean drinking solutions and limited public infrastructure restrict market expansion. Many areas still rely on bottled or unfiltered tap water due to inadequate maintenance or inconsistent water supply. Governments and NGOs are initiating hydration infrastructure projects, but slow adoption rates and funding challenges persist. Increasing awareness campaigns, affordable product designs, and partnerships with local authorities are essential to overcoming these barriers and expanding market reach.
Regional Analysis
North America
North America held a 35% share of the drinking fountain market in 2024. The region’s leadership is driven by widespread adoption in educational institutions, corporate buildings, and public facilities emphasizing hygiene and accessibility. The U.S. dominates due to strict health regulations and growing use of touchless and filtered systems. Upgrading aging water infrastructure and increasing sustainability initiatives support continued demand. Manufacturers focus on energy-efficient, ADA-compliant, and sensor-operated models. Canada’s commitment to eco-friendly public installations and water safety programs further enhances regional growth across both residential and commercial applications.
Europe
Europe accounted for a 28% share of the drinking fountain market in 2024. The region’s growth is supported by strong environmental policies promoting reduced plastic waste and sustainable hydration solutions. Countries such as Germany, the U.K., and France are increasing installations in airports, schools, and urban areas as part of green city initiatives. Advanced water purification technologies and public hygiene standards drive product innovation. European manufacturers are emphasizing stainless steel and recyclable materials to meet sustainability targets. Rising adoption of refill stations also boosts the region’s transition toward eco-conscious drinking infrastructure.
Asia-Pacific
Asia-Pacific captured a 30% share of the drinking fountain market in 2024. Rapid urbanization, infrastructure development, and expanding commercial construction projects in China, Japan, and India are key growth drivers. Governments across the region are investing in smart public utilities and school-based drinking solutions to improve hygiene and access to clean water. Rising health awareness, coupled with the demand for touchless and filtered units, is strengthening adoption. Local manufacturers offer cost-effective solutions suited for high-traffic environments, while smart city initiatives in countries like Singapore and South Korea further fuel market expansion.
Middle East & Africa
The Middle East & Africa region held a 4% share of the drinking fountain market in 2024. Growth is driven by increasing infrastructure projects in commercial, educational, and hospitality sectors, especially in the UAE, Saudi Arabia, and South Africa. The demand for durable, temperature-controlled fountains suited for arid climates is increasing. Governments are emphasizing sustainable water solutions to reduce plastic consumption and improve public hydration facilities. International brands are expanding partnerships with regional distributors to enhance accessibility, while urban development projects continue to integrate modern, sensor-based hydration systems.
Latin America
Latin America accounted for a 3% share of the drinking fountain market in 2024. The region’s expansion is supported by growing investments in public infrastructure, particularly in Brazil, Mexico, and Chile. Urban centers are adopting filtered and touchless fountains to improve water safety and reduce plastic dependency. Educational and healthcare institutions are key end users, promoting installations that meet hygiene standards. Manufacturers are introducing cost-effective, low-maintenance units tailored to regional needs. Rising government initiatives for clean water access and increased awareness of sustainability further enhance market penetration across Latin American countries.
Market Segmentations:
By Type
- Tabletop fountains
- Wall mounted fountains
- Free standing fountains
- Others
By Material
- Plastic
- Stainless steel
- Concrete
- Others
By End User
- Residential
- Commercial
- Industrial
By Geography
- North America
- U.S.
- Canada
- Mexico
- Europe
- Germany
- France
- U.K.
- Italy
- Spain
- Rest of Europe
- Asia Pacific
- China
- Japan
- India
- South Korea
- South-east Asia
- Rest of Asia Pacific
- Latin America
- Brazil
- Argentina
- Rest of Latin America
- Middle East & Africa
- GCC Countries
- South Africa
- Rest of the Middle East and Africa
Competitive Landscape
The competitive landscape of the drinking fountain market includes key players such as Elkay Manufacturing Company, Cuno Incorporated, Bobrick Washroom Equipment, Inc., EVO Water Systems, Beverage Air, Coolers LLC, AmeriWater, Inc., Aqua Bubblers, Inc., Fountains of Youth, Inc., and Bubblers Direct, Inc. These companies compete through innovations in filtration technology, touchless operation, and sustainable designs to meet growing demand for hygienic hydration systems. Global leaders focus on developing energy-efficient and sensor-based fountains equipped with advanced purification and monitoring features. Strategic collaborations with schools, airports, and commercial developers enhance market presence, while smaller players emphasize regional manufacturing and cost-effective solutions. Product diversification, customization, and adherence to water safety standards remain key competitive strategies. Continuous investments in research and eco-friendly materials support the industry’s transition toward smart, durable, and environmentally responsible drinking fountain solutions across commercial and public infrastructure segments.
Key Player Analysis
- Elkay Manufacturing Company
- Cuno Incorporated
- Bobrick Washroom Equipment, Inc.
- EVO Water Systems
- Beverage Air
- Coolers LLC
- AmeriWater, Inc.
- Aqua Bubblers, Inc.
- Fountains of Youth, Inc.
- Bubblers Direct, Inc.
Recent Developments
- In 2025, Zurn Elkay Water Solutions scheduled its Q3 earnings release and highlighted development of a broadened sustainable drinking-water fixtures portfolio including fountains and bottle fillers.
- In February 2024, Elkay, a leading manufacturer of drinking fountains and water bottle filling stations, announced an expansion of their ezH2O line.
- In January 2024, Haws Corporation, known for its drinking fountains and emergency equipment, launched a new line of smart drinking fountains. These fountains are equipped with IoT sensors that monitor water quality, usage patterns, and maintenance needs in real-time.
Report Coverage
The research report offers an in-depth analysis based on Type, Material, End User and Geography. It details leading market players, providing an overview of their business, product offerings, investments, revenue streams, and key applications. Additionally, the report includes insights into the competitive environment, SWOT analysis, current market trends, as well as the primary drivers and constraints. Furthermore, it discusses various factors that have driven market expansion in recent years. The report also explores market dynamics, regulatory scenarios, and technological advancements that are shaping the industry. It assesses the impact of external factors and global economic changes on market growth. Lastly, it provides strategic recommendations for new entrants and established companies to navigate the complexities of the market.
Future Outlook
- The market will grow steadily with rising adoption of touchless and smart hydration systems.
- Public infrastructure projects will increase installations across transport hubs and educational facilities.
- Demand for filtered and UV-purified fountains will rise due to health awareness.
- Manufacturers will focus on energy-efficient and low-maintenance designs.
- Integration of IoT and real-time monitoring will enhance product functionality.
- Sustainability initiatives will drive the shift toward refillable and eco-friendly fountains.
- Asia-Pacific will remain the fastest-growing region due to rapid urbanization.
- North America will retain leadership supported by regulatory compliance and modernization efforts.
- Partnerships between manufacturers and public authorities will expand installation networks.
- Technological innovation and durable materials will strengthen long-term market competitiveness.
Request a Free Sample
Fill in your details and we'll send you a free sample report.
- Sample data tables & charts
- Research methodology
Need a Custom Version of This Report?
Tailor the scope, geography, or segments to your exact requirements.
- Custom geography or segment scope
- Direct access to our analyst team
Frequently Asked Questions
What is the current market size for the Drinking Fountain market, and what is its projected size in 2032?
At what Compound Annual Growth Rate is the Drinking Fountain market projected to grow between 2025 and 2032?
Which Drinking Fountain market segment held the largest share in 2024?
What are the primary factors fueling the growth of the Drinking Fountain market?
Who are the leading companies in the Drinking Fountain market?
Which region commanded the largest share of the Drinking Fountain market in 2024?
Table of Content
Chapter 1 Market Segmentation
- 1.1 Segmentation Framework
- 1.1.1 Product and Service Classification
- 1.1.2 Application and End-Use Classification
- 1.1.3 Technology and Solution Classification
- 1.1.4 Customer and Distribution Channel Classification
- 1.1.5 Geographic Segmentation
- 1.1.6 Market Segment Definitions and Boundaries
Chapter 2 Introduction
- 2.1 Report Objectives and Scope
- 2.2 Product Definition and Industry Terminology
- 2.3 Market Inclusions and Exclusions
- 2.4 Research Process
- 2.4.1 Primary Research and Expert Interviews
- 2.4.2 Secondary Research and Source Review
- 2.4.3 Top-Down and Bottom-Up Estimation
- 2.4.4 Data Triangulation and Verification
- 2.5 Market Size Measurement Basis
- 2.5.1 2024: USD 1.42 billion → 2032: USD 1.99 billion
- 2.6 Historical and Forecast Reference Periods
- 2.6.1 Base Year: 2024
- 2.6.2 Forecast Period: 2024-2032
- 2.7 Research Assumptions and Limitations
Chapter 3 Executive Summary
- 3.1 Market Snapshot and Key Findings
- 3.2 Base-Year Market Size, 2024
- 3.3 Forecast Market Size, 2032
- 3.4 Revenue and Volume Growth Outlook
- 3.5 Key Demand and Supply Indicators
- 3.6 Leading Market Segments
- 3.7 Fastest-Growing Market Opportunities
- 3.8 Regional Performance Highlights
- 3.9 Technology and Industry Transformation
- 3.10 Competitive Landscape Summary
- 3.11 Analyst View and Strategic Implications
Chapter 4 Global Drinking Fountain Market Trends and Developments
- 4.1 Historical Industry Development
- 4.2 Recent Market Trends and Developments
- 4.3 Demand and Customer Behavior Trends
- 4.4 Technology and Product Innovation
- 4.5 Artificial Intelligence, Automation and Digitalization
- 4.6 Local Manufacturing and Supply Chain Realignment
- 4.7 Industry Partnerships, Mergers and Acquisitions
- 4.8 Sustainability and Circular Economy Developments
- 4.9 Government and Private Sector Investment Trends
- 4.10 Emerging Business Models and Commercialization
- 4.11 Industry Developments and Announcements
Chapter 5 Global Drinking Fountain Market Production, Supply and Demand Analysis
- 5.1 Demand Trend and Consumption Analysis
- 5.2 Demand Forecast, 2024-2032
- 5.3 Production and Output Trend
- 5.4 Production and Output Forecast, 2024-2032
- 5.5 Installed Capacity and Capacity Utilization
- 5.6 Company-Wise Production Plants and Statistics
- 5.6.1 Installed Production Capacity
- 5.6.2 Actual Production
- 5.6.3 Planned Capacity and Expansion Targets
- 5.7 Supply Chain Structure and Procurement Trends
- 5.8 Supply-Demand Gap and Bottlenecks
- 5.9 Import Dependence and Sourcing Structure
- 5.10 Contract Manufacturing and Outsourcing
- 5.11 Regional Supply and Demand Concentration
Chapter 6 Global Drinking Fountain Market Pricing Analysis
- 6.1 Pricing Structure and Measurement
- 6.2 Historical Pricing Trends
- 6.3 Pricing Outlook, 2024-2032
- 6.4 Average Selling Price and Unit Economics
- 6.5 Pricing by Product and Market Segment
- 6.6 Geographic Pricing Differences
- 6.7 Key Input, Energy, Labor and Logistics Costs
- 6.8 Contract Pricing and Purchasing Models
- 6.9 Pricing Sensitivity and Competitive Positioning
- 6.10 Price, Margin and Profitability Implications
Chapter 7 Global Drinking Fountain Market Dynamics
- 7.1 Market Growth Drivers
- 7.1.1 Demand-Side Drivers
- 7.1.2 Technology and Innovation Drivers
- 7.1.3 Infrastructure and Investment Drivers
- 7.1.4 Regulatory and Policy Drivers
- 7.2 Market Restraints
- 7.2.1 Cost and Affordability Constraints
- 7.2.2 Technology and Adoption Barriers
- 7.2.3 Supply Chain and Operational Constraints
- 7.3 Market Challenges
- 7.3.1 Competitive Pressure and Margin Erosion
- 7.3.2 Skills, Infrastructure and Implementation Gaps
- 7.4 Emerging Market Opportunities
- 7.5 Market Dynamics Impact and Time-Horizon Assessment
Chapter 8 Global Drinking Fountain Value Chain Analysis
- 8.1 Industry Value Chain Overview
- 8.2 Upstream Suppliers and Critical Inputs
- 8.3 Technology and Component Providers
- 8.4 Manufacturing or Service Delivery
- 8.5 Distribution, Channel Partners and Integrators
- 8.6 Downstream Applications and End Users
- 8.7 Value Addition and Profit Pools
- 8.8 Vertical Integration and Outsourcing
- 8.9 Supplier Concentration and Risk
- 8.10 Supply Chain Localization and Resilience
Chapter 9 Global Drinking Fountain Market Regulations and Policies
- 9.1 Relevant Laws, Standards and Compliance Frameworks
- 9.2 Product, Service, Safety and Quality Requirements
- 9.3 Government Policies, Incentives and Subsidies
- 9.4 Imports, Exports and Trade Barriers
- 9.5 Public Procurement and Local Content Requirements
- 9.6 Environmental and Sustainability Compliance
- 9.7 Upcoming Policy Changes and Market Implications
Chapter 10 Global Drinking Fountain Market Hotspots and Opportunities
- 10.1 Market Opportunity Mapping and Growth Hotspots
- 10.2 High-Growth Applications and Customer Groups
- 10.3 Underserved Markets and White-Space Opportunities
- 10.4 Emerging Technology and Product Opportunities
- 10.5 New Capacity and Investment Hotspots
- 10.6 Market Entry and Expansion Opportunities
- 10.7 Distribution and Partnership Opportunities
- 10.8 Near-Term and Long-Term Commercial Potential
- 10.9 Opportunity Attractiveness and Execution Risks
Chapter 11 Global Drinking Fountain Market Outlook, 2024-2032
- 11.1 Market Size and Analysis
- 11.1.1 Revenue (Market Measurement: 2024: USD 1.42 billion → 2032: USD 1.99 billion)
- 11.1.2 Market Volume and Quantity Sold
- 11.1.3 Historical Market Size
- 11.1.4 Base-Year Market Size, 2024
- 11.2 Market Forecast, 2024-2032
- 11.2.1 Revenue Forecast to 2032
- 11.2.2 Volume Forecast to 2032
- 11.2.3 CAGR and Year-on-Year Growth
- 11.2.4 Incremental Revenue Opportunity
- 11.3 Forecast Assumptions and Scenario Analysis
- 11.3.1 Base-Case Forecast
- 11.3.2 Optimistic and Conservative Scenarios
- 11.3.3 Technology, Pricing and Policy Sensitivities
- 11.4 Market Attractiveness and Growth Outlook
Chapter 12 Global Drinking Fountain Market Segmentation and Outlook
- 12.1 Segmentation Summary and Market Shares, 2024
- 12.2 Largest and Fastest-Growing Segments
- 12.3 Segment Growth Comparison
- 12.4 Segment Attractiveness and Priority Matrix
Chapter 13 Global Drinking Fountain Geographic Market Outlook, 2024-2032
- 13.1 Regional Market Size and Share, 2024
- 13.2 Regional Market Forecast, 2024-2032
- 13.3 Regional Pricing, Production and Demand Differences
- 13.4 North America
- 13.4.1 United States
- 13.4.2 Canada
- 13.4.3 Mexico
- 13.5 Europe
- 13.5.1 Germany
- 13.5.2 France
- 13.5.3 Italy
- 13.5.4 United Kingdom
- 13.5.5 Spain
- 13.5.6 Poland
- 13.5.7 Russia
- 13.5.8 Netherlands
- 13.5.9 Belgium
- 13.5.10 Sweden
- 13.5.11 Denmark
- 13.5.12 Norway
- 13.5.13 Rest of Europe
- 13.6 Asia Pacific
- 13.6.1 China
- 13.6.2 India
- 13.6.3 Japan
- 13.6.4 South Korea
- 13.6.5 Thailand
- 13.6.6 Indonesia
- 13.6.7 Vietnam
- 13.6.8 Malaysia
- 13.6.9 Australia
- 13.6.10 Rest of Asia Pacific
- 13.7 Latin America
- 13.7.1 Brazil
- 13.7.2 Argentina
- 13.7.3 Colombia
- 13.7.4 Chile
- 13.7.5 Rest of Latin America
- 13.8 Middle East
- 13.8.1 Saudi Arabia
- 13.8.2 United Arab Emirates
- 13.8.3 Turkey
- 13.8.4 Israel
- 13.8.5 Iran
- 13.8.6 Rest of the Middle East
- 13.9 Africa
- 13.9.1 South Africa
- 13.9.2 Egypt
- 13.9.3 Nigeria
- 13.9.4 Morocco
- 13.9.5 Rest of Africa
- 13.10 Regional Investment, Policy and Supply Chain Differences
- 13.11 Regional Competitive Landscape
- 13.12 Geographic Growth Hotspots
Chapter 14 Global Drinking Fountain Technology, Innovation and Sustainability Outlook
- 14.1 Technology Landscape and Maturity
- 14.2 Product, Process and Service Innovation
- 14.3 AI, Automation and Digital Tools in the Industry
- 14.4 Technology Adoption and Performance Benchmarking
- 14.5 Innovation Pipeline and R&D Investment
- 14.6 Patent and Intellectual Property Trends
- 14.7 Energy Efficiency and Resource Management
- 14.8 Sustainability, Recycling and Circularity
- 14.9 Technology Roadmap, 2024-2032
- 14.10 Risks of Obsolescence and Technology Substitution
Chapter 15 Global Drinking Fountain Market Key Strategic Imperatives
- 15.1 Growth and Market Entry Priorities
- 15.2 High-Return Products and Segments
- 15.3 Pricing, Profitability and Cost Optimization
- 15.4 Technology Investment and Product Differentiation
- 15.5 Supply Chain Localization and Resilience
- 15.6 Distribution and Customer Acquisition
- 15.7 Partnership, Acquisition and Capacity Strategy
- 15.8 Regional Expansion Priorities
- 15.9 Short-, Medium- and Long-Term Actions
Chapter 16 Competition Outlook
- 16.1 Industry Competition Characteristics
- 16.2 Market Structure and Concentration
- 16.3 Market Share and Competitive Positioning, 2024
- 16.4 Company-Wise Revenue and Product Benchmarking
- 16.5 Production and Service Capacity Benchmarking
- 16.6 Technology, Pricing and Differentiation
- 16.7 Regional Footprint and Distribution Strength
- 16.8 Mergers, Acquisitions and Strategic Alliances
- 16.9 New Entrants and Competitive Threats
- 16.10 Porter's Five Forces and Industry Attractiveness
- 16.11 Competitive Outlook, 2024-2032
Chapter 17 Company Profiles
- 17.1 Company Coverage and Selection Criteria
- 17.2 Leading Market Participants – Standard Profile Structure
- 17.2.1 Business Description
- 17.2.2 Company Ownership and Geographic Presence
- 17.2.3 Product and Service Portfolio
- 17.2.4 Manufacturing and Operating Footprint
- 17.2.5 Production Capacity and Expansion Plans
- 17.2.6 Financial Performance and Investment
- 17.2.7 Market Share and Competitive Position
- 17.2.8 Technology and Innovation Capabilities
- 17.2.9 Strategic Alliances or Partnerships
- 17.2.10 Recent Developments
- 17.2.11 Growth Strategy and Outlook
- 17.3 Other Relevant Market Participants
Note: Every listed company is profiled on the structure shown under the first company. The company list is preliminary and may change based on research findings, market developments, data availability and client requirements.
Chapter 18 Disclaimer
- 18.1 Research and Forecast Disclaimer
- 18.2 Data Source and Estimation Limitations
Note: The depth of individual sections depends on data availability for this market. Volume, capacity, trade and other unit-based metrics are included where applicable.