Market Overview
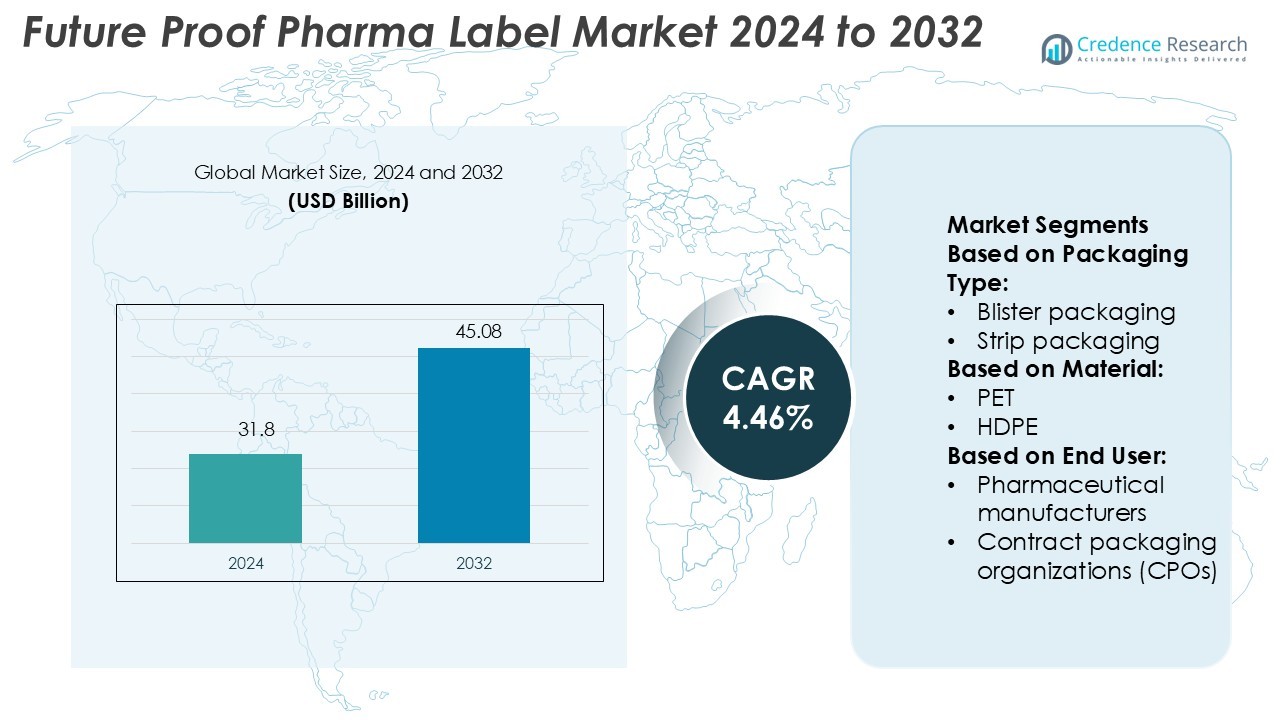
Future Proof Pharma Label Market size was valued USD 31.8 billion in 2024 and is anticipated to reach USD 45.08 billion by 2032, at a CAGR of 4.46% during the forecast period.
| REPORT ATTRIBUTE |
DETAILS |
| Historical Period |
2020-2023 |
| Base Year |
2024 |
| Forecast Period |
2025-2032 |
| Future Proof Pharma Label Market Size 2024 |
USD 31.8 Billion |
| Future Proof Pharma Label Market, CAGR |
4.46% |
| Future Proof Pharma Label Market Size 2032 |
USD 45.08 Billion |
The Future Proof Pharma Label Market is shaped by leading players such as NanoMatriX Technologies Limited, SML Group, Avery Dennison Corporation, Systech, 3M, CCL Industries Inc., Authentix, Alien Technology Corp., SICPA HOLDING SA., and AlpVision SA. These companies focus on integrating advanced security technologies, including RFID, NFC, and blockchain, to strengthen drug traceability and regulatory compliance. Their strategies center on product innovation, strategic partnerships, and sustainable labeling solutions. North America emerges as the leading region, holding a 34% market share, supported by strong pharmaceutical manufacturing capabilities, advanced labeling infrastructure, and strict regulatory enforcement. This leadership is reinforced by continuous investment in digital labeling technologies and serialization systems, positioning the region as a global hub for innovation in pharma labeling.
Access crucial information at unmatched prices!
Request your sample report today & start making informed decisions powered by Credence Research Inc.!
Download Sample
Market Insights
- The Future Proof Pharma Label Market was valued at USD 31.8 billion in 2024 and is projected to reach USD 45.08 billion by 2032, growing at a CAGR of 4.46%.
- Rising regulatory pressure, increased demand for tamper-evident packaging, and growing focus on supply chain security drive market expansion.
- Integration of RFID, NFC, and blockchain labeling technologies shapes major market trends, enabling real-time tracking and authentication.
- Intense competition among key players accelerates innovation, while high implementation costs and complex regulatory requirements act as restraints.
- North America leads with a 34% market share, followed by Europe at 29% and Asia-Pacific at 24%, with RFID-enabled labels holding the largest segment share due to strong adoption across pharmaceutical supply chains.
Market Segmentation Analysis:
By Packaging Type
Blister packaging holds the dominant share in the future proof pharma label market. This dominance is due to its strong barrier properties, ease of product identification, and compatibility with serialized labeling. Blister packs support precise dose labeling, which enhances patient safety and regulatory compliance. Rising demand for unit-dose formats in solid oral drugs further accelerates adoption. Their wide use in prescription and over-the-counter drugs makes them ideal for advanced labeling technologies like RFID and QR codes, enabling efficient product tracking and authentication across the supply chain.
- For instance, NanoMatriX emphasises that its solutions are certified under ISO 27001:2022, ISO 27701:2019, ISO 27017:2015 and ISO 27018:2019 standards, reflecting its capability for secure data handling in traceability systems.
By Material
Plastic dominates the material segment, driven by its durability, flexibility, and cost-effectiveness. It is widely used in packaging bottles, jars, blister packs, and flexible sachets. Plastic materials like PET and HDPE provide strong resistance to moisture and contamination, making them suitable for labeling critical drug products. Their smooth surface allows seamless integration of advanced digital and tamper-evident labels. Additionally, plastic supports variable data printing, enabling manufacturers to comply with serialization regulations and improve traceability. Its versatility makes it a preferred choice across multiple drug packaging formats.
- For instance, SML developed two recyclable plastic films for flexible formats: a 60 µm PE/EVOH film enabling >30 % downgauging compared with PE/PET laminates, and an unlaminated MDO-PE cast film with 35-50 % thickness reduction compared to conventional deep-freeze bag structures.
By End User
Pharmaceutical manufacturers account for the largest share of the end-user segment. Their growing investment in serialization and anti-counterfeiting solutions drives strong demand for future proof labeling technologies. Manufacturers use advanced labels to ensure regulatory compliance, enhance product security, and streamline logistics. These labels also support real-time data capture and supply chain visibility. Rising global production of prescription drugs, along with stricter labeling laws, further strengthens their market position. Their large-scale packaging operations make them key adopters of smart labeling solutions for both primary and secondary packaging formats.
Key Growth Drivers
Rising Regulatory Compliance Requirements
Pharmaceutical companies face strict labeling regulations to ensure product authenticity and patient safety. These regulations drive the need for advanced, tamper-evident, and traceable labels. Manufacturers invest in smart labeling solutions that comply with serialization and track-and-trace laws. Compliance helps reduce counterfeiting risks and improves transparency across the supply chain. This growing emphasis on regulatory alignment encourages faster adoption of secure, high-performance labeling technologies, strengthening market growth.
- For instance, Avery Dennison showcased the AD Minidose U9 UHF inlay, AD TT Sensor Plus 2 temperature logger (with NFC/Bluetooth capability) and S2196 cold-chain adhesive rated down to -196 °C for small-format containers.
Growing Demand for Personalized Medicine
The rise of personalized and precision therapies increases the need for adaptable labeling solutions. Labels must provide patient-specific dosage, storage, and handling details. This trend pushes companies to adopt digital printing and variable data technologies for flexible, accurate labeling. Manufacturers are upgrading systems to support rapid production with minimal errors. This personalization enhances patient outcomes and safety while ensuring regulatory compliance, accelerating label innovation in the pharmaceutical industry.
- For instance, 3M™ Health Care Label Material 7110 is specified for use on “small diameter vials” and “low surface energy (LSE) plastics”, with a construction of fragile facestock plus Adhesive 320.
Increased Focus on Supply Chain Security
The pharmaceutical sector prioritizes securing its distribution networks against counterfeiting and diversion. Labels with embedded security features such as RFID, NFC, and holographic elements enhance traceability. These solutions allow real-time tracking, ensuring product authenticity at every stage. Companies are adopting digital platforms that connect labeling with enterprise resource systems. This focus on secure and intelligent labeling technologies strengthens trust and supports market expansion.
Key Trends & Opportunities
Adoption of Smart and Digital Labels
Pharma companies increasingly adopt smart labeling solutions with connected technologies. Digital labels equipped with QR codes and NFC enable real-time product verification and patient engagement. This trend improves safety, adherence, and transparency across the supply chain. Smart labels also support data integration with cloud platforms, creating new service opportunities for digital health applications.
- For instance, CCL Healthcare (a division of CCL) states it operates over 30 cGMP manufacturing facilities globally for pharmaceutical labelling and packaging. Within its smart-label product suite the company reports production of 2 mL-sized integrated RFID labels
Sustainability and Eco-Friendly Labeling
Sustainable labeling is gaining traction as companies aim to reduce their environmental impact. Biodegradable and recyclable materials are replacing traditional plastics. This shift aligns with global sustainability goals and enhances brand reputation. Green labeling solutions also attract eco-conscious healthcare providers and consumers, opening new market opportunities.
- For instance, Authentix reports that over its 25-year fuel-marking programme it has marked more than 3 trillion liters of fuel and now services programmes treating over 150 billion liters annually.
Automation and Digital Printing Innovation
Automation and digital printing technologies streamline labeling workflows. Companies can handle high-speed printing, variable data input, and customized designs with precision. These innovations reduce operational costs, minimize waste, and improve turnaround times. Advanced printing systems also support regulatory-compliant serialization, strengthening competitive advantage.
Key Challenges
High Implementation Costs
Advanced labeling technologies require significant investment in equipment, software, and skilled personnel. This cost creates barriers for small and mid-sized manufacturers. Integrating smart and secure labeling solutions with existing infrastructure also increases expenses. High initial capital outlay slows adoption among resource-constrained companies, affecting market penetration rates.
Complex Global Regulatory Landscape
Pharmaceutical labeling regulations vary widely across regions, creating compliance challenges. Companies must adapt labeling strategies to meet country-specific standards and language requirements. Frequent updates to regulations add complexity, increasing operational burdens and compliance risks. This fragmented regulatory environment slows product launches and raises costs for global manufacturers.
Regional Analysis
North America
North America leads the Future Proof Pharma Label Market with a 34% market share. Strong regulatory frameworks and advanced pharmaceutical production support high adoption of smart and sustainable labeling technologies. The presence of key pharmaceutical manufacturers and packaging companies accelerates innovation in serialization, tamper-evident labels, and RFID-enabled tracking solutions. Increasing investments in digital labeling and traceability solutions align with FDA compliance requirements. Growing demand for personalized medicines further strengthens the use of intelligent labeling systems. Expanding biotech and specialty drug production continues to fuel market expansion across the U.S. and Canada.
Europe
Europe holds a 29% share of the Future Proof Pharma Label Market, supported by strict regulatory standards and sustainability goals. EU directives drive the adoption of eco-friendly and track-and-trace labeling systems. Pharmaceutical companies are investing in intelligent and counterfeit-resistant labels to meet compliance requirements. Rising focus on supply chain transparency encourages the integration of QR codes, NFC tags, and blockchain-enabled labels. Germany, the U.K., and France remain major contributors due to their advanced manufacturing capabilities. Sustainable packaging initiatives and smart labeling technologies are key growth accelerators in the region.
Asia-Pacific
Asia-Pacific accounts for a 24% share of the Future Proof Pharma Label Market. Rapid pharmaceutical manufacturing growth and regulatory modernization drive adoption of advanced labeling solutions. Countries such as China, India, and Japan are expanding digital labeling and serialization systems to ensure supply chain security. Local players are investing in RFID tags, smart inks, and tamper-proof packaging to address counterfeit risks. Rising healthcare expenditure and expanding generics production strengthen market growth. International pharmaceutical collaborations and regulatory harmonization further support the expansion of smart labeling technologies in the region.
Latin America
Latin America represents an 8% market share in the Future Proof Pharma Label Market. Growing pharmaceutical production and regulatory alignment with international standards support increased adoption of secure labeling solutions. Brazil and Mexico lead the region with rising investments in serialization and anti-counterfeit technologies. The market benefits from increasing awareness of patient safety and supply chain visibility. QR code integration and tamper-evident packaging are gaining traction to reduce product diversion and counterfeiting. Expansion of domestic pharmaceutical manufacturing enhances the region’s labeling technology uptake.
Middle East & Africa
The Middle East & Africa holds a 5% market share in the Future Proof Pharma Label Market. Regulatory modernization and growing pharmaceutical infrastructure support gradual adoption of digital labeling solutions. Countries such as the UAE and South Africa are leading regional adoption with investments in serialization and security labeling technologies. Expanding pharmaceutical imports and distribution networks increase the need for traceable and tamper-resistant labeling. International collaborations with global labeling solution providers are accelerating market development. Improving healthcare infrastructure and rising regulatory enforcement support long-term market growth.
Market Segmentations:
By Packaging Type:
- Blister packaging
- Strip packaging
By Material:
By End User:
- Pharmaceutical manufacturers
- Contract packaging organizations (CPOs)
By Geography
- North America
- Europe
- Germany
- France
- U.K.
- Italy
- Spain
- Rest of Europe
- Asia Pacific
- China
- Japan
- India
- South Korea
- South-east Asia
- Rest of Asia Pacific
- Latin America
- Brazil
- Argentina
- Rest of Latin America
- Middle East & Africa
- GCC Countries
- South Africa
- Rest of the Middle East and Africa
Competitive Landscape
The Future Proof Pharma Label Market is highly competitive, with leading players including NanoMatriX Technologies Limited, SML Group, Avery Dennison Corporation, Systech, 3M, CCL Industries Inc., Authentix, Alien Technology Corp., SICPA HOLDING SA., and AlpVision SA. The Future Proof Pharma Label Market is characterized by intense competition and rapid technological innovation. Companies in this space are focusing on integrating advanced authentication features, such as RFID, NFC, and blockchain, to ensure full product traceability and regulatory compliance. The market is driven by rising concerns over drug counterfeiting and increasing demand for secure, tamper-evident labeling solutions. Manufacturers are investing heavily in R&D to create intelligent, eco-friendly labels that enhance supply chain visibility and product safety. Strategic collaborations with pharmaceutical companies, expansion into emerging markets, and sustainable material adoption are common growth strategies. Continuous innovation enables players to differentiate their offerings and maintain a competitive edge in the evolving pharmaceutical labeling ecosystem.
Key Player Analysis
Recent Developments
- In May 2025, Loftware, announced the availability of their cloud-connected label printing solution for AEP-equipped SATO printers. This comes at a time when the adoption of cloud-based technologies is on the rise, with the Loftware/SATO partnership supporting this shift to streamline business processes and enhance supply chain agility.
- In April 2025, UPM Raflatac becomes the first labeling business to provide product footprints in consumer quotes. These product footprints, known as product passport prototypes (PPPs), provide label converters with transparent environmental data, supporting them to make informed material choices.
- In February 2024, Faller Packaging developed new pharmaceutical packaging solutions that aim to detect counterfeits efficiently and reliably. The Faller Packaging product line includes a tamper-evident paper label that can be recycled.
- In February 2024, Schreiner MediPharm brings to market sustainable closure seals that provide both excellent functionality and tamper protection capabilities. The new closure seals from Schreiner MediPharm expand their security portfolio, while precisely addressing pharmaceutical supply chain threats throughout pharmaceutical secondary packaging sector.
Shape Your Report to Specific Countries or Regions & Enjoy 30% Off!
Report Coverage
The research report offers an in-depth analysis based on Packaging Type, Material, End-User and Geography. It details leading market players, providing an overview of their business, product offerings, investments, revenue streams, and key applications. Additionally, the report includes insights into the competitive environment, SWOT analysis, current market trends, as well as the primary drivers and constraints. Furthermore, it discusses various factors that have driven market expansion in recent years. The report also explores market dynamics, regulatory scenarios, and technological advancements that are shaping the industry. It assesses the impact of external factors and global economic changes on market growth. Lastly, it provides strategic recommendations for new entrants and established companies to navigate the complexities of the market.
Future Outlook
- Smart labeling technologies will gain wider adoption to support strict regulatory compliance.
- RFID and NFC integration will enhance supply chain transparency and drug authentication.
- Blockchain-enabled labels will strengthen anti-counterfeit measures and traceability.
- Eco-friendly and recyclable label materials will become a core industry focus.
- Digital printing advancements will increase label customization and efficiency.
- Pharmaceutical companies will invest more in tamper-evident and secure packaging.
- Cloud-based tracking solutions will support real-time monitoring of product movement.
- Strategic collaborations will expand labeling solutions in emerging markets.
- Automation and AI adoption will boost labeling speed and accuracy.
- Regulatory harmonization across regions will create new market opportunities.



