| REPORT ATTRIBUTE |
DETAILS |
| Historical Period |
2020-2023 |
| Base Year |
2024 |
| Forecast Period |
2025-2032 |
| Exoskeleton Market Size 2024 |
USD 480.13 million |
| Exoskeleton Market, CAGR |
16.15% |
| Exoskeleton Market Size 2032 |
USD 1,585.31 million |
Market Overview:
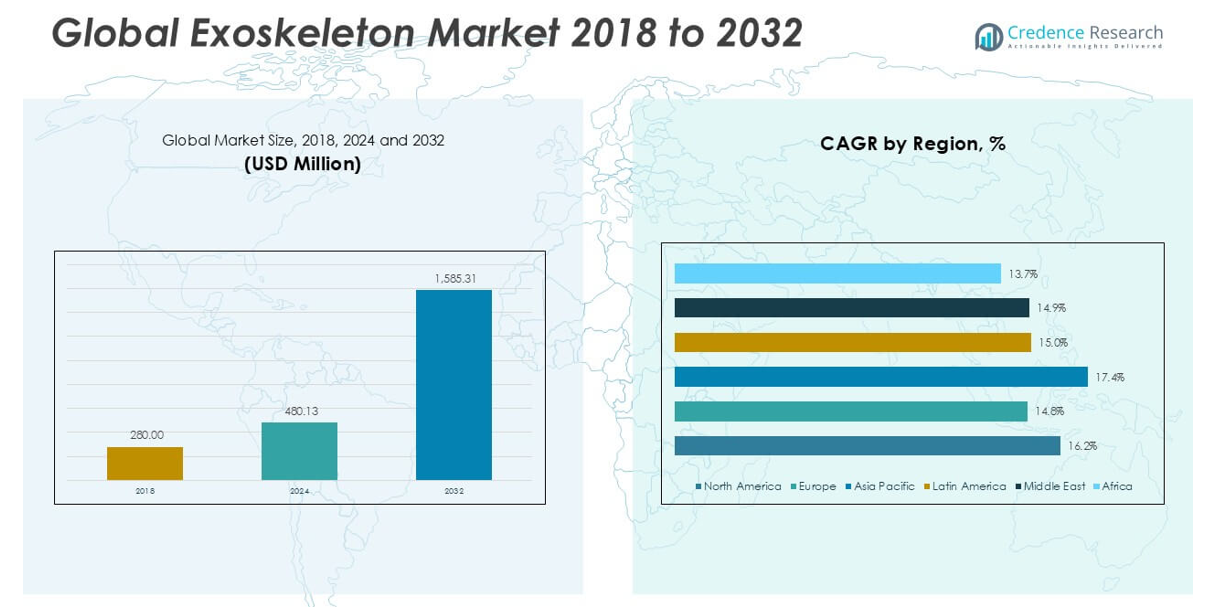
The Exoskeleton market size was valued at USD 280.00 million in 2018, increased to USD 480.13 million in 2024, and is anticipated to reach USD 1,585.31 million by 2032, at a CAGR of 16.15% during the forecast period.
The Exoskeleton market is driven by leading players such as Ekso Bionics, ARMASTEC PTE. LTD, Hocoma, Lockheed Martin Corporation, Suit X, Rex Bionics Plc., RB3D, ReWalk Robotics, Cyberdyne, Inc., ActiveLink (Panasonic Corporation), and DIH Medical. These companies are focused on technological innovations, strategic partnerships, and expanding their product portfolios to cater to the growing demand across healthcare, industrial, and defense sectors. North America leads the global market with a dominant share of approximately 44.7% in 2024, supported by advanced healthcare infrastructure, significant defense investments, and strong industrial adoption. Asia Pacific follows as the fastest-growing region, driven by rapid industrialization and rising healthcare investments.
Market Insights
- The Exoskeleton market was valued at USD 280.00 million in 2018, reached USD 480.13 million in 2024, and is projected to reach USD 1,585.31 million by 2032, growing at a CAGR of 16.15% during the forecast period.
- Increasing demand for mobility assistance and rehabilitation solutions in healthcare, along with growing industrial applications to prevent workplace injuries, are key drivers fueling market growth.
- Integration of AI and IoT technologies, along with rising adoption in military and industrial sectors, are shaping market trends and creating new opportunities for advanced, adaptive exoskeleton designs.
- Leading companies like Ekso Bionics, ReWalk Robotics, and Cyberdyne, Inc. are focusing on product innovation and global expansion, but high costs and regulatory challenges continue to restrain market accessibility.
- North America holds the largest market share at 44.7% in 2024, followed by Asia Pacific with 26.4%; the mobile and lower body segments dominate the market by mobility and extremity.
Access crucial information at unmatched prices!
Request your sample report today & start making informed decisions powered by Credence Research Inc.!
Download Sample
Market Segmentation Analysis:
By Mobility:
In the Exoskeleton market, the mobile segment dominates with the largest market share in 2024. Mobile exoskeletons are highly preferred due to their flexibility, enhanced user mobility, and ease of integration across various applications, especially in healthcare and industrial settings. The rising demand for wearable and lightweight solutions to support rehabilitation and assist physically challenged individuals significantly drives this segment. Additionally, the increasing use of mobile exoskeletons in physically intensive jobs to reduce fatigue and prevent workplace injuries further propels its market growth.
- For instance, Ekso Bionics’ EksoNR exoskeleton has been deployed in over 375 rehabilitation centers globally and supports up to 100 therapy sessions per charge.
By Extremity:
The lower body segment holds the largest market share in the extremity classification of the Exoskeleton market. Lower body exoskeletons are widely utilized in rehabilitation centers and the military sector for gait training, mobility assistance, and physical endurance enhancement. The growing incidences of spinal cord injuries and mobility impairments, coupled with the expanding adoption of robotic rehabilitation technologies, drive this segment’s dominance. Moreover, advancements in sensor technologies and lightweight materials are contributing to the increased deployment of lower body exoskeletons for both therapeutic and industrial purposes.
- For instance, ReWalk Robotics’ ReWalk Personal 6.0 lower limb system enables users with spinal cord injuries to walk independently at speeds of up to 0.71 meters per second.
By End-use:
Within the Exoskeleton market, the healthcare segment leads with the highest market share, supported by growing demand for rehabilitation solutions and mobility assistance for elderly and disabled patients. Exoskeletons in healthcare are extensively used for physical therapy, post-stroke recovery, and gait training, offering substantial benefits in improving patient mobility and reducing recovery time. The increasing prevalence of musculoskeletal disorders and neurological conditions further accelerates the adoption of exoskeletons in hospitals and rehabilitation centers. Additionally, favorable reimbursement policies and continuous technological improvements are expected to bolster the growth of this segment.
Market Overview
Rising Demand for Rehabilitation and Mobility Solutions
The increasing prevalence of mobility impairments, spinal cord injuries, and age-related physical disabilities significantly drives the demand for exoskeletons, particularly in the healthcare sector. These devices offer effective support in rehabilitation programs by improving patient mobility, reducing recovery time, and enhancing physical endurance. Growing geriatric populations worldwide further contribute to this trend, as exoskeletons are increasingly used to assist elderly individuals in maintaining independence and improving their quality of life. The healthcare industry’s growing focus on advanced, patient-centric solutions continues to accelerate market growth.
- For instance, Cyberdyne’s HAL exoskeleton has been clinically proven to increase walking distance by 120 meters per session in spinal cord injury patients after 12 weeks of training.
Growing Industrial Applications to Prevent Workplace Injuries
Exoskeletons are gaining traction in industrial environments to reduce physical strain and prevent work-related injuries among laborers, especially in sectors like manufacturing, construction, and logistics. These wearable systems enhance worker productivity by providing back support, reducing muscle fatigue, and enabling the safe handling of heavy equipment. Increasing employer awareness regarding workplace safety and the need to comply with stringent occupational health regulations are further fueling demand. As industries prioritize worker well-being and operational efficiency, the adoption of exoskeletons is expected to expand steadily.
- For instance, the Laevo V2 industrial exoskeleton has been shown to reduce back muscle electrical activity by 48 millivolts and supports workers lifting 15 kilograms continuously over 8 hours with less fatigue.
Technological Advancements Enhancing Product Capabilities
Rapid advancements in robotics, sensor technologies, and lightweight materials have significantly improved the design, efficiency, and comfort of exoskeletons. Innovations such as AI-driven control systems, improved battery life, and enhanced mobility support are making exoskeletons more accessible and functional across various sectors. These technological improvements are not only increasing adoption in healthcare and industrial fields but are also paving the way for new military applications. Continued research and development efforts are expected to introduce more affordable, adaptable, and user-friendly exoskeleton solutions, driving further market growth.
Key Trends & Opportunities
Expansion in Military and Defense Applications
The military sector is increasingly adopting exoskeletons to enhance soldier performance, reduce fatigue, and improve load-carrying capacity during extended missions. These systems offer strategic advantages by enabling soldiers to move more efficiently while carrying heavy gear. The focus on developing powered exoskeletons with advanced mobility and combat support capabilities presents a significant growth opportunity. Defense investments in wearable robotics for improving mission effectiveness and reducing injury risks are likely to strengthen this trend, positioning the military segment as a lucrative area for future market expansion.
- For instance, Lockheed Martin’s ONYX exoskeleton has been successfully tested to support loads of 90 kilograms and shows a reduction in oxygen consumption by 0.25 liters per minute during load carriage.
Integration with Artificial Intelligence and IoT
The growing integration of artificial intelligence (AI) and Internet of Things (IoT) technologies is transforming the exoskeleton landscape. AI-powered exoskeletons enable adaptive, real-time motion assistance based on user behavior and physical needs, enhancing safety and efficiency. IoT connectivity allows seamless monitoring of device performance and patient progress in healthcare settings. These technological synergies offer opportunities for developing smarter, more responsive systems that can be customized to individual requirements, making exoskeletons increasingly attractive across multiple end-use industries.
- For instance, SuitX’s ShieldX exoskeleton processes sensor data every 200 milliseconds and delivers support torque of up to 35 newton-meters, easing user strain during manual material handling.
Key Challenges
High Cost and Limited Accessibility
One of the primary challenges in the exoskeleton market is the high cost of development, production, and maintenance, which restricts accessibility, particularly for small businesses and individual patients. The advanced technology, specialized components, and complex engineering contribute to the steep pricing, limiting widespread adoption. Additionally, the lack of standardized reimbursement policies in several regions further hampers market penetration, especially in healthcare. Efforts to develop cost-effective models and improve affordability will be essential to unlocking the market’s full potential.
Technical Limitations and Operational Constraints
Despite significant advancements, current exoskeletons still face technical limitations, including restricted battery life, limited load capacity, and potential mechanical failures. These constraints can reduce user comfort and overall system reliability, particularly in demanding industrial or military environments. Moreover, many devices require extensive training for effective and safe usage, which can pose operational challenges. Addressing these technical gaps through continuous innovation and enhanced user training will be critical for sustaining long-term market growth.
Regulatory and Safety Compliance Issues
Strict regulatory requirements for medical and industrial exoskeletons present another key challenge for market players. Obtaining safety certifications and regulatory approvals can be time-consuming and costly, delaying product launches and market entry. Inconsistent standards across regions further complicate global distribution efforts. Manufacturers must navigate complex approval processes while ensuring product safety, reliability, and efficacy. Strengthening regulatory frameworks and harmonizing standards worldwide would help streamline the commercialization of exoskeleton technologies.
Regional Analysis
North America
North America dominates the Exoskeleton market with the largest market share of approximately 44.7% in 2024, driven by advanced healthcare infrastructure, strong industrial adoption, and substantial investments in defense applications. The market in this region was valued at USD 126.34 million in 2018 and reached USD 214.82 million in 2024, with expectations to hit USD 712.21 million by 2032, expanding at a CAGR of 16.2%. High awareness, supportive reimbursement policies, and continuous technological advancements contribute significantly to market growth in North America, particularly in the United States.
Europe
Europe holds a significant market share of around 18.5% in 2024, supported by increasing adoption of exoskeletons in rehabilitation centers and the rising aging population. The market was valued at USD 54.46 million in 2018 and grew to USD 88.47 million in 2024, with projections to reach USD 266.76 million by 2032, progressing at a CAGR of 14.8%. Key growth factors include government initiatives promoting robotic rehabilitation, expanding industrial applications, and growing demand for mobility aids across countries like Germany, France, and the United Kingdom.
Asia Pacific
Asia Pacific is the fastest-growing region in the Exoskeleton market, accounting for approximately 26.4% market share in 2024. The market size rose from USD 71.12 million in 2018 to USD 127.16 million in 2024, and is expected to reach USD 458.03 million by 2032, expanding at a robust CAGR of 17.4%. Rapid industrialization, increasing investment in healthcare infrastructure, and rising awareness regarding robotic mobility solutions drive this growth. Countries like China, Japan, and South Korea are leading the regional market, supported by strong research and development activities.
Latin America
Latin America captures a modest market share of approximately 5.0% in 2024, with growing interest in exoskeletons for industrial safety and rehabilitation purposes. The market expanded from USD 14.34 million in 2018 to USD 24.29 million in 2024, and is projected to reach USD 73.83 million by 2032, advancing at a CAGR of 15.0%. Brazil and Mexico are key contributors, driven by increasing healthcare investments and gradual technological adoption. The region presents growth potential as awareness and accessibility to exoskeleton technologies improve over time.
Middle East
The Middle East holds a market share of around 3.4% in 2024, supported by emerging healthcare applications and rising demand for innovative rehabilitation solutions. The regional market grew from USD 10.36 million in 2018 to USD 16.61 million in 2024, and is anticipated to reach USD 50.09 million by 2032, registering a CAGR of 14.9%. Market expansion is driven by increased investments in modern healthcare facilities and growing adoption in the defense sector, particularly in countries like the United Arab Emirates and Saudi Arabia.
Africa
Africa accounts for the smallest market share of approximately 2.1% in 2024 but shows a steady growth trajectory. The market progressed from USD 3.39 million in 2018 to USD 8.77 million in 2024, with projections to reach USD 24.40 million by 2032, growing at a CAGR of 13.7%. Limited access to advanced rehabilitation technology and lower healthcare spending currently constrain market growth. However, increasing awareness of mobility assistance devices and gradual improvement in medical infrastructure across key African nations present future growth opportunities.
Market Segmentations:
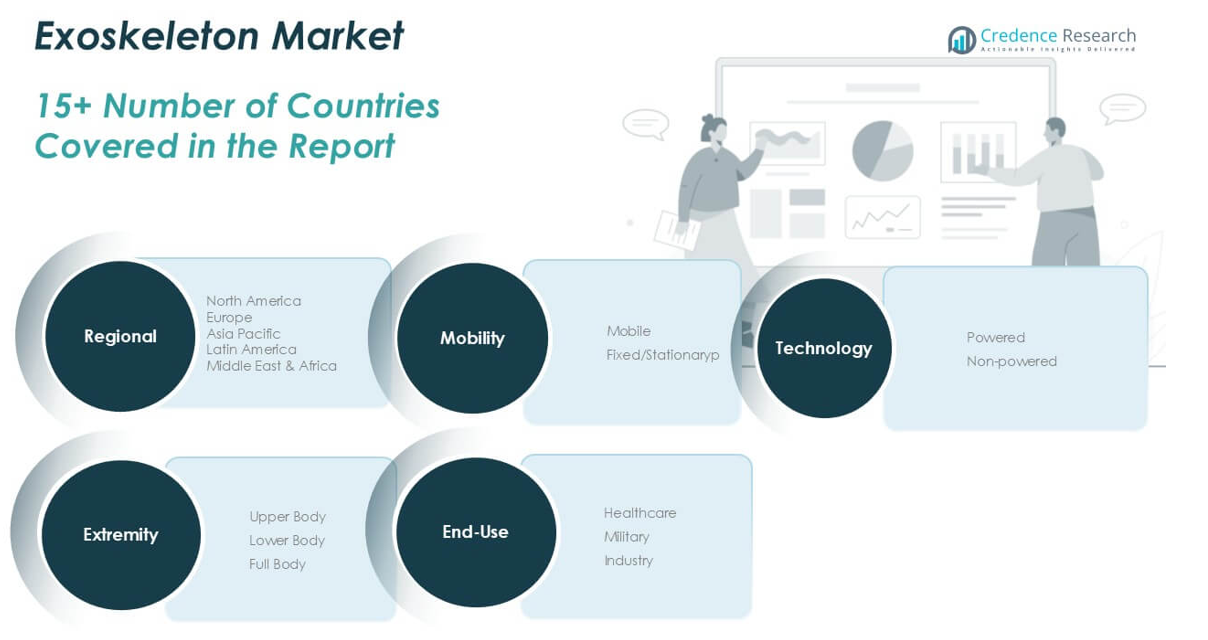
By Mobility
By Extremity
- Upper Body
- Lower Body
- Full Body
By End-use
- Healthcare
- Military
- Industry
By Technology
By Geography
- North America
- Europe
- Germany
- France
- U.K.
- Italy
- Spain
- Rest of Europe
- Asia Pacific
- China
- Japan
- India
- South Korea
- South-east Asia
- Rest of Asia Pacific
- Latin America
- Brazil
- Argentina
- Rest of Latin America
- Middle East & Africa
- GCC Countries
- South Africa
- Rest of the Middle East and Africa
Competitive Landscape
The Exoskeleton market is highly competitive, characterized by the presence of established players and emerging companies striving for technological advancement and market share. Key companies such as Ekso Bionics, ARMASTEC PTE. LTD, Hocoma, Lockheed Martin Corporation, Suit X, Rex Bionics Plc., RB3D, ReWalk Robotics, Cyberdyne, Inc., ActiveLink (Panasonic Corporation), and DIH Medical are actively investing in research and development to introduce innovative, lightweight, and AI-integrated exoskeletons. These companies focus on expanding their product portfolios and enhancing device functionality to meet the growing demand in healthcare, industrial, and defense sectors. Strategic collaborations, mergers, and acquisitions are common in this space as firms aim to strengthen their technological capabilities and global footprint. Continuous product advancements, along with efforts to make exoskeletons more affordable and accessible, are shaping the competitive dynamics of the market. Intense competition encourages innovation, pushing manufacturers to develop user-friendly, energy-efficient, and application-specific exoskeleton solutions.
Shape Your Report to Specific Countries or Regions & Enjoy 30% Off!
Key Player Analysis
- Ekso Bionics
- ARMASTEC PTE. LTD
- Hocoma
- Lockheed Martin Corporation
- Suit X
- Rex Bionics Plc.
- RB3D
- ReWalk Robotics
- Cyberdyne, Inc.
- ActiveLink (Panasonic Corporation)
- DIH Medical
Recent Developments
- In February 2025, DIH Holding US, Inc. expanded its strategic partnership with Zahrawi Group (MTC Company) to include Saudi Arabia, strengthening its collaboration across four Gulf countries. This expansion enhances the distribution of DIH’s advanced robotic rehabilitation solutions, leveraging Zahrawi Group’s healthcare expertise.
- In January 2025, DIH Holding US, Inc. partnered with Nobis Rehabilitation Partners to integrate the Andago overground gait and balance training device into all newly established Nobis hospitals. This collaboration enhances rehabilitation standards, providing patients with advanced treatment while ensuring safety for both patients and therapy teams.
- In November 2024, Hyundai Motor and Kia’s Robotics LAB introduced the X-ble Shoulder, a wearable industrial robot that enhances worker safety and efficiency. It reduces musculoskeletal strain, augments upper arm strength, and ensures user comfort during overhead tasks.
- In June 2024, Ekso Bionics partnered with Shepherd Center to integrate EksoNR and Ekso Indego exoskeletons into its rehabilitation network, advancing research and training programs for mobility-impaired patients. This collaboration aims to enhance clinical practices and support individuals transitioning from hospital to home with exoskeleton technology.
- In February 2024, DIH Holding US, Inc. merged with Aurora Technology Acquisition Corp., securing funding to enhance its global market presence in robotic and VR-enabled rehabilitation technology.
Market Concentration & Characteristics
The Exoskeleton Market shows a moderately concentrated structure with a few leading players holding significant market shares, while several regional and niche companies compete on technology and customization. It is characterized by rapid technological advancement, high development costs, and a strong focus on innovation. Companies prioritize product differentiation through lightweight designs, improved power efficiency, and AI-based mobility assistance. The market demands continuous research to meet evolving application needs in healthcare, industry, and defense. It faces strict regulatory standards, especially in medical use, which impacts time-to-market for new products. The market also shows a growing preference for mobile and lower body exoskeletons due to their operational flexibility and user-friendly design. Strategic collaborations and acquisitions are frequent as companies aim to strengthen their portfolios and global presence. The competitive landscape pushes manufacturers to invest in advanced materials and software integration to offer more affordable and efficient solutions. It remains highly sensitive to pricing, reimbursement policies, and safety certifications, which influence product accessibility across regions.
Report Coverage
The research report offers an in-depth analysis based on Mobility, Extremity, End-use, Technology and Geography. It details leading market players, providing an overview of their business, product offerings, investments, revenue streams, and key applications. Additionally, the report includes insights into the competitive environment, SWOT analysis, current market trends, as well as the primary drivers and constraints. Furthermore, it discusses various factors that have driven market expansion in recent years. The report also explores market dynamics, regulatory scenarios, and technological advancements that are shaping the industry. It assesses the impact of external factors and global economic changes on market growth. Lastly, it provides strategic recommendations for new entrants and established companies to navigate the complexities of the market.
Future Outlook
- The exoskeleton market is expected to witness steady growth driven by rising demand in healthcare, industrial, and military applications.
- Increasing focus on patient rehabilitation and mobility assistance will continue to support the adoption of exoskeletons in medical settings.
- Advancements in lightweight materials and battery technologies will improve device efficiency and user comfort.
- Integration of artificial intelligence and smart sensors will make exoskeletons more responsive and adaptive to individual user needs.
- Industrial sectors will increasingly adopt exoskeletons to enhance worker safety and reduce physical strain.
- Growing military interest in performance-enhancing exoskeletons will open new growth opportunities.
- The market will benefit from improving regulatory support and emerging reimbursement policies, especially in developed regions.
- Expanding manufacturing capacities and cost optimization efforts will gradually improve product affordability.
- Asia Pacific is likely to emerge as the fastest-growing region, supported by rising healthcare investments and industrialization.
- Collaboration between technology providers and medical institutions will drive innovation and expand application areas.


